HAKINMHAN/iStock via Getty Images
Cambria Shareholder Yield ETF (BATS:SYLD) is an actively managed ETF seeking to return higher than average total returns to investors by focusing on a shareholder yield strategy. Shareholder yield is measured by the fund through a combination of three metrics: dividends, net shareholder buybacks, and debt paydowns. SYLD’s end result is a portfolio of roughly 100 high-cash flow companies, which are equally weighted. I appreciate these cash-flow quality factors SYLD employs in selecting and rebalancing the ETF and believe SYLD could be a solid addition to a value portfolio. SYLD is currently trading near its all-time high, therefore rate SYLD a Buy on weakness.
Shareholder Yield: A Different Approach
William Priest is credited with inventing the term shareholder yield in 2005. In an interview with Forbes, he shared there are basically five ways a public company can use its free cash flow: pay a cash dividend, reduce debt, buy back stock, reinvest in the company, and make acquisitions. He suggested the first three components are essentially dividends to investors and have the same effect on shareholders. Some analysts and managers do not include net debt paydown in their shareholder yield calculation, but I find its inclusion creates a higher quality formula for value companies.
Shareholder Yield Formula (Corporate Finance Institute)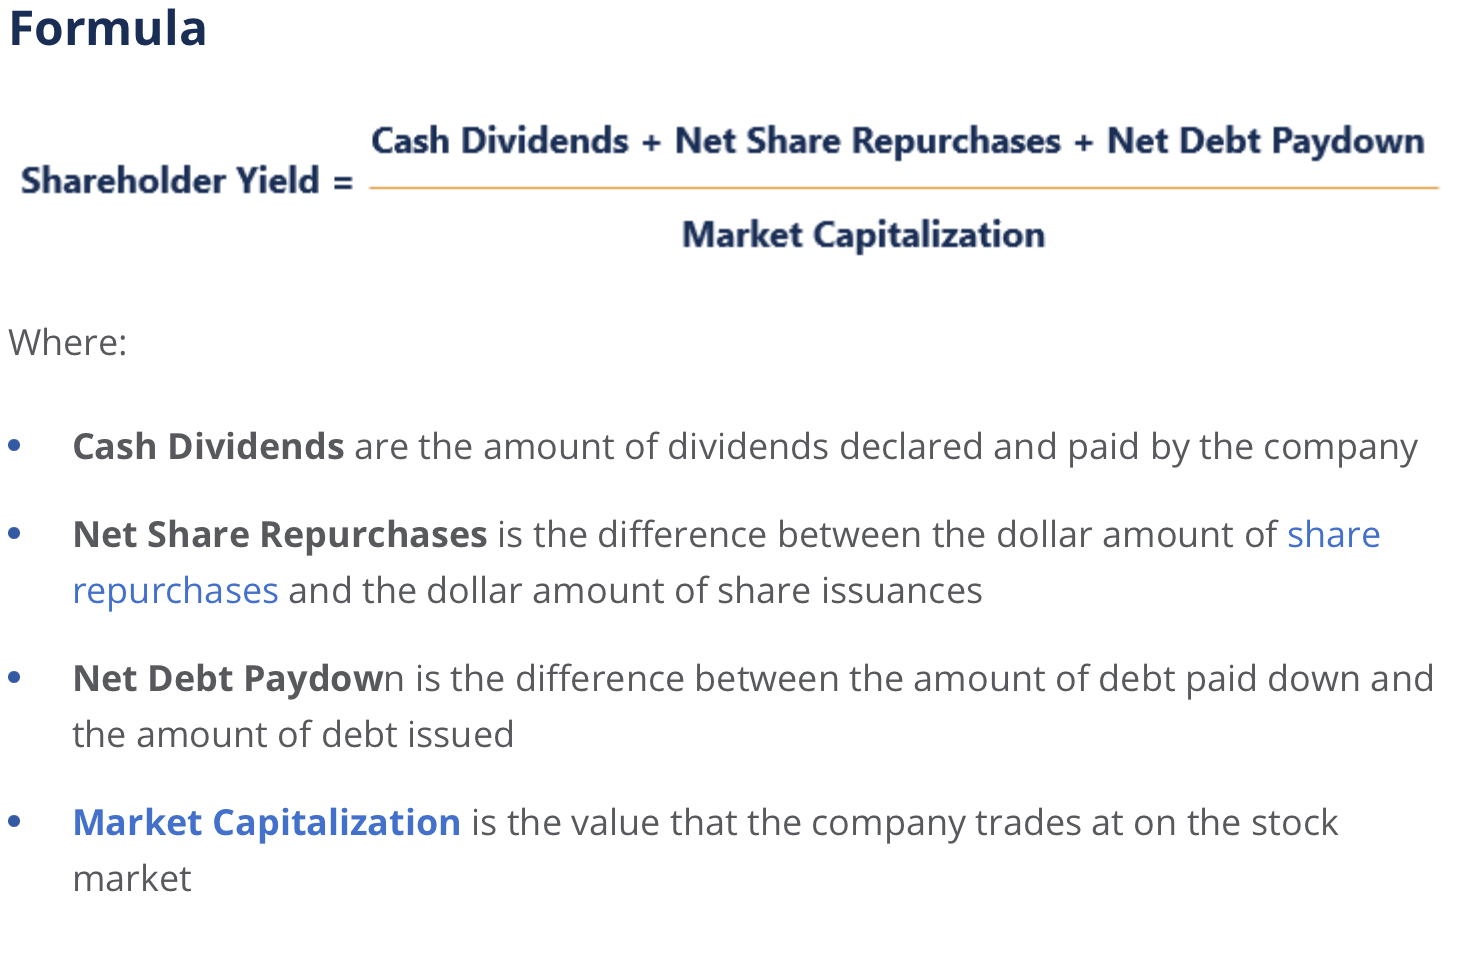
The metric shareholder yield has been used extensively by Cambria’s co-founder, CIO and Fund Manager, Meb Faber, in his research and development of SYLD. He has written numerous white papers and books about the structural shift in how companies returned cash to investors beginning in the 1990s. Rather than focusing only on the cash dividends companies returned to investors, companies started employing stock buybacks more often. There are two ways companies can repurchase shares: through the open market, most commonly, and through tender offers. Reducing the number of shares outstanding helps support the price of the stock. SYLD believes the third metric of paying down debt is an additional quality factor that should be used in evaluating shareholder yield, as it creates higher quality future cash flows to the company.
SYLD Screening Process
SYLD uses a quantitative algorithm to begin screening all US public companies, creating a pool of the top 20% of companies measured by dividend yields and net buybacks. The next screen reduces the pool by including only those companies below their calculated intrinsic value. Further screens throw out those considered value traps. The remaining screens take deep dives into size, liquidity, and various valuation metrics, like low financial leverage, to leave SYLD with the roughly 100 companies the manager believes have the potential for market outperformance.
Size and Sector Characteristics
Seventy-nine percent of the companies currently included in SYLD are mid-, small-, and micro-cap stocks. This leaves about 11% in the large-cap space. The equal-weighting composition ensures low concentration risk, with the top 10 holdings only representing 14% of the fund’s holdings. Looking at the sector analysis, SYLD is heavily weighted in the energy (22.6%), financial (19%) and consumer cyclical (19%) sectors: representing 60% of SYLD’s composition.
Competitors and Performance
There are two primary shareholder competitors to SYLD: WisdomTree U.S. Value Fund ETF (WTV) and iShares Core Dividend ETF (DIVB). WTV and DIVB, however, are both comprised of companies with less small and medium cap exposures, 71% for WTV and 26% for DIVB. Small and mid-cap companies tend to have higher growth rates than more mature larger-cap companies. There are large differences in the top sector weights as well; with both having significant exposure to technology and less to energy than SYLD.
| Sector Holding | SYLD | WTV | DIVB |
| Energy | 23% | 11% | 9% |
| Financials | 19% | 20% | 18% |
| Consumer Cyclical | 19% | 17% | 7% |
| Basic Materials | 14% | 6% | 3% |
| Industrials | 12% | 15% | 9% |
| Health Care | 6% | 8% | 11% |
| Communications | 3% | 5% | 4% |
| Technology | 2% | 11% | 26% |
| Consumer Defensives | 2% | 3% | 8% |
| Real Estate | 0% | 2% | 3% |
| Utilities | 0% | 2% | 3% |
*Source Seeking Alpha
We note SYLD has the advantage of size and liquidity over WTV and DIVB, but has much higher expenses.
| SYLD | WTV | DIVB | |
| AUM | 1.1 billion | 238 million | 300 million |
| Avg. Daily Share Volume | 92K | 19K | 46K |
| Expense Ratio | 0.59% | 0.12% | 0.05% |
*Source Seeking Alpha
While past performance is not indicative of future performance, we believe SYLD’s total return to its shareholders has been worth the higher expenses, as demonstrated in the chart below.
| Total Return | SYLD | WTV | DIVB |
| 6 months | 9.7% | 11.3% | 10.6% |
| 3 YR | 32.3% | 39.1% | 10.6% |
| 5 YR | 107.2% | 79.0% | 77.3% |
| Since WTV inception (11/17) | 122.4% | 102.3% | 95.3% |
| Since SYLD inception (6/13) | 122.4% | n/a | 93.3% |
*Source Seeking Alpha
Valuation
As a fundamental analyst, the weighted average (WA) value metrics SYLD point to potentially strong results in the coming year. Our internal data calculations indicate a WA forecasted revenue growth rate of 20% that can convert to a WA 38% EPS growth rate. A WA trailing twelve-month P/E of 8.4 suggests a potential multiple expansion and, thus, price appreciation. As SYLD focuses strongly on cash flows through dividends, buybacks, and reduced debt, the weighted average forecasted cash flow growth is expected to be 47% this year. These combined metrics suggest the continued strong performance of the companies in SYLD.
Investment Thesis
With strong forecasted fundamentals, SYLD’s quality company screening algorithms and its low P/E ratio, SYLD could be a good addition to a value portfolio. Given that it is largely comprised of small and mid-cap stocks, we would consider it as an allocation to a value small/mid-cap space. It is currently trading near its all-time high, so we would cautiously add now and look for pullbacks to provide stronger buying opportunities.
Risks
Should inflation remain sticky and the Fed keep interest rates higher longer, company price appreciation could flounder. As SYLD looks for companies reducing debt as an indicator of shareholder yield, higher rates can reduce the ability to pay down debt. This is particularly true in the small-cap space, which relies more heavily on floating interest loans than mid and larger-cap companies.
Over the last several years, some US lawmakers have increasingly criticized share buybacks by public companies that culminated in a 1% tax on buybacks through the Inflation Reduction Act of 2022. Should legal pressure on buybacks continue, companies could reduce buybacks, which could lower the shareholder yield forecasts of companies in SYLD.