Pros
- Excellent high 1080p/mid 1440p-quality performance as long as you don’t care about ray tracing
- DisplayPort 2.1 support
Cons
- Card may be too long or too tall to fit comfortably into smaller systems
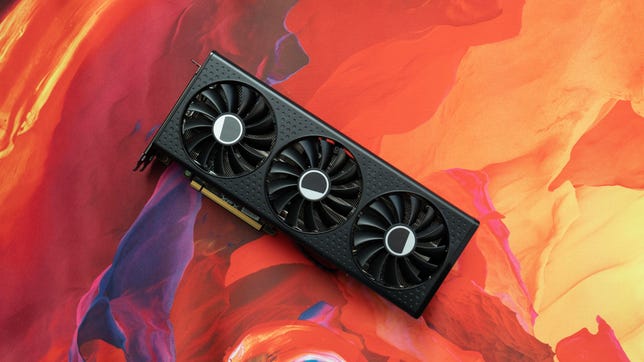
Cards using AMD’s XT graphics chips are analogous to Nvidia’s Ti versions: Generally the same, but designed to draw more power in order to eke more performance out of it where possible. AMD’s Radeon RX 7600 XT fills the slot just above the RX 7600, starting at roughly $50 more ($330), though more powerful cards like the XFX Speedster Qick309 RX 7600 XT I’ve tested can come at a slightly higher premium. In the Qick’s case, that means $350.
The Qick309 has a smaller, cheaper sibling, the $330 Swft210 It’s got two fans instead of three and tops out at lower clock speeds. That also means it doesn’t draw as much power and gets by with a single 8-pin power connection instead of two, like the Qick. (AMD doesn’t make its own card for this GPU.)
There’s a decent performance gap, at least with the between the Qick309 and the RX 7600 I reviewed last year, though not across the board. The extra 8GB that the XT offers over the other chip partially allows for higher quality settings in both 1080p and 1440p, and the extra power can make some games tip over to playable in 4K, as long as you’re willing to use AMD’s upscaling and optimization software.
XFX Speedster Qick309 Radeon RX 7600 XT specs
| Memory | 16GB GDDR6 |
|---|---|
| Memory bandwidth (GBps) | 288 (effective 476.9) |
| Memory clock (GHz) | 2.25 |
| GPU clock (GHz, game/boost) | 2.539/2.810 |
| Memory data rate/Interface | 18Gbps/128 bits |
| Compute units and Ray accelerators | 32 |
| Streaming multiprocessors | 2,048 |
| AI accelerators | 64 |
| Process | 6nm |
| Total board power (watts) | 190 (165w TGP) |
| Max thermal (degrees) | 212F/100C |
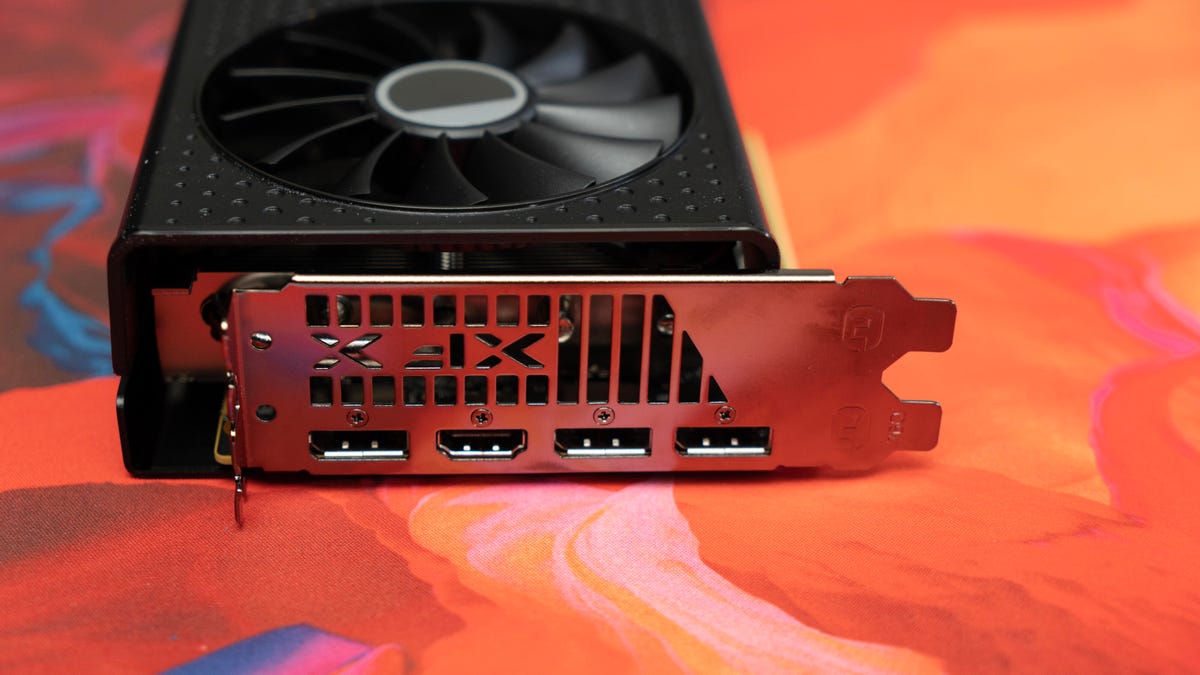
| Connectors | 3 x DP 2.1, 1 x HDMI 2.1 |
| Bus | PCIe 4.0×8 |
| Size | 2.5 slots; 11.9 x 4.5 in (302 x 114mm) |
| Launch price | $350 |
| Ship date | January 24, 2024 |
The smaller size and lesser power draw of the Swft model make it more suitable for upgrading compact systems over the three-fan model. But given the minimal $20 price difference, it seems like that may be its only advantage; with 16GB VRAM, at the very least the 7600 XT is likely to last you longer.
If your budget doesn’t stretch to that extra cost, it’s a more complicated decision, because the alternative is a card using the cheaper (about $300) and less powerful GeForce RTX 4060 — unless you see ray tracing or other games that use DirectX 12 Ultimate for its higher-quality effects.
Unsurprisingly, the Qick309 7600XT and the Qick319 7700 XT I reviewed in September 2023 have extremely similar designs. The model number indicates the number and size of fans, so the 7600 XT has three 90mm fans, where the RX 7700 XT had two 100mm fans and one 90mm. The 7600 XT really doesn’t need those two, which are positioned to more strongly move warm air away from the center of the card; even three fans seems overkill, since it didn’t get very hot (though it might if you overclock it).
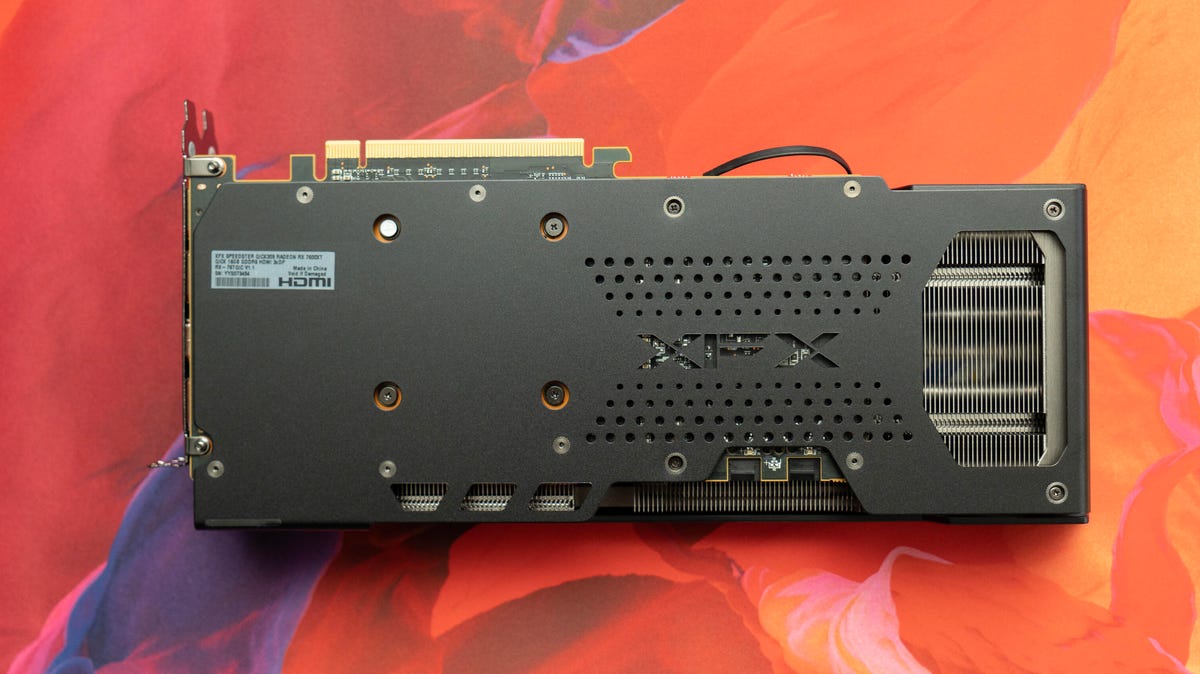
The 7600 XT otherwise has the same solid backplate that acts as a heat spreader, miles of those sharp metal fins for a heat sink and lots of open space for airflow. Though it’s still a lot smaller than than the 7700 XT, it’s still a bit big and may not work as an upgrade in a small- to mid-size system. When installing, I found the two power connectors really tight and a little too close to each other to easily maneuver and ended up having to reopen my system and more aggressively reseat the plugs. That’s less of a gripe than a troubleshooting tip, unless you’re constantly swapping cards like me.

XFX leaves a lot of space for airflow.
Like all models in the RX 7000 series, the card has support for DisplayPort 2.1, which has the necessary bandwidth to support 165Hz at 8K and 12 bits per color (up from 10 bits) for HDR, and to enable full gamut coverage of Rec.2020 or up to 480Hz in 4K. That’s a link bandwidth of up to 54Gbps, up from 20Gbps in DP 1.4a, which Nvidia’s cards still use. I can’t imagine trying to play in 8K with one of the RX 7600 series, but more bandwidth for HDR is always welcome.
The RX 7600 XT’s performance is pretty much exactly where you’d expect it to be relative to its siblings and its competition. Gaming at 1080p and 1440p at typical “high” quality settings, which don’t burden on VRAM, runs about the same as the 8GB RX 7600. At 4K or more “ultra” quality levels, including raytracing, the gap between the cards widens — but I wouldn’t buy the RX 7600 XT expecting to play at 4K without a lot of compromise, like sub-60fps frame rates and/or obviously lesser quality.
There are fewer than a handful of games that already support AMD’s latest FidelityFX Super Resolution 3 (with Fluid Motion Frames), so you’ll likely end up using the less optimal driver-based version if you want upscaling and performance optimizing, or use earlier versions of FSR that are built-into some games. The software version definitely delivers a lift, but it’s not necessarily enough to knock the frame rates up a class. It does occasionally tip it over, though, like pushing it to 75fps from 53fps in Guardians of the Galaxy.
I do find that much of an upscale — from 1440p to 4K — ends up looking oversharpened, with concomitant aliasing (rolling edges) on thin lines that I can never unsee. But I’m a lot more picky about sharpening then a lot of people, and it’s one of those things that people tend to like more when it’s “wrong” than when it’s right. And you can reduce it.

Those heatsink fins can be sharp.
The 7600 XT’s 16GB of VRAM does give it an edge over the 7600 with some types of nongame graphics at 4K resolution, but it’s still fundamentally choked by having the same memory bandwidth and using only four PCI lanes rather than the eight used by cards one class up.
In one of the fewer-than-a-handful of games where FSR 3 has been incorporated, Like a Dragon Gaiden: The Man Who Erased His Name, it still typically ran at less than 60fps upscaling to 4K in Quality mode and ended up backing down a quality level. Even at the FSR Quality setting, I saw some annoying (but not critical) artifacts, though it’s possible that’s the game too.
On the upside, if you’ve got an RX 6000 series card you’re just tolerating, give FSR3 in AMD’s Adrenalin software a try. Maybe you can live with it for another year. I haven’t tested it with one of those RDNA cards, though, so I don’t know what performance is really like.
AMD’s RNDA 3 (used by the RX 7000 series) still lags Nvidia at games that use DX12 Ultimate because it’s still not up to performance par on some of the algorithms used by that programming interface not just ray tracing but optimization tools like mesh shaders. If you’re more interested in higher resolution and/or faster frame rates than the better lighting and reflections ray tracing enables, then don’t worry about it.
This is a solid price/performance option if you want to upgrade to 1440p, but you’ll have to replace it once you start to yearn for 4K.
Relative performance of recent comparable GPUs
Shadow of the Tomb Raider gaming test (1440p)
A750 LE 80RTX 3060 82RX 7600 82RX 7600 XT 85RTX 4060 96RX 6750 XT 115RTX 4060 Ti (8GB) 117
3DMark Time Spy
RTX 3060 8,628RX 7600 10,771RX 7600 XT 11,001A750 LE 13,018RTX 4060 Ti (8GB) 13,477RX 6750 XT 13,562RTX 4070 18,013
3DMark Fire Strike Ultra
RTX 3060 5,269RTX 4060 6,040A750 LE 6,984RX 7600 7,401RTX 4060 Ti (8GB) 7,695RX 7600 XT 7,757RX 6750 XT 9,090RTX 4070 10,413
Guardians of the Galaxy (1440p at maximum quality with ray tracing)
RX 7600 23RX 7600 XT 57RTX 3060 68RTX 4060 79RTX 4060 Ti 98RTX 4070 132
SpecViewPerf 2020 SolidWorks (1080p)
Arc A750 LE 50.64RX 7600 78.18RTX 4060 8GB 99.4RTX 4060 Ti 111.58RX 7600 XT 112.5RX 6750 XT 131.41RX 7700 XT 143.42RTX 4070 154.28
3DMark Speed Way (DX12 Ultimate)
RX 7600 XT 1,913RX 7600 1,955RTX 3060 2,157A750 LE 2,366RTX 4060 Ti (8GB) 3,181RTX 4070 4,479
Test system configuration
| Custom PC | Microsoft Windows 11 Pro (22H2/23H2); 3.2GHz Intel Core i9-12900K; 32GB DDR5-4800; 2x Corsair MP600 Pro SSD; Corsair HX1200 80 Plus Platinum PSU, MSI MPG Z690 Force Wi-Fi motherboard, Corsair 4000D Airflow midtower case |
|---|
Cards used for comparison
| Short name | Graphics card tested |
|---|---|
| A750 LE | Intel Arc A750 Limited Edition |
| RTX 3060 | Asus Dual RTX 3060 OC Edition |
| RTX 4060 | Asus Dual RTX 4060 |
| RTX 4060 Ti | Nvidia GeForce RTX 4060 Ti Founders Edition |
| RTX 4070 | Nvidia GeForce RTX 4070 Founders Edition |
| RX 6750 XT | Sapphire Pulse AMD Radeon RX 6750 XT |
| RX 7600 | AMD Radeon RX 7600 |
| RX 7600 XT | XFX Speedster Qick309 RX 7600 XT |
| RX 7700 XT | XFX Speedster Qick319 RX 7700 XT |

