Aerial view of modern water cleaning facility at urban wastewater treatment plant. Purification process of removing undesirable chemicals, suspended solids and gases from contaminated liquid
Bilanol
With water service franchises in three Pennsylvania counties, York Water (NASDAQ:YORW) is a steadily growing regional small business. The company has increased dividends for 27 years in a row and is therefore among the dividend aristocrats. York Water will be able to offer water services to customers in the acquired areas at a lower price than they had before. This fact makes the company more competitive in terms of new acquisitions. Currently, the company’s stock is available at a relatively favorable valuation.
Business Overview
Founded in 1816, The York Water Company is the oldest investor-owned water utility in the United States.
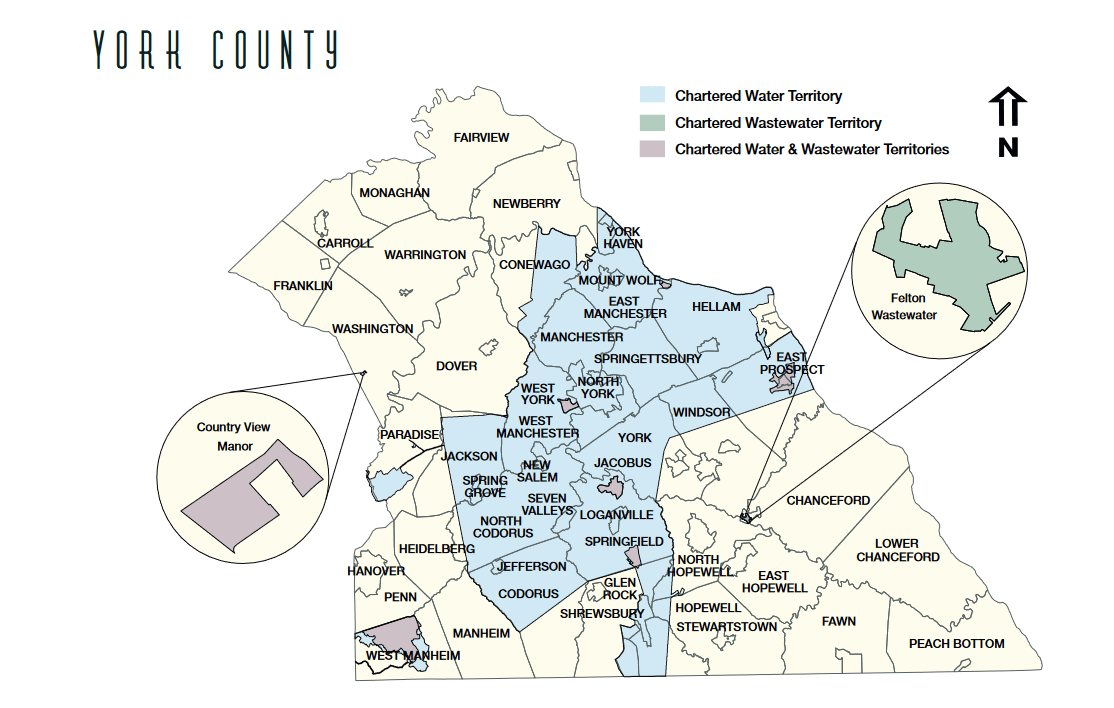
YORW`s water and wastewater service areas (YORW Annual Report 2022)
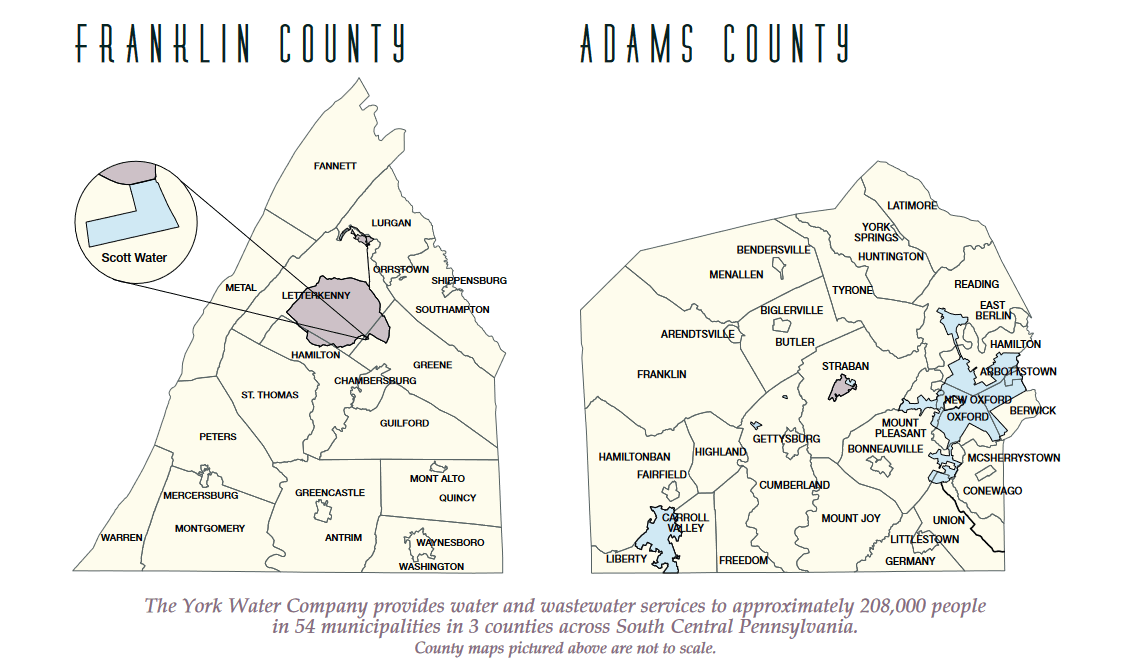
YORW’s water and wastewater service areas (YORW Annual Report 2022)
The maps above show the three southern Pennsylvania counties where York Water Company’s franchised service areas are located. YORW owns two reservoirs located on Williams Lake and Redman Lake. The company has 3 wastewater collection systems, 8 wastewater collection and treatment systems, and 15 miles of pipeline. At the end of 2022, York Water’s average daily water availability was 40.3 million gallons. However, customers’ average daily consumption was 21.1 million gallons.
The franchised service territory has a population of 208,000. This number has increased over time. For example, in 2015, the franchised territory had only 190,000 inhabitants. Both the number of inhabitants and the area of the territory have increased. While water services are currently offered to 54 municipalities, in 2015 there were only 48 of them. Clients include private houses and apartments as well as companies and municipal institutions. If this year new customer contracts have been added by approximately 1,000, then in 2022 approximately 3,500 new customers were added. In total, the company currently has more than 71,000 customer contracts. The addition of new customers and expansion of the franchise area is a key factor for investors.
A Long-Term Review Of YORW Results
The best insight into the company’s stability, success and growth prospects is given by taking a look at long-term data. Let’s look at revenue per share first.
| Year | 2007 | 2008 | 2009 | 2010 | 2011 | 2012 | 2013 | 2014 | 2015 |
|
YORW revenue per share |
2.80 | 2.91 | 3.17 | 3.10 | 3.19 | 3.23 | 3.28 | 3.56 | 3.67 |
| Year | 2016 | 2017 | 2018 | 2019 | 2020 | 2021 | 2022 | TTM |
| YORW revenue per share | 3.70 | 3.78 | 3.75 | 3.98 | 4.13 | 4.22 | 4.30 | 4.76 |
YORW revenue per share 2007-2023 in USD source: roic.ai
Growth has been stable. There has been a marginal decline in 2010 and 2018, which was probably due to the delay in the water service price rate. The average annual sales growth of the period 2007-2023 has been 3.37%. The CAGR of sales over the last decade has been slightly higher at 3.79%. However, CAGR of the last 5 years is 4.88%. Although these growth rates are not very high, it is a good sign that the growth is steady and that the sales growth of the last few years has increased slightly. Let’s look at the EPS growth rates below.
| Year | 2007 | 2008 | 2009 | 2010 | 2011 | 2012 | 2013 | 2014 | 2015 |
| YORW Basic EPS | 0.57 | 0.57 | 0.64 | 0.71 | 0.71 | 0.72 | 0.75 | 0.89 | 0.97 |
| Year | 2016 | 2017 | 2018 | 2019 | 2020 | 2021 | 2022 | 2023 |
| YORW Basic EPS | 0.92 | 1.01 | 1.04 | 1.11 | 1.27 | 1.30 | 1.40 | 1.59 |
YORW EPS per share 2007-2023 source: roic.ai
The EPS CAGR during the period 2007-2023 was 6.62%. Last 10 years EPS CAGR has been 7.80%. However, last 5 year EPS CAGR has increased to 8.86%. As we can see, the EPS growth rate has increased consistently over time. Also, EPS growth has been consistently higher than sales growth.
| Year | 2007 | 2008 | 2009 | 2010 | 2011 | 2012 | 2013 | 2014 | 2015 |
| YORW dividends | 0.47 | 0.48 | 0.50 | 0.51 | 0.52 | 0.53 | 0.55 | 0.57 | 0.60 |
| Year | 2016 | 2017 | 2018 | 2019 | 2020 | 2021 | 2022 | 2023 |
| YORW dividends | 0.62 | 0.64 | 0.66 | 0.69 | 0.72 | 0.75 | 0.78 | 0.81 |
YORW dividends 2007-2023 source: dividend.com
The company’s dividend growth has been slower than profit growth. In the period 2007-2023, YORW’s dividend has grown by an average of 3.46% per year. This suggests that York Water is focused on growth and new business acquisitions rather than increasing dividends.
Improving Profitability
Over the past 10 years, YORW’s net margin has steadily increased. This, in my opinion, is evidence of increasing efficiency. If in 2014 the company’s net profit margin was 22%, by now this figure has increased to 33%. This figure is one of the highest among competing water service companies. This metric is also 230% above the Utilities sector median of around 10%.
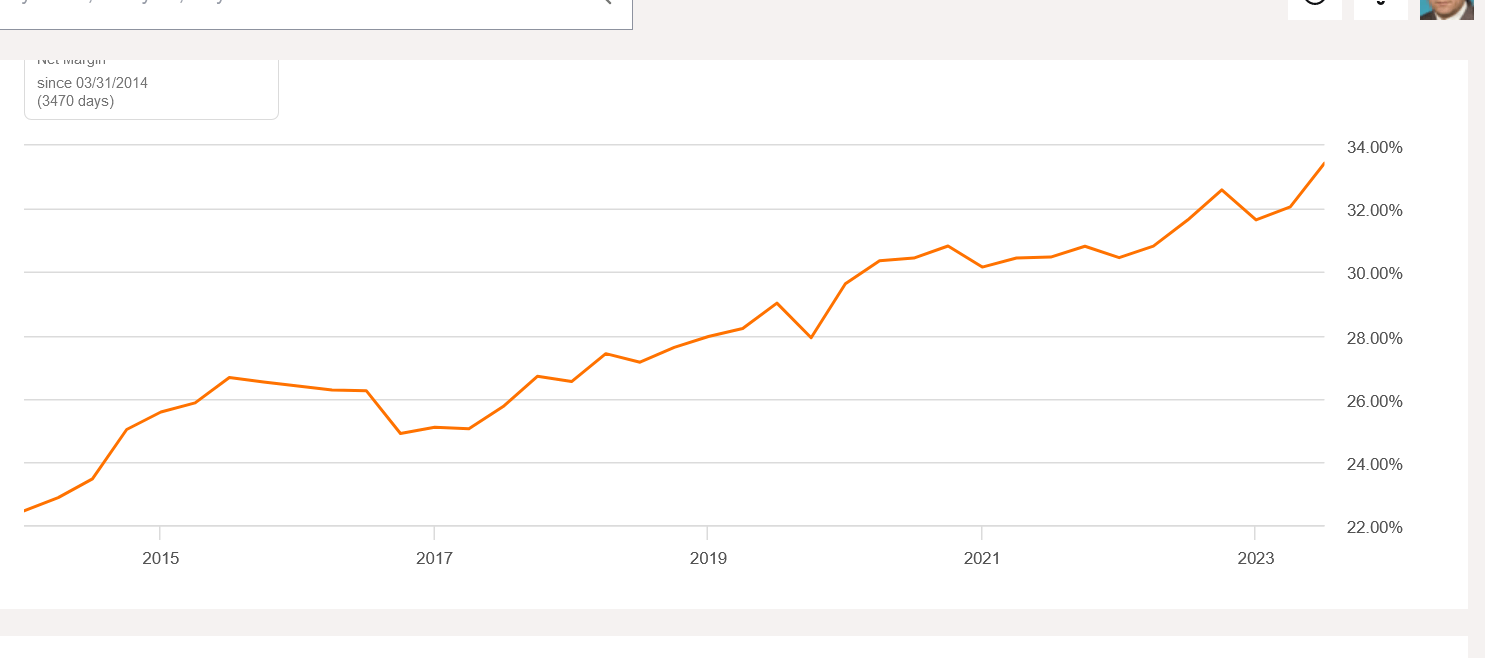
YORW net margin 2015-2023 (Seeking Alpha)
However, the ROE numbers are quite modest, ranging from 9% to 12%. Despite this, the company’s current return on equity of 10.78% beats the sector median of 9.10%.
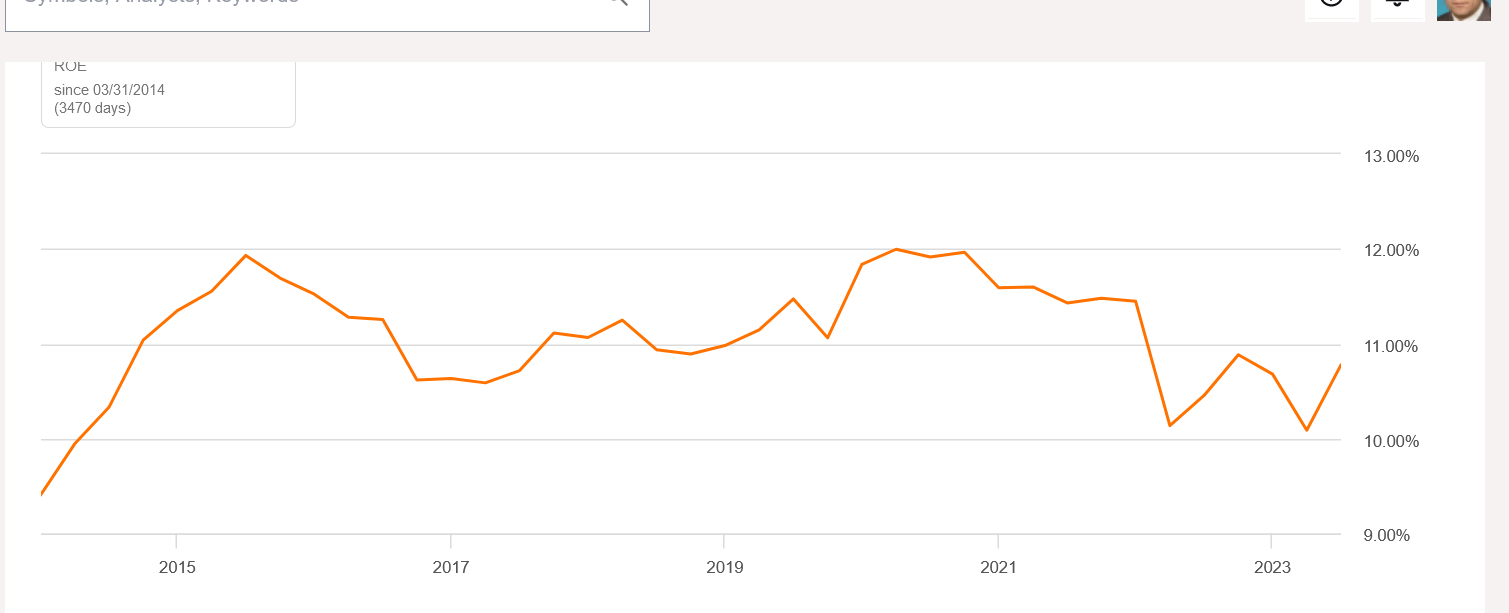
YORW return on equity 2014-2023 (Seeking Alpha)
Balance Sheet Health
York Water’s current debt/equity ratio is 77.2%. The company’s equity is $217.7 million and total debt $168.1 million.
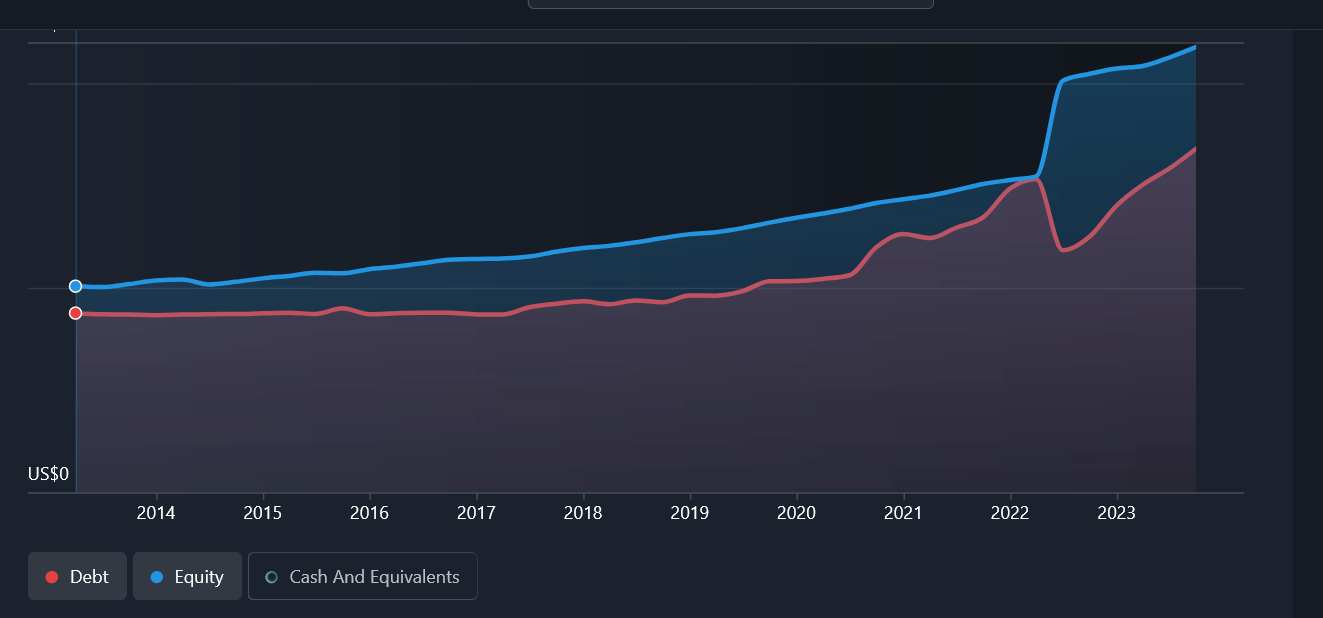
York Water`s debt/equity ratio 2014-2023 (Simply Wall Street)
Is the current Debt/Equity ratio of 77.2% high or low for this company? Let’s compare this historically with the last 10 years of data for the same company.
| Year | Dec 2014 | Dec 2015 | Dec2016 | Dec 2017 | Dec 2018 | Dec 2019 | Dec 2020 | Dec 2021 | Dec 2022 |
| YORW Debt/Equity Ratio | 83.7% | 79.8% | 76.2% | 78.2% | 76.2% | 77.0% | 88.2% | 97.3% | 67.6% |
York Water`s debt/equity ratio 2014-2022 Source: Simply Wall Street
YORW’s average debt/equity ratio over the last 10 years is 80.14%. The current debt/equity ratio is slightly below that. So it can be said that the financial health of the company is good, although the corresponding ratio has increased slightly in recent years. Also compared to competing companies, YORV’s debt/equity ratio is one of the lowest.
| Company | YORW | CWCO | ARTNA | GWRS | CDZI | MSEX |
| Debt/Equity Ratio | 77.2% | 1.20% | 79.99% | 222.19% | 126.73% | 96.71% |
Debt/equity rates of water service companies (TTM) source: Seeking Alpha
YORW’s interest coverage ratio is currently 4.21. The company’s EBIT (TTM) is $27.0 million and the total interest expense is $6.4 million. This indicates that the company would be able to pay its debt interest at 4.21 times from its current EBIT. Such a strong debt coverage ratio allows the company to invest the money left over from interest payments for the growth of the company. Let’s take a look at York Water’s historical interest coverage ratio over the past 10 years. Long-term interest coverage ratio data should, in my opinion, provide insight into whether the company’s financial health and growth prospects are good, and whether management is acting risk-aware.
| Year | 2014 | 2015 | 2016 | 2017 | 2018 | 2019 | 2020 | 2021 | 2022 | 2023 |
| Interest Expense, Total | 5.2 | 5.2 | 5.3 | 5.3 | 5.5 | 5.1 | 4.7 | 4.9 | 5.1 | 6.4 |
| EBIT | 22.1 | 22.7 | 22.9 | 22.5 | 21.2 | 22.3 | 23.1 | 22.2 | 23.2 | 27 |
| Interest Coverage Ratio | 4.25 | 4.36 | 4.32 | 4.24 | 3.85 | 4.37 | 4.91 | 4.53 | 4.54 | 4.21 |
YORW Interest Coverage Ratio 2014-2023 source: Seeking Alpha
It can be seen from the table that York Water’s interest coverage ratio has been consistently over 4 over the past 10 years. Except in 2018. This confirms the fact that the management is conservative in its borrowing policy and the company has had enough money for new acquisitions over a long period of time.
The Results Of The Third Quarter
The results of the third quarter published on November 3 were quite as expected. EPS of $0.53 was up $0.13 from the same quarter last year. The reason for the increase was the new water price rates that entered into force on March 1, as well as the increase in the number of customers. However, the profit growth was reduced by increased operating and maintenance costs. Operating revenue also increased to $18.77 million as expected. It had been $15.81 million in the same quarter a year earlier.
The 18.72% increase in sales compared to the previous year is an impressive result. This shows how crucial water rates are for a water service company.
Competitive Advantage With Competitors
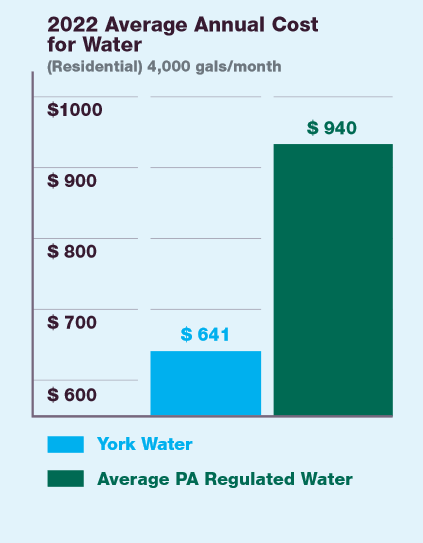
York Water is able to offer its customers the most affordable water service in the area. For example, in 2022, competing water companies in Pennsylvania had an annual water bill of $940 for the average residential customer. However, York Water’s residential customer has an average annual water cost of only $641. Thus, the YORW customer gets his water service approximately one third cheaper.
York Water Annual Report 2022 (yorkwater.com)
Also, customers are apparently quite satisfied with the quality of water services, as the number of customer complaints per 1,000 inhabitants is the lowest in the region. I think that such a competitive advantage will allow the company to expand its franchise area more easily in the future, because customers are interested in cheaper water prices.
Increase In The Number Of Shares
The number of York Water shares has increased over time. This is quite typical of a growing company. The average annual growth of the number of shares has been 1.23% in the last decade. For the investor, of course, this dilutes earnings per share a bit.
| Year | 2014 | 2015 | 2016 | 2017 | 2018 | 2019 | 2020 | 2021 | 2022 | 2023 |
|
Total Common Shares Outstanding |
12.8 | 12.8 | 12.9 | 12.9 | 12.9 | 13.0 | 13.1 | 13.1 | 14.4 | 14.3 |
Number of York Water shares 2014-2023 (in millions) source: Seeking Alpha
Valuation
Let’s first evaluate YORW’s valuation using the DCF method.
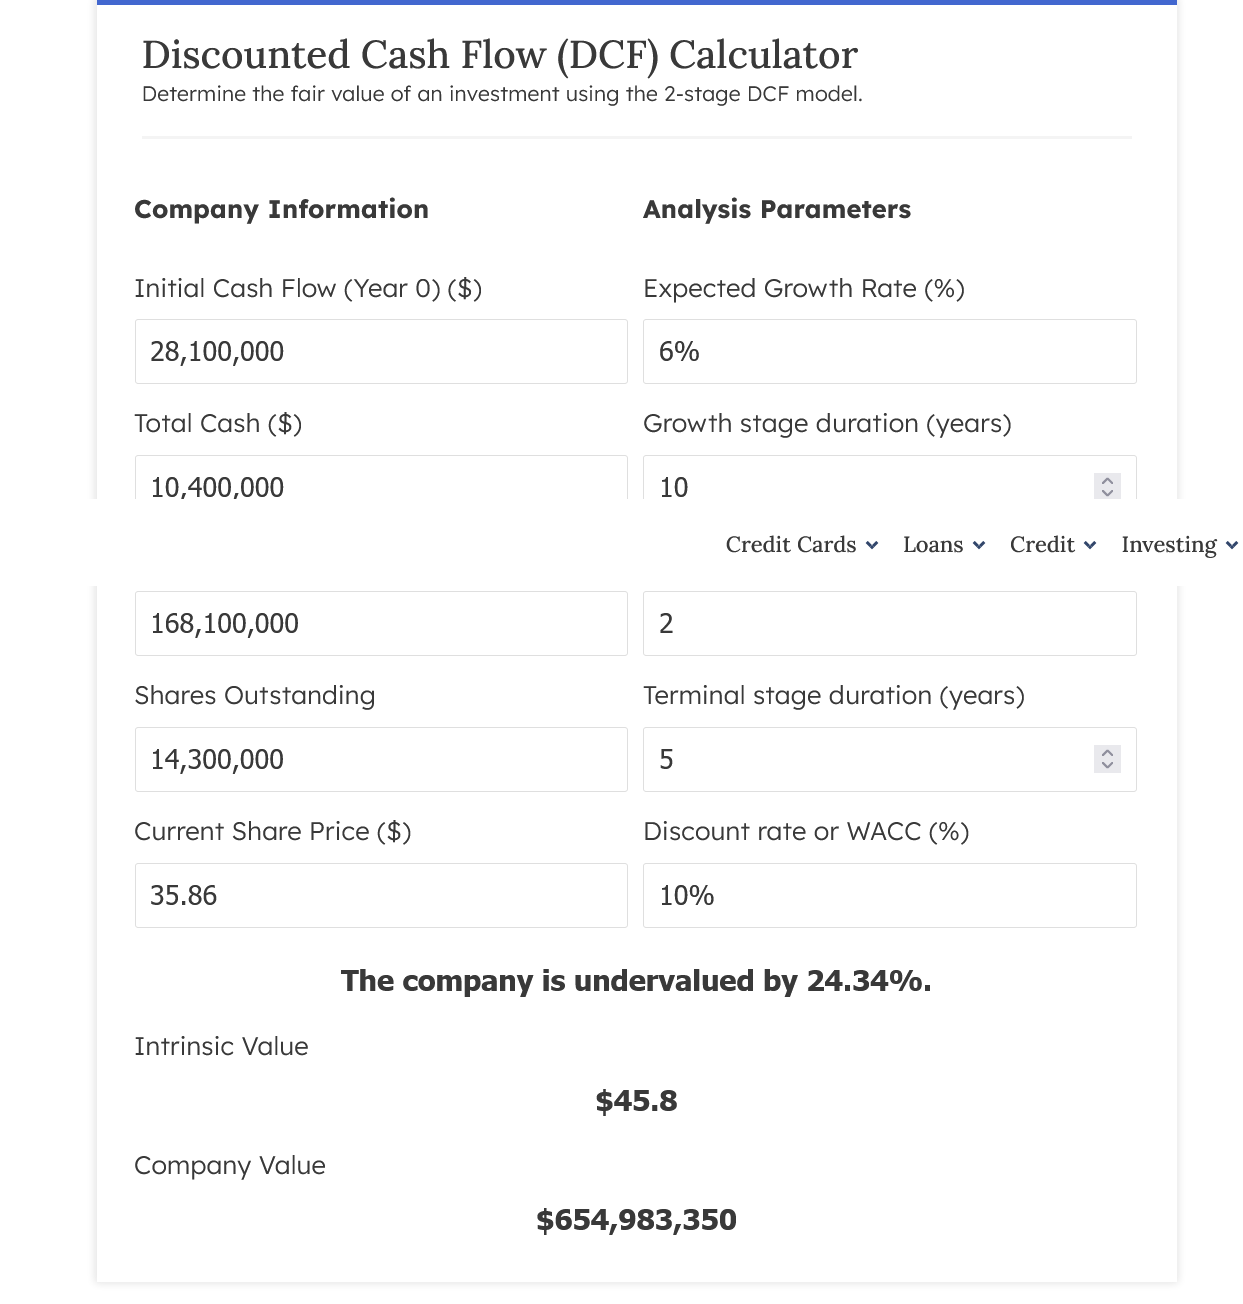
Fair value of YORW by DCF method (finmasters)
I used a conservative 6% as the expected growth rate, even though the company’s EPS CAGR over the last decade has been 7.80%. I used 10% as the discount rate considering the current high interest rate. Based on this data, YORW’s fair price is $45.8 and the company is undervalued by 24.34%.
By relative valuation metrics, York Water also appears to be undervalued. The company’s P/E (FWD) of 22.55 is significantly lower than its 5-year average P/E ratio of 33.35.
Also compared to its competitors, YORW’s price/earnings ratio is favorable.
| Company | YORW | CWCO | ARTNA | GWRS | CDZI | MSEX |
| P/E ratio (TTM) | 22.55 | 22.57 | 23.46 | 38.03 | -4.39 | 31.10 |
P/E ratios of water service companies source: Seeking Alpha
Of the 6-member table above, only CWCO is more favorably priced than YORW.
Risks
The main risk factor for York Water is that it is a regional company. When expanding its franchise area, it has to compete with other water service companies. Some of the competitors are large market players such as American Water Works (AWK) who have the advantage of economies of scale. Also, getting new acquisitions depends on regulatory approval.
The rate of water price depends on only one regulator. That’s what the Pennsylvania Public Utility Commission (PPUC) is for. If this regulator delays a decision or makes an unfavorable decision for York Water, it will have a negative impact on the company.
Conclusion
I give York Water a buy rating for the following reasons:
This company has been steadily growing and profitable over a long period of time. YORW’s franchise territory and number of customers are constantly growing. Profitability is improving and financial health is good. In addition, York Water is currently favorably valued based on both the DCF method and relative valuation metrics.

 Q2 2024 Earnings Call Transcript")

