pcess609
There are three basic trending methods: the moving average, the breakout, and linear regression. For those that are unfamiliar with the rules:
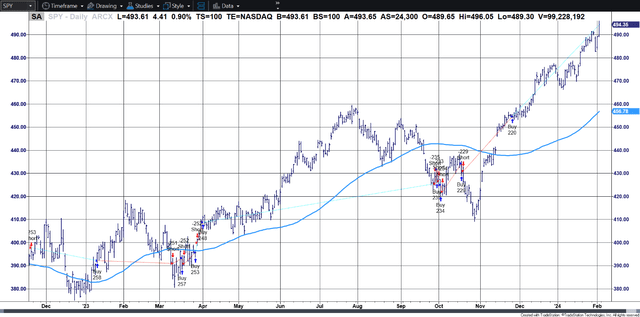
The (N-day) moving average (MA) simply averages the prices of the past N days. When prices rise, the average is below the prices. When prices fall, the average is above price (see Chart 1). When the trendline turns up, you buy, when it turns down you sell.
Chart 1. An 80-day moving average line for SPY.
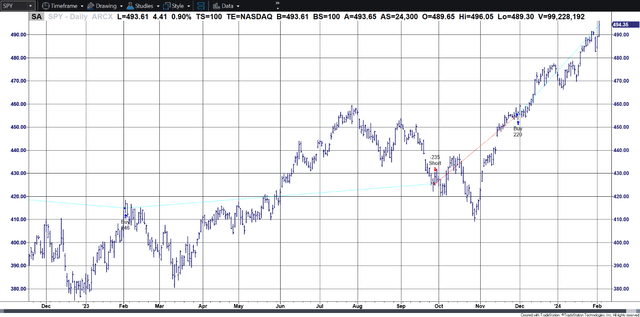
The breakout (BO) is the simplest concept. You buy when there is a new high over the past N days and sell when there is a new low over the same N days. See Chart 2.
Chart 2. An 80-day breakout applied to SPY. Trade indications show 80-day new highs and lows.
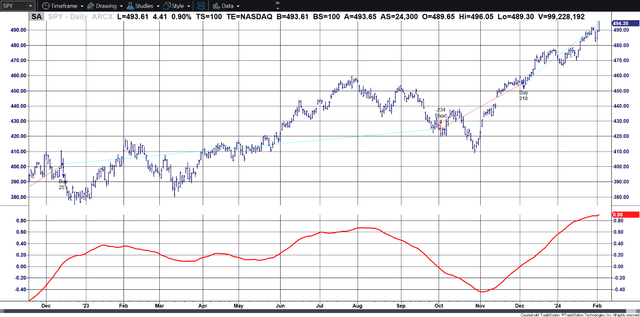
The N-day linear regression (LRS) is the slope of a straight line, similar to what you would draw on a chart to represent a trend. However, it goes through the middle of prices, rather than drawn across the lows or highs of the move. In Chart 3 the 80-day slope appears at the bottom. The system buys when the slope crosses zero moving higher and sells when it crosses zero moving lower.
Chart 3. 80-Day linear regression applied to SPY. The slope is shown at the bottom.
The Good and the Bad
The moving average tends to have more losing trades, up to 70%, but mostly small. It counts on a few very large gains when it finds a good trend. These gains are often called the “fat tail.” You have seen them in Amazon, Tesla, and in the U.S. bonds, all of which kept moving higher for a surprising number of years. The moving average tends to give back a large part of the gains when exiting a position. The fact that it lags behind prices is also its advantage. It allows you to stay with the trade. Analysts call it a conservation of capital approach.
The breakout tends to have a high reliability. In exchange it has a high risk, the difference between the N-day high and the N-day low. That difference (high to low) allows prices to move around without exiting the trade. A move to new highs or lows is considered important. It usually occurs when a new fundamental event has occurred.
Linear regression is a way of recognizing the trend in the same way you would draw a line on a chart. Its characteristics of risk are between a moving average and a breakout.
All three techniques have more risk when you use a longer calculation period (the “N-day”). They all tend to fail with shorter periods because all need a well-defined trend. Given that, they all make money when there is a trend and lose when there is no trend.
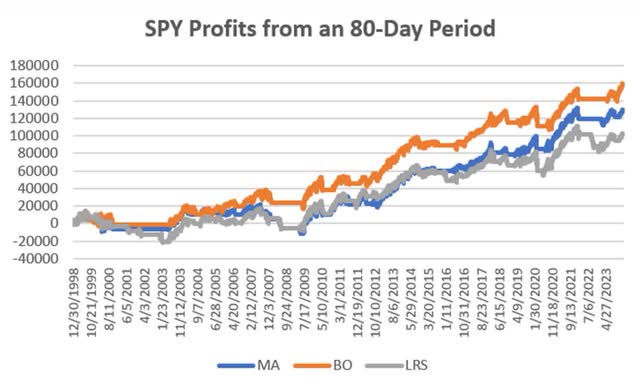
Chart 4 shows the returns of an 80-day trend for all three strategies. These results are for the S&P ETF SPY from 1998, long only, position size based on $100,000 divided by the price on the day before entry. I use 80-day because is a typical value for a macrotrend fund. Clearly, they are all correlated.
Chart 4. Trends of all three methods using an 80-day period from 1998 on SPY.
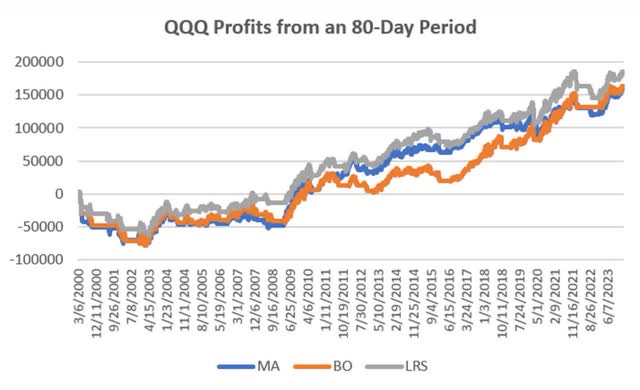
Chart 5 shows the same comparison for the Nasdaq ETF QQQ. As with SPY, all methods are correlated. For SPY, the best is the breakout, for QQQ the best is the linear regression. We would like to see if there is a better trend approach than the default 80-days that we used.
Chart 5 compares the same three strategies for QQQ, the Nasdaq ETF for an 80-day calculation period.
Which is Best?
I have explained the good and bad briefly. Now let’s look more closely.
Because the returns are similar for the three methods, then it’s the risk that makes the difference. Risk can be the maximum drawdown, the frequency of losses, the recovery from loss, or the amount given up to exit a trade. Or, you may have your own idea of risk.
When testing both SPY and QQQ, I believe that a better system is one where the same parameters work across both markets. It shows the ability to handle more patterns. Of course, you can optimize each, but then you count on those patterns being different, and you are testing on a smaller sample. A more general solution often has lower returns but comes closer to what you would see in the future.
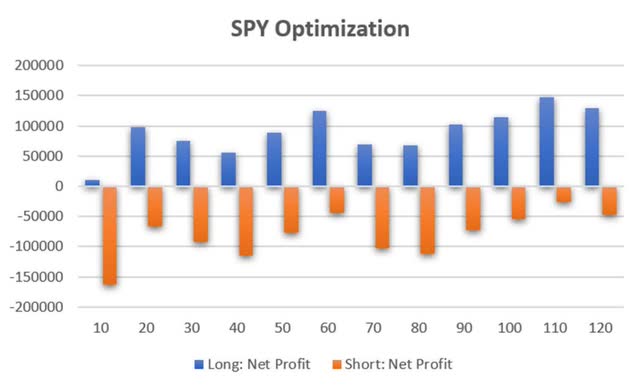
We’ll look only at long equity positions. Chart 6 shows why. All long moving average calculation periods are profitable, while all shorts post net losses.
Chart 6. Returns from a moving average system, SPY from 1998.
Testing SPY for the Three Strategies
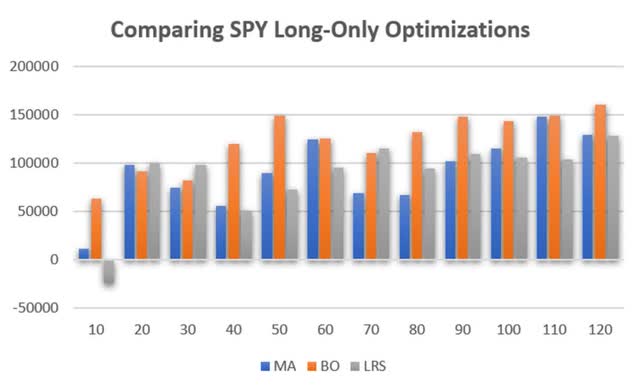
In Chart 7 we see the results of an SPY test for the three strategies. It seems clear that the breakout (BO) is the winner. We can say that, not just because it has the highest single returns, but it also has the highest average of all tests. While all periods from 90 to 120 are similar, the 120-day average is better.
Chart 7. Comparing returns of three strategies for SPY.
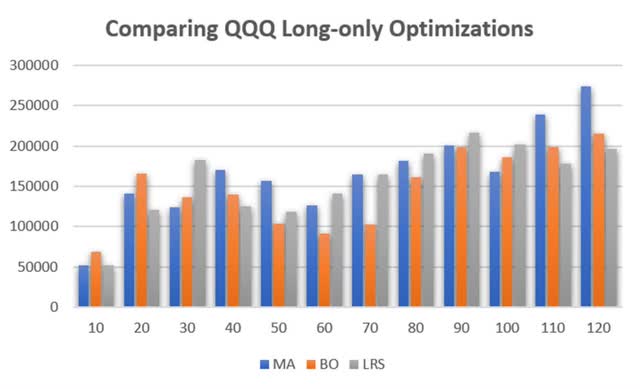
Testing QQQ gives different results. While the best return is the 120-day period, the moving average does best, as shown in Chart 8. We now need to look at risk.
Chart 8. Comparing returns for QQQ for the three strategies.
It looks as though 120-day calculation period is a better choice than the original test of 80 days. Just to be clear, some analysts will test to 150 days or even 200 days. I find that too slow, but you might not. The slower the period, the more risk when the market turns. I find 120 days is my limit.
Drawdowns
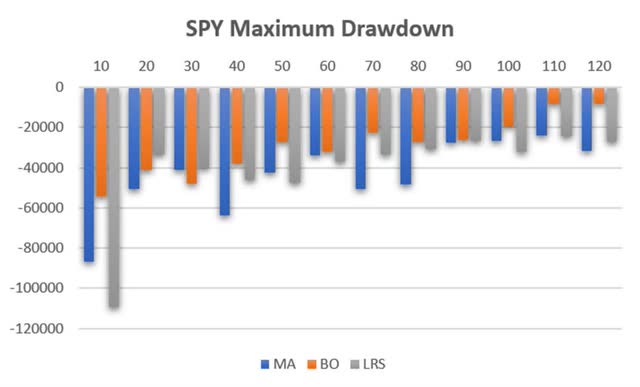
Chart 9 shows the maximum drawdown of all the periods in the SPY test. It is interesting because the faster trends have larger drawdowns. Based on a $100,000 investment, the trends at the far right lost about 35%, with the breakout even smaller. Remember that, while the moving average takes small losses, it does it often, so the cumulative loss can be large.
Chart 9. SPY Maximum drawdown.
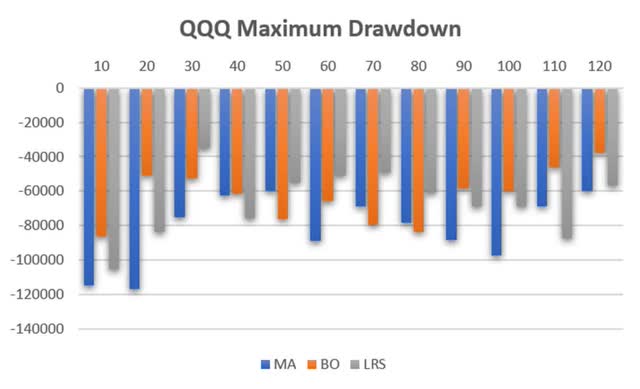
Nasdaq is not nearly as good (Chart 10), but then we know it is more volatile than SPY. Still, the far right shows the smallest drawdown, about 60%, and the breakout system is best at 40%.
My Conclusion
It turns out that 120 days is best for the returns of SPY and QQQ. That has gone up from the 80 days that was most popular. The breakout system has the smallest drawdown of the three systems. Let’s put that in numbers. According to the ratios, it is far better than other methods for SPY.
Data source: CSI and TradeStation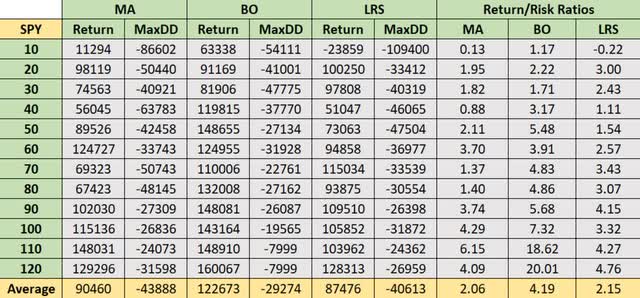
Table 1. SPY Returns and Drawdowns for each trend method.
Nasdaq results are closer, with the regression results slightly better than the breakout, but not at the longer trend periods. All three methods have scattered results, but the breakout is more consistent towards the longer periods. My experience tells me that picking the 20-day breakout or the 30-day regression would be overfitting.
Data source: CSI and TradeStation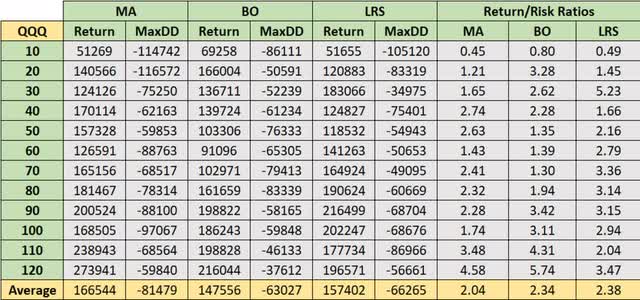
Table 2. QQQ Returns and Drawdowns for each trend method.
I can understand that some traders do not like the initial risk of a breakout, but it has an intrinsic logic. Prices move to new highs and lows when something new happens. In that regard, it reacts to fundamentals. And, don’t forget that a lot of small losses in the moving average can amount to much more than the initial risk of a breakout.
