Dilok Klaisataporn
Introduction
As we venture into 2024, the global economic landscape continues to evolve, marked by both challenges and opportunities. The Nasdaq and the Invesco QQQ Trust are central players in this dynamic environment, reflecting the innovative and tech-driven sectors shaping our future.
2023 was a year pivotal year for the Nasdaq, not just due to the geopolitical tensions affecting global trade but also because of breakthroughs in financial technology, such as the emergence of Bitcoin ETFs.
The robust performance of tech-heavy indices like the Nasdaq, often outpacing traditional benchmarks such as the S&P 500, highlights a market rich with optimism but lots of volatility. This article aims to dissect these multifaceted developments, we will be analyzing key economic indicators and policies relevant to all indices, primarily Nasdaq and (NASDAQ:QQQ). As we can see in the graph below, QQQ has increased by almost 48% over a 1-year period, which may leave many wondering if there is still fuel left on the train.
Ycharts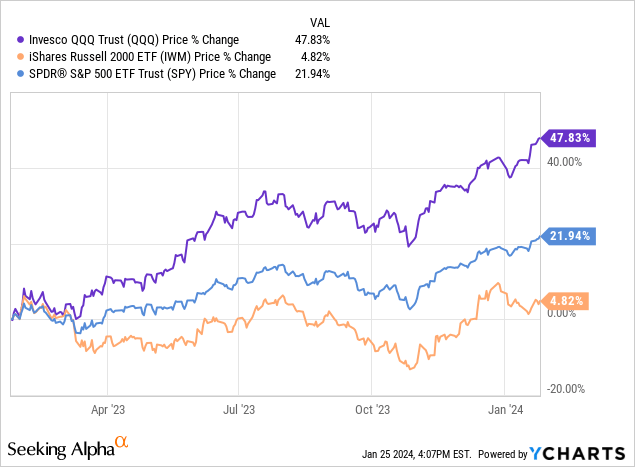
We will explore the pivotal role of the Federal Reserve in steering the U.S. economy amidst inflationary challenges, focusing on its impact on technology and growth sectors predominantly represented in the Nasdaq. The nuances of China’s economic fluctuations will be examined, particularly their influence on global tech industries and Nasdaq-listed companies.
Furthermore, we’ll delve into the intricate interplay between the global bond, stock, and commodities markets, emphasizing how shifts in these areas affect the market. For investors and policymakers navigating this dynamic terrain, understanding these factors becomes crucial in forecasting and adapting to the economic realities of 2024, especially in the tech and innovation-driven markets that are central to the Nasdaq and QQQ.
The Fight Against Inflation
The Federal Reserve, commonly known as the Fed, is primarily responsible for managing US monetary policy by controlling the money supply and setting interest rates to promote maximum employment and price stability and moderate long-term interest rates of around 2% to ensure economic stability. In addition, the Fed plays a vital role in ensuring the stability of the financial system as a whole by regulating and supervising domestic and foreign banks operating in the U.S. to ensure their health and compliance with consumer credit protections.
The Fed also provides critical financial services to depository institutions, the U.S. government, and foreign official institutions, including managing payment systems. A significant part of its mandate is to manage inflation and employment levels, frequently using tools like adjusting the federal funds rate to influence the economy.
The indicators we want to focus on are the following:
Consumer Price Index (CPI): You probably have heard of the CPI a fair bit over the last 2 years, but what actually is the CPI, you might ask. The CPI reflects the cost of living by measuring changes in the price level of a consumer goods and services market basket. Hence, it is a widely used indicator in macroeconomics.
The fluctuations in the CPI over the past 24 months can be attributed to several factors, including supply chain disruptions (remember the Suez Canal obstruction due to the Evergreen), changes in consumer demand, and policy responses to the pandemic.
Recently, the Federal Reserve highlighted during their December 2023 meeting that they are closely watching certain important signs. This careful observation is part of their effort to manage the delicate balance between aiding economic growth and keeping inflation in check, a task that both the market and the Fed are keenly focused on.
Personal Consumption Expenditures Price Index (PCE): The PCE Price Index is an essential economic indicator that measures the average changes in prices of goods and services consumed by households in the United States. The PCE Index differs from the CPI in that it includes all household goods and services, including those paid for by third parties such as employers or government programs, offering a broader view of inflation.
This responsiveness to consumer patterns makes it a preferred measure for the Federal Reserve when setting monetary policy, which we also discussed in our previous market outlook analysis. The Core PCE Index, which strips out the more volatile food and energy prices, provides a clearer view of underlying inflation trends and is closely monitored by economic policymakers. The graph below shows the PCE has been on a relatively stern downtrend, headed for the Fed’s 2% target.
In our last piece in this series, we argued that the PCE is the Fed’s preferred indicator for inflation. Under the same assumption, it looks like the Fed’s fight is beginning to come to an end.
Stock info with tradingeconomics.com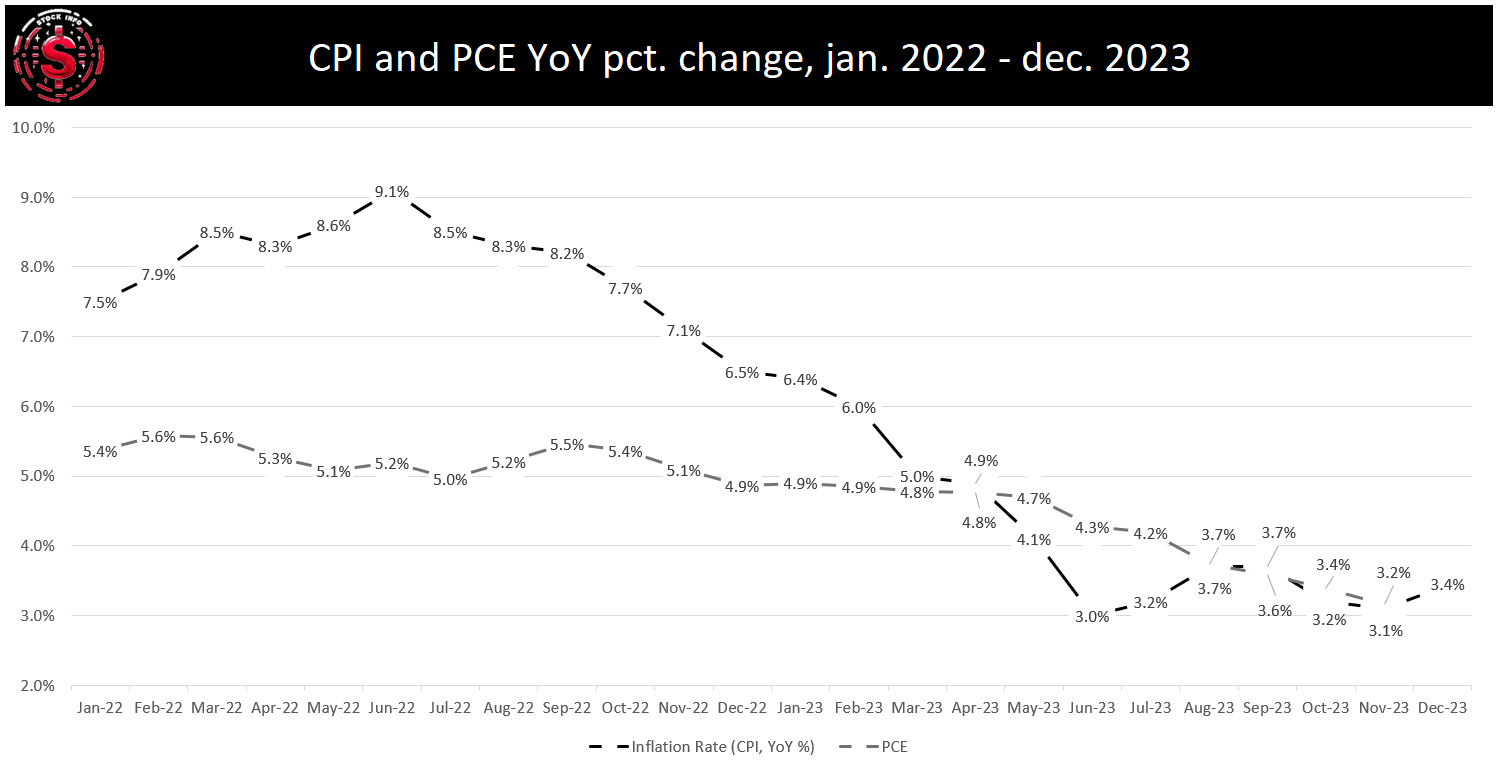
Unemployment Rate: It is no secret that the Fed closely monitors the labor market through the unemployment rate and the degree of how tight the labor market has been. The unemployment rate has been stronger than expected in November and December of 2023. This caused the market to re-evaluate the number of interest rate cuts in 2024.
It is important to remember that the Fed’s primary goal is to bring inflation back to their 2% target. While the labor market can greatly influence inflation, the Fed will be happy with a strong labor market if inflation comes down, supporting its “soft landing” narrative.
Based on the PCE readings, we have to say that inflation is coming down. If you are unfamiliar with the term, it refers to the strategic goal of cooling an overheated economy to tame high inflation without triggering a recession. It involves carefully adjusting interest rates to slow economic growth just enough to control inflation. The Fed is effectively trying to balance steady economic growth while avoiding the significant downturn that a more aggressive intervention might cause.
So what does all this mean regarding what we can expect from the Fed and how they’ll change the interest rate? Data show us that we should not expect rates to go any higher than they currently are. However, the question regarding how long rates will remain in the 5.25%-5.5% currently remains unanswered.
A helpful tool to gauge the market participants’ expectations for interest rate cuts is the CME Group’s FedWatch tool. As of writing, there is an expectation that the Fed will keep the interest rate at its current level at the next meeting in January and in March – although there is just over a 42% chance rates will be cut by 25 basis points.
Effectively, based on the probabilities provided by the CME Group, we will most likely see the first interest rate cut in May.
CMEgroup.com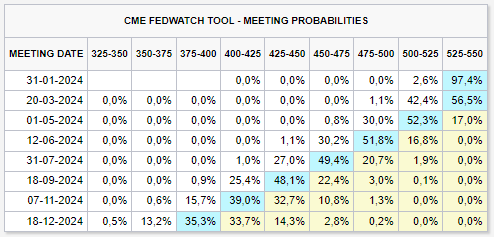
To summarize everything, the Fed’s role over the past 24 months has been challenging, navigating a landscape shaped by the pandemic, supply chain issues, and geopolitical tensions. The interplay of CPI, PCE, and unemployment data highlights the complexity of current economic conditions. While Inflation is coming down overall, the tight labor market makes it difficult for the Fed to justify any rate cuts at the next few meetings. It is important to remember that as we get some data in the coming weeks and months, the macroeconomic playing field and the Fed’s decisions can change dramatically.
The Dragon is Still Asleep
As we embark on 2024, China’s economy presents a landscape of unexpected twists and turns. Contrary to the long-anticipated recovery, we observe a continuation of the economic challenges that have persisted through most of 2023.
Throughout the previous year, China’s economy fluctuated between inflation and deflation. The year began with moderate inflation, but from July onwards, the nation experienced a deflationary phase characterized by negative inflation rates. This indicates declining prices for goods and services, likely stemming from reduced consumer demand, impactful policy decisions, and external economic pressures.
While deflation might seem beneficial to consumer purchasing power, it also carries the risk of a spending deterrent, as consumers may delay purchases in anticipation of further price drops. This could potentially lower business revenues and decelerate economic growth.
Stock info with tradingeconomics.com
In manufacturing, China’s 2023 Manufacturing Purchasing Managers’ Index (PMI) showcased an oscillation pattern. This means that the PMI hovered around the critical 50-point mark, indicating a tight balance between expansion and contraction in manufacturing activities. February, for example, saw a surge in production post-holiday, reflecting an expansion phase.
However, other months, like April and December, experienced contractions, pointing to challenges in demand, supply chains, and overall business conditions.
Stock info with tradingeconomics.com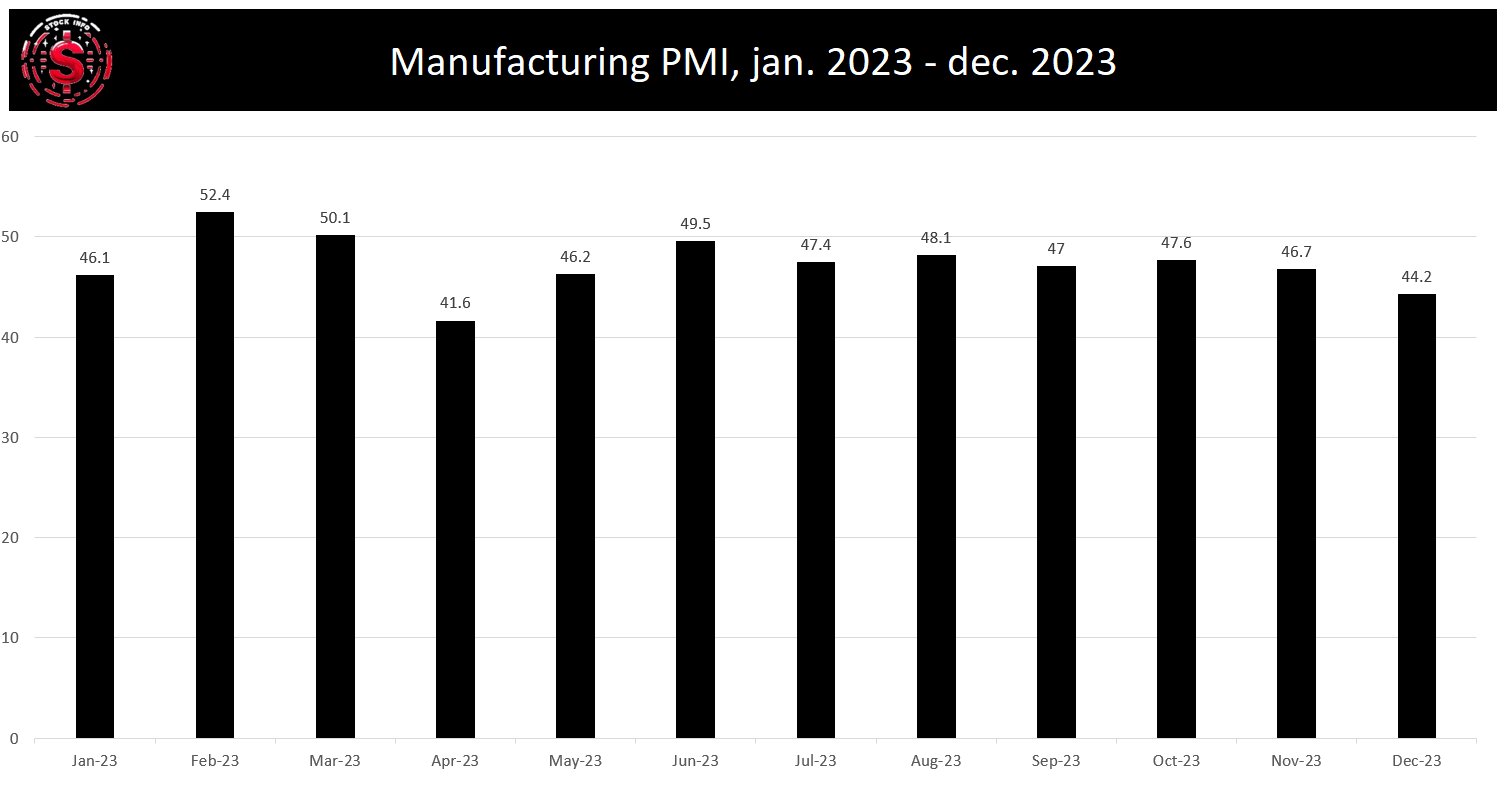
Impact on Policy and Future Outlook
These economic indicators are vital in shaping China’s monetary and fiscal policies. Facing deflation, the government may adopt measures to boost spending and investment.
Looking ahead to 2024 and 2025, the economic forecast for China is a mix of cautious optimism and significant challenges. Experts from institutions like J.P. Morgan Private Bank Asia (JPM) and Morgan Stanley (MS) underline the potential for risks and opportunities, focusing on the housing sector and local government financing. These elements are seen as pivotal for the country’s post-reopening economic trajectory.
China’s investment climate in the coming years is expected to be highly sector-specific. According to Chinadaily.com.cn, sectors receiving governmental support, such as consumer electronics, autos, batteries, renewables, and electric vehicles (EVs), are poised for robust performance. This focus aligns with the government’s push towards high-value manufacturing and green technology as part of its “Common Prosperity” initiative.
However, as NatWest Corporates and Institutions point out, the consumer sector may not significantly bolster the economy. Factors like declining property prices and slower growth in household disposable income could impede consumer spending. In addition, long-term growth prospects are tempered by an evolving economic model and demographic shifts, including an aging population.
Capital Economics highlights the importance of local insights in understanding China’s economic nuances. Their analysis suggests moderate growth but acknowledges the economic landscape’s complexity, influenced by domestic and global factors. For investors looking at China in 2024, there are two critical areas of focus:
Stimulus Considerations: The once-dynamic image of China as a rapidly growing market has been recalibrated amid geopolitical uncertainties. The economy’s sluggish rebound post-COVID-19 control relaxations in late 2022, coupled with real estate woes and export declines, marked 2023. Analysts from Citi emphasize the necessity for significant policy intervention to bolster recovery, projecting a GDP growth of around 4.6%.
Yet, there’s a lingering concern over market patience with ongoing reforms. A recent discussion on whether to inject a $278B rescue package into the stock market, which saw a positive response from the Hang Seng index, is a critical development to watch. Chinese investors will likely want
Opportunities Amidst Challenges: Beijing’s strategic pivot to reduce the property sector’s GDP contribution raises questions about new growth drivers. Sectors like machinery, electronics, and transport equipment are potential offsetters to the real estate slowdown. However, transitioning to these new economic drivers involves addressing the labor market and supply chain adjustments.
The tech and advanced manufacturing sectors, particularly high-end manufacturing, are identified as potential beneficiaries in the global tech cycle’s upturn. The Hang Seng Index has been on a multiyear downtrend, and as the Chinese economy hopefully begins to bounce back, we firmly expect the Hang Seng to do so as well.
Let us summarize: China’s economic outlook for 2024 and 2025 is moderate growth, marked by various challenges, including financial stability needs, geopolitical risks, and the impacts of evolving domestic policies and global market dynamics. While specific sectors and potential earnings growth offer optimism, the broader picture demands a cautious and well-informed approach from investors.
Bond market
Historically intertwined through investor expectations and economic trends, the bond and stock markets reflect a pattern akin to the 1980s and late 1990s as seen below.
Bloomberg.com
This connection is evident in the U.S. fixed income market’s recent trajectory, particularly after a historic selloff leading to a renewed optimism for bonds in the upcoming year, buoyed by the prospect of Federal Reserve rate cuts.
This scenario mirrors the 1980s when declining inflation propelled bond prices upwards. A trend echoed in the fourth-quarter rally of 2023 that pulled bonds back from what could have been an unprecedented third consecutive annual loss. Following a significant drop in Treasury yields, this rally showcases the cyclical nature of these markets, as further evidenced by the Bloomberg Barclays US Aggregate Bond Index’s shift from negative to positive returns.
Stock info with bogleheads.org
Current market dynamics, with investors holding their most substantial overweight position in bonds since 2009 as per the BofA Global Research survey, are similar to past trends where falling inflation and lower Treasury yields fostered a favorable bond market environment. µ
However, the journey to lower yields is expected to be turbulent, marked by concerns over whether the recent drop in Treasury yields fully accounts for anticipated rate cuts and the potential for market volatility if the Fed’s actions don’t align with expectations.
This sensitivity is mirrored in the performance of significant funds like the Vanguard Total Bond Market Index Fund (BND) and PIMCO’s Dynamic Income Fund (PDI), which have shown notable returns, indicating a resurgence of confidence in fixed income.
In addition, the yield curve has slowly been re-inverting, and once it does, it is usually a sign of trouble. It will not happen instantaneously, and it is often a leading indicator that a recession is near. However, we have seen points in time where the yield curve can re-invert, and the stock market will be just fine. Therefore, it is crucial to keep an eye on it. However, it should be used as an additional tool in your stock market analysis toolbox.
fred.stlouisfed.org
Additionally, the evolving yield curve which is slowly re-inverting, serves as a critical indicator. This indicator is often a leading indicator for economic downturns, yet only sometimes correlates with immediate stock market impacts.
A closer look at the bond yield curve since October reveals significant changes, particularly at the front and back end. Comparing January 23rd with October 18th, there’s a noteworthy decrease in the 1M – 5Y yields and an increase in the 30Y yields, suggesting that the market still anticipates near-term risks but is gradually shifting towards a more normalized yield curve.
US Treasury Yield Curve US Treasury Yield Curve

To summarize, the current state of the bond market, shaped by expectations of a murky and relatively uncertain outlook for the American economy, points towards potential Fed rate cuts, echoing historical patterns from the 1980s.
This scenario underscores the longstanding, intricate relationship between the bond market, economic fluctuations, and monetary policy, a nexus that plays a pivotal role in shaping financial market dynamics. With potential rate cuts comes the re-valuation of equities and tech stocks within the Nasdaq; hence, QQQ is especially sensitive to interest rate changes.
Commodities
Like bonds and stocks, commodities are a crucial part of the financial market, with their prices often reflecting broader economic sentiments and policies. Gold, copper, and oil each have unique roles and are influenced by different factors.
Gold: Gold, a traditional safe-haven asset, often sees its price rise during economic uncertainty or inflation, reflecting its role as a stable store of value. This trend is especially noticeable during the 2008 financial crisis and the COVID-19 pandemic, where gold prices surged amidst global economic turmoil.
As of early January 2024, gold stands at approximately $2,045.63/oz. Analysts forecast an average price of $1,986.50 for the year, with potential peaks possibly reaching up to $2,300 and even targeting $2,500, mainly if the Federal Reserve proceeds with rate cuts. Overall, gold ETFs saw a significant outflow in December 2023, which could suggest demand for gold, generally considered a haven, is faltering. This could mean institutions are starting to favor risk assets more than safe havens coming into 2024. For a more in-depth look at gold, we suggest taking a look at this article.
Copper: Copper, often considered a barometer for economic health, especially in industrial growth, sees its prices fluctuate with economic expectations. In times of anticipated economic expansion, copper prices usually increase due to expected rises in demand, whereas they tend to fall during economic slowdowns.
As of January 5, 2024, copper is priced at approximately $8,463/t. The average price forecast for copper in 2024 is around $8,800/t, buoyed by declining US dollar strength and supply constraints. With expectations being somewhat higher than the current prices suggest, it would seem like the market expects decent growth in global production through 2024. While this may not be directly correlated to the Nasdaq or QQQ, the overall bullish sentiment in copper is in general quite a good indicator of overall economic strength. To learn more about our Copper thesis, I suggest reading this article.
Oil: Oil prices are a significant indicator of global economic health, influenced by geopolitical events, supply and demand dynamics, and OPEC policies. In January 2024, Brent futures were trading at around $77/bbl, with WTI at about $72/bbl.
Top U.S. banks have set a median brent price forecast of $85 for 2024, with Goldman Sachs revising its forecast to $70-$90 per barrel and Citigroup predicting an average of $75. These predictions highlight the complexity and sensitivity of oil prices to global economic shifts and policy changes.
The commodities market for gold, copper, and oil is intricately linked to global economic trends. Understanding these commodities’ dynamics is crucial for investors and market analysts, offering insights into the broader economic landscape and future market directions. Overall, forecasts tell us that safe haven demand is decreasing, productivity is expected to expand, and oil is trading around the average forecast for 2024 at $75. Oil demand has been weak for much of 2023, which seems to be continuing into 2024.
Technical Analysis of the Market
Now that we have delved a little into the macroeconomic environment, we can look at where the market is on a technical level. First, we want to draw your attention to the $NASI index. We have a relatively detailed description of the mechanics and variables that go into $NASI here.
We want to point out that the $NASI has been falling for the past three weeks of trading, but the Nasdaq is up. This may seem counterintuitive, but the $NASI and the performance of the Nasdaq Composite Index moving in opposite directions can be significant signals in the market analysis. When the $NASI is declining while the Nasdaq is rising, it often indicates a divergence between the two. Essentially, it could mean the following:
Breadth Weakness: The McClellan Summation Index is a breadth indicator that measures the cumulative sum of the daily McClellan Oscillator readings. The Oscillator is a difference between the number of advancing and declining issues on the Nasdaq. A declining $NASI during a rising market suggests fewer stocks participate in the rally. This can indicate market weakness, as the rally is not broad-based and is likely driven by a few large stocks.
Potential Reversal Signal: Such a divergence can be a warning sign of a potential market top or reversal. When the broader market isn’t supporting the rise in the index, it suggests that the underlying market strength is not as robust as the index’s rise might indicate.
Sector Rotation: It may also indicate sector rotation, where money moves out of a broad range of stocks and into specific sectors or large-cap stocks, which significantly impact the index’s movement.
Risk Assessment: Investors and analysts often view this divergence as a cautionary signal, indicating the need for a closer market risk assessment. It suggests being vigilant about potential changes in market trends.
stockcharts.com
Next, we want to look at shorter-term momentum trends. For this, we look at the $NAMO. The $NAMO, or Nasdaq McClellan Oscillator, is a key market breadth indicator showing signs of a shift in market sentiment for the Nasdaq. $NAMO is an insightful tool in financial analysis, offering a deeper understanding of market trends by examining the balance between advancing and declining stocks. Here’s how it’s meticulously calculated:
Daily, take stock of Nasdaq’s performance by counting the stocks that ended higher (advancing issues) and those that closed lower (declining issues). This step lays the foundation for understanding the day’s market direction.
The core of the analysis lies in determining the net advances simply as the difference between advancing stocks and declining. This provides a snapshot of the market’s overall movement, whether tilting upwards or downwards.
The next phase involves computing two specific EMAs – the 19-day and the 39-day EMA – using the daily Net Advances data. While these timeframes are standard for the McClellan Oscillator, they can be modified for different analyses.
The $NAMO value is derived from $NAMO = 19-day EMA of Net Advances – 39-day EMA of Net Advances. This resultant figure oscillates around a zero line, providing crucial insights into the market’s momentum.
stockcharts.com
Looking at the graph above, which shows $NAMO after market close on January 19th, we see an exciting trend. First, $NAMO soared from a reading of -63 to -35 in days, one of the more aggressive changes we have seen in the past few months.
In addition, looking at the MACD on the bottom, the fast-moving average is on pace to cross the slow-moving average in an upward direction. Combined with the RSI bouncing off the 30-level on the same day the $NAMO had its lowest reading since August, this could show signs of potential for even more upward momentum.
Next, looking at just how many different stocks are advancing versus declining on the Nasdaq is often very useful. The advance/decline (AD) indicator is a useful tool that indicates how many stocks contribute to a decline or advance on the overall index. For the Nasdaq composite, we see a clear divergence between the AD-line in red and the Nasdaq composite in blue. This means that the rally we’ve seen at the beginning of 2023 can be attributed to relatively small stocks. In fact, during the speedy rally at the beginning of 2023, the number of declining stocks grew compared to those that advanced.
www.marketinout.com
The Nasdaq composite is thus being carried by some of the more prominent companies in the index rather than a collective and diverse set of stocks.
Next, we want to gauge market sentiment and breadth using CNN’s fear and greed index, the timeline of which can be seen below. The main takeaway is that the index rose fast after the November lows and is currently between greed and extreme greed. While this is not the end-all and be-all, looking at and getting some confluence and other indicators can be helpful.
It should also be noted that the fear and greed index usually spends a prolonged time in the extreme greed area during strong uptrends in the market, and it could suddenly be the case again here.
CNN
To end, we want to highlight the NAAIM number, which shows how active fund managers have changed their client’s accounts every two weeks. The last reading is from January 17th. Here, we see a sharp drop in the most recent reading, down towards the levels in May of 2023. Typically, when levels drop this sharply during an uptrend, it can mean there is room for further upward momentum going forward.
NAAIM.org
Now that we have been through all the technicals let us take a moment to catch the essence of what we are trying to convey. The market has been on a solid uptrend over the past few months, and while it currently looks stretched, there is still room to go higher.
The AD-line tells us that the uptrend can be attributed to a small number of stocks and that more stocks have been declining than advancing during the uptrend. What happens when these stocks start to catch up? In our opinion, we think it could push the QQQ near the 440 level.
In addition, the $NAMO shows there is a possibility of some upward momentum for the Nasdaq in the short term. Investors need to pay attention to indicators such as $NAMO and $NASI because they pack a lot of information into a helpful and concise indicator.
Conclusion
As we navigate through 2024, the global economic landscape is characterized by a tapestry of evolving challenges and emerging opportunities. The Federal Reserve’s strategic monetary policy management amid fluctuating inflation rates and China’s dynamic economic shifts are pivotal in shaping global economic trends. The bond and stock markets, reflecting these macroeconomic undercurrents, present a cautiously optimistic yet complex outlook.
Moreover, with its nuanced responses to global developments, the commodities market is a significant indicator of broader economic health. As these diverse elements intertwine, the overarching theme for 2024 emerges as one of cautious optimism, underscored by the need for vigilance and adaptability in investment and policy decisions. In this ever-changing economic environment, astute observation and strategic responsiveness will be key for navigating the potential headwinds and capitalizing on the opportunities ahead.

 Q2 2024 Earnings Call Transcript")

