Hiroshi Watanabe
SPDR S&P Global Dividend ETF (NYSEARCA:WDIV) celebrated its tenth year of existence last year. It is a passively managed ETF that seeks to track the S&P Global Dividend Aristocrats Index and provide investors with a high-yielding portfolio of global companies in an ETF wrapper. The primary criteria for inclusion in the Index is for companies to have stable or increasing dividends and have paid a dividend for at least 10 consecutive years. Due to these simplistic investment rules and valuation concerns, we would not put our money in WDIV at this time.
Equity and Country Selection
WDIV employs an indexing strategy with some management latitude; it is not a pure replication play. By using a sampling strategy, WDIV is not required to purchase the same companies as the Index. Instead, it can purchase a subset of equities in the Index or even securities not in the Index at all as long as the ETF managers believe the risk and return characteristics mimic that of the Index. WDIV does remain within the same industry concentrations as the S&P Global Dividend Aristocrats Index. There are caps put on the number of companies allowed per country (20) and the companies allowed per sector (35). Additionally, no single company can represent more than 3% of the ETF nor can a single country or sector have more than a 25% weight. It is reconstituted annually and rebalanced semi-annually.
The country weightings represented by WDIV are shown in the chart below. Note that the US, Canada, and Japan comprise 59% of the ETF, which closely follows the 56% concentration in the Index. There are significant geopolitical risks with this mix of country weightings. Canada’s largest trading partner is the US and it can be heavily affected by any downturn in the US economy. The Japanese economy growth has historically lagged behind other Asian and other major developed countries. Because of its heavy reliance on international trade agreements, Japanese economic growth has often been affected by tariffs, competition, and the economies of trading partners.
Country Exposure (SPDR S&P Global Dividend ETF Factsheet)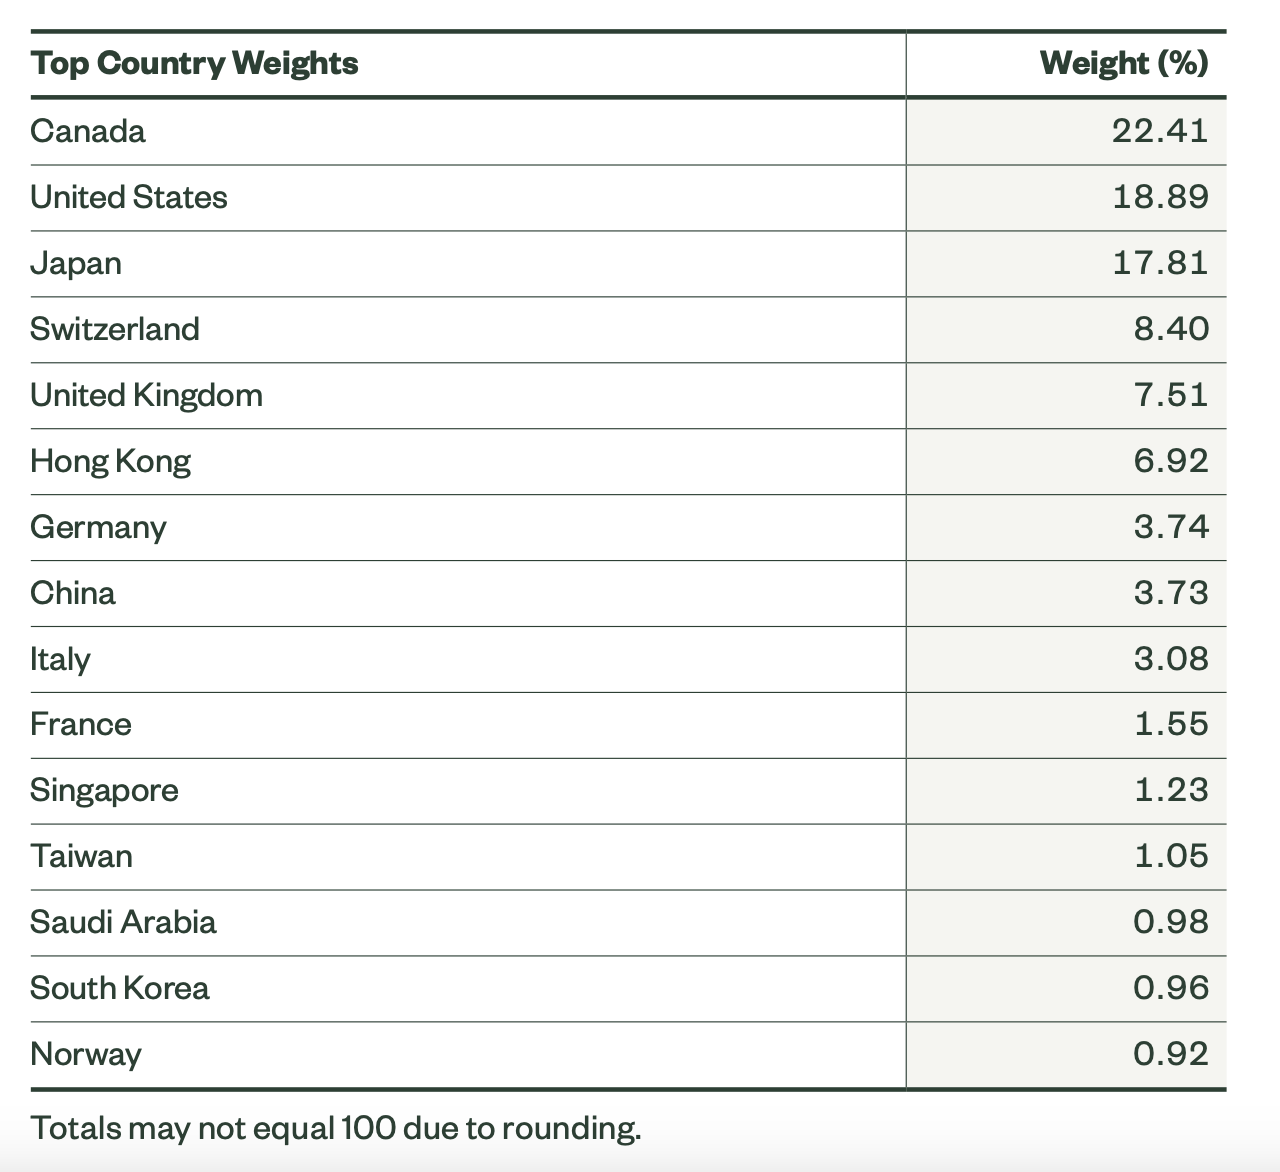
Performance
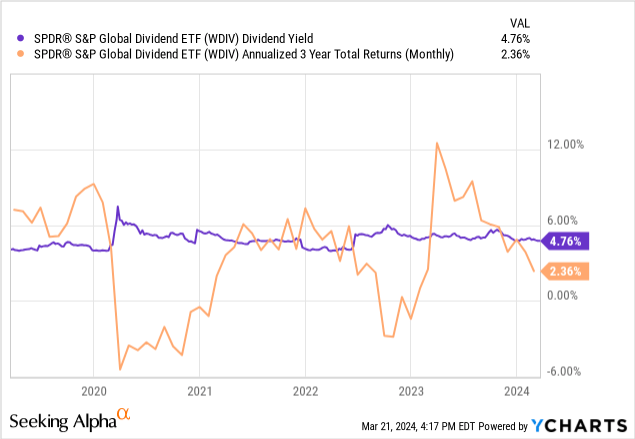
While past performance is not indicative of future performance, we point out the paucity of total returns WDIV has returned over its almost eleven years. With any dividend payer, we believe total return is the measure to be tracked as it is a sum of the dividend paid and price performance. Dividend yield has been at 4.8% but 3Yr annualized total returns have only been 2.4%. Sigh.
With a high annualized turnover ratio of 71% and total returns below the dividend yield, we believe WDIV is prone to being a value trap. WDIV uses no fundamental metrics to evaluate the quality of dividends and picks companies solely on dividend rates and past payments, hence the high reconstitution and turnover rate each year. Earnings, revenue and/or cash flow growth, combined with dividend payout ratio can help assess whether a company is paying a healthy dividend supported by its business operations. The alternatives are poor quality dividends with little to no price appreciation capability.
Competitors
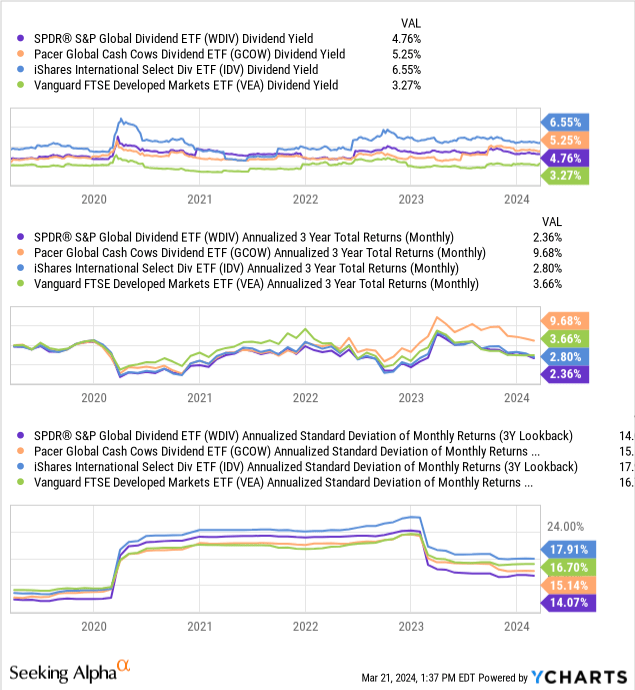
We view Pacer Global Cash Cow Dividend ETF (GCOW), iShares International Select Dividend ETF (IDV), and Vanguard FTSE Developed Markets ETF (VEA) as competitors to WDIV. Looking at both yield and total performance and acknowledging that past performance does not indicate future performance, GCOW has clearly provided the better investment opportunity between the four ETFs heretofore. However, we would not write home to Mom about any of these investments.
Looking further at more comparisons, WDIV has a very small amount of assets under management. This creates liquidity risk should a major drawdown occur. The other ETFs are of sufficient size that there is little concern. Looking at the market cap exposure, both WDIV and IDV are roughly equally weighted between large-caps and SMids (small and mid-cap stocks). There is less risk involved with larger cap exposure than the smaller equity brethren. Large-caps are generally older more mature businesses with more business lines, have seasoned management, and have better access to lower-cost financing.
| WDIV | GCOW | IDV | VEA | |
| AUM | $217M | $1.9B | $4.2B | $170B |
| Turnover Ratio | 71% | 47% | 29% | 4% |
| Large Cap Exposure | 49% | 95% | 56% | 77% |
| SMid Cap Exposure | 51% | 5% | 44% | 23% |
| Number of Holdings | 124 | 106 | 231 | 4048 |
*Data from SA and Analyst
Dividends
Seeking Alpha metrics on WDIV’s dividends is not pretty and supports our concerns with the ETF. While the dividend yield is high, dividend growth falters over all measured timeframes and has not had a single year of dividend growth over its ten years of existence. WDIV does not look like a Dividend Aristocrat to me.
Dividend Rating (Seeking Alpha)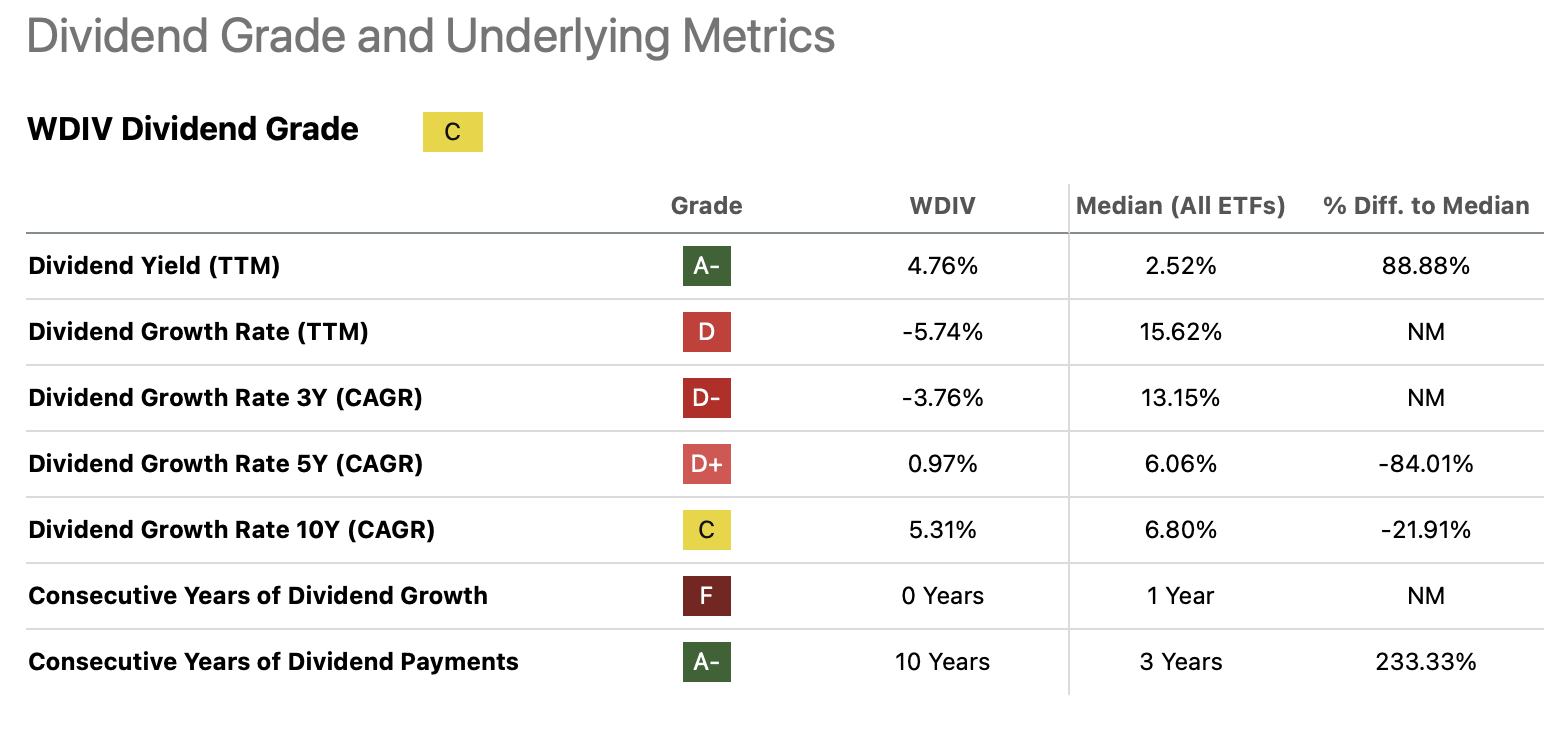
Sector Holdings
The top sector holdings representing over 10% of the ETF’s compositions are shown in the chart below. WDIV has significant exposure in the financial services, real estate and utility sectors which represent some of the poorest sector performers as shown in the second chart below. These sectors are still facing macro headwinds with current high interest rates and stubborn inflation worldwide and we do not see this changing anytime soon. As discussed previously, WDIV uses a simplistic backward looking selection process prone to the value or yield trap. GCOW, the better performer of these four ETFs, does not have a large exposure to financials, real estate, or utilities. As noted previously, we are not fans of any of these ETFs.
| Top Sector Holdings | WDIV | GCOW | IDV | VEA |
| Basic Materials | 11% | |||
| Communications Services | 11% | |||
| Consumer Defensive | 12% | |||
| Energy | 23% | |||
| Financial Services | 26% | 29% | 19% | |
| Healthcare | 16% | 11% | ||
| Industrials | 12% | 17% | ||
| Real Estate | 13% | |||
| Utilities | 17% | 15% | ||
| Technology | 12% |
*Data from Seeking Alpha
WDIV’s three primary sector selections remain in the bottom half of performance over the last number of years as shown in the chart below. While WDIV uses the GSIC sector classifications, it is very similar to the S&P 500 classification.
S&P Sector Performance (Novel Investor)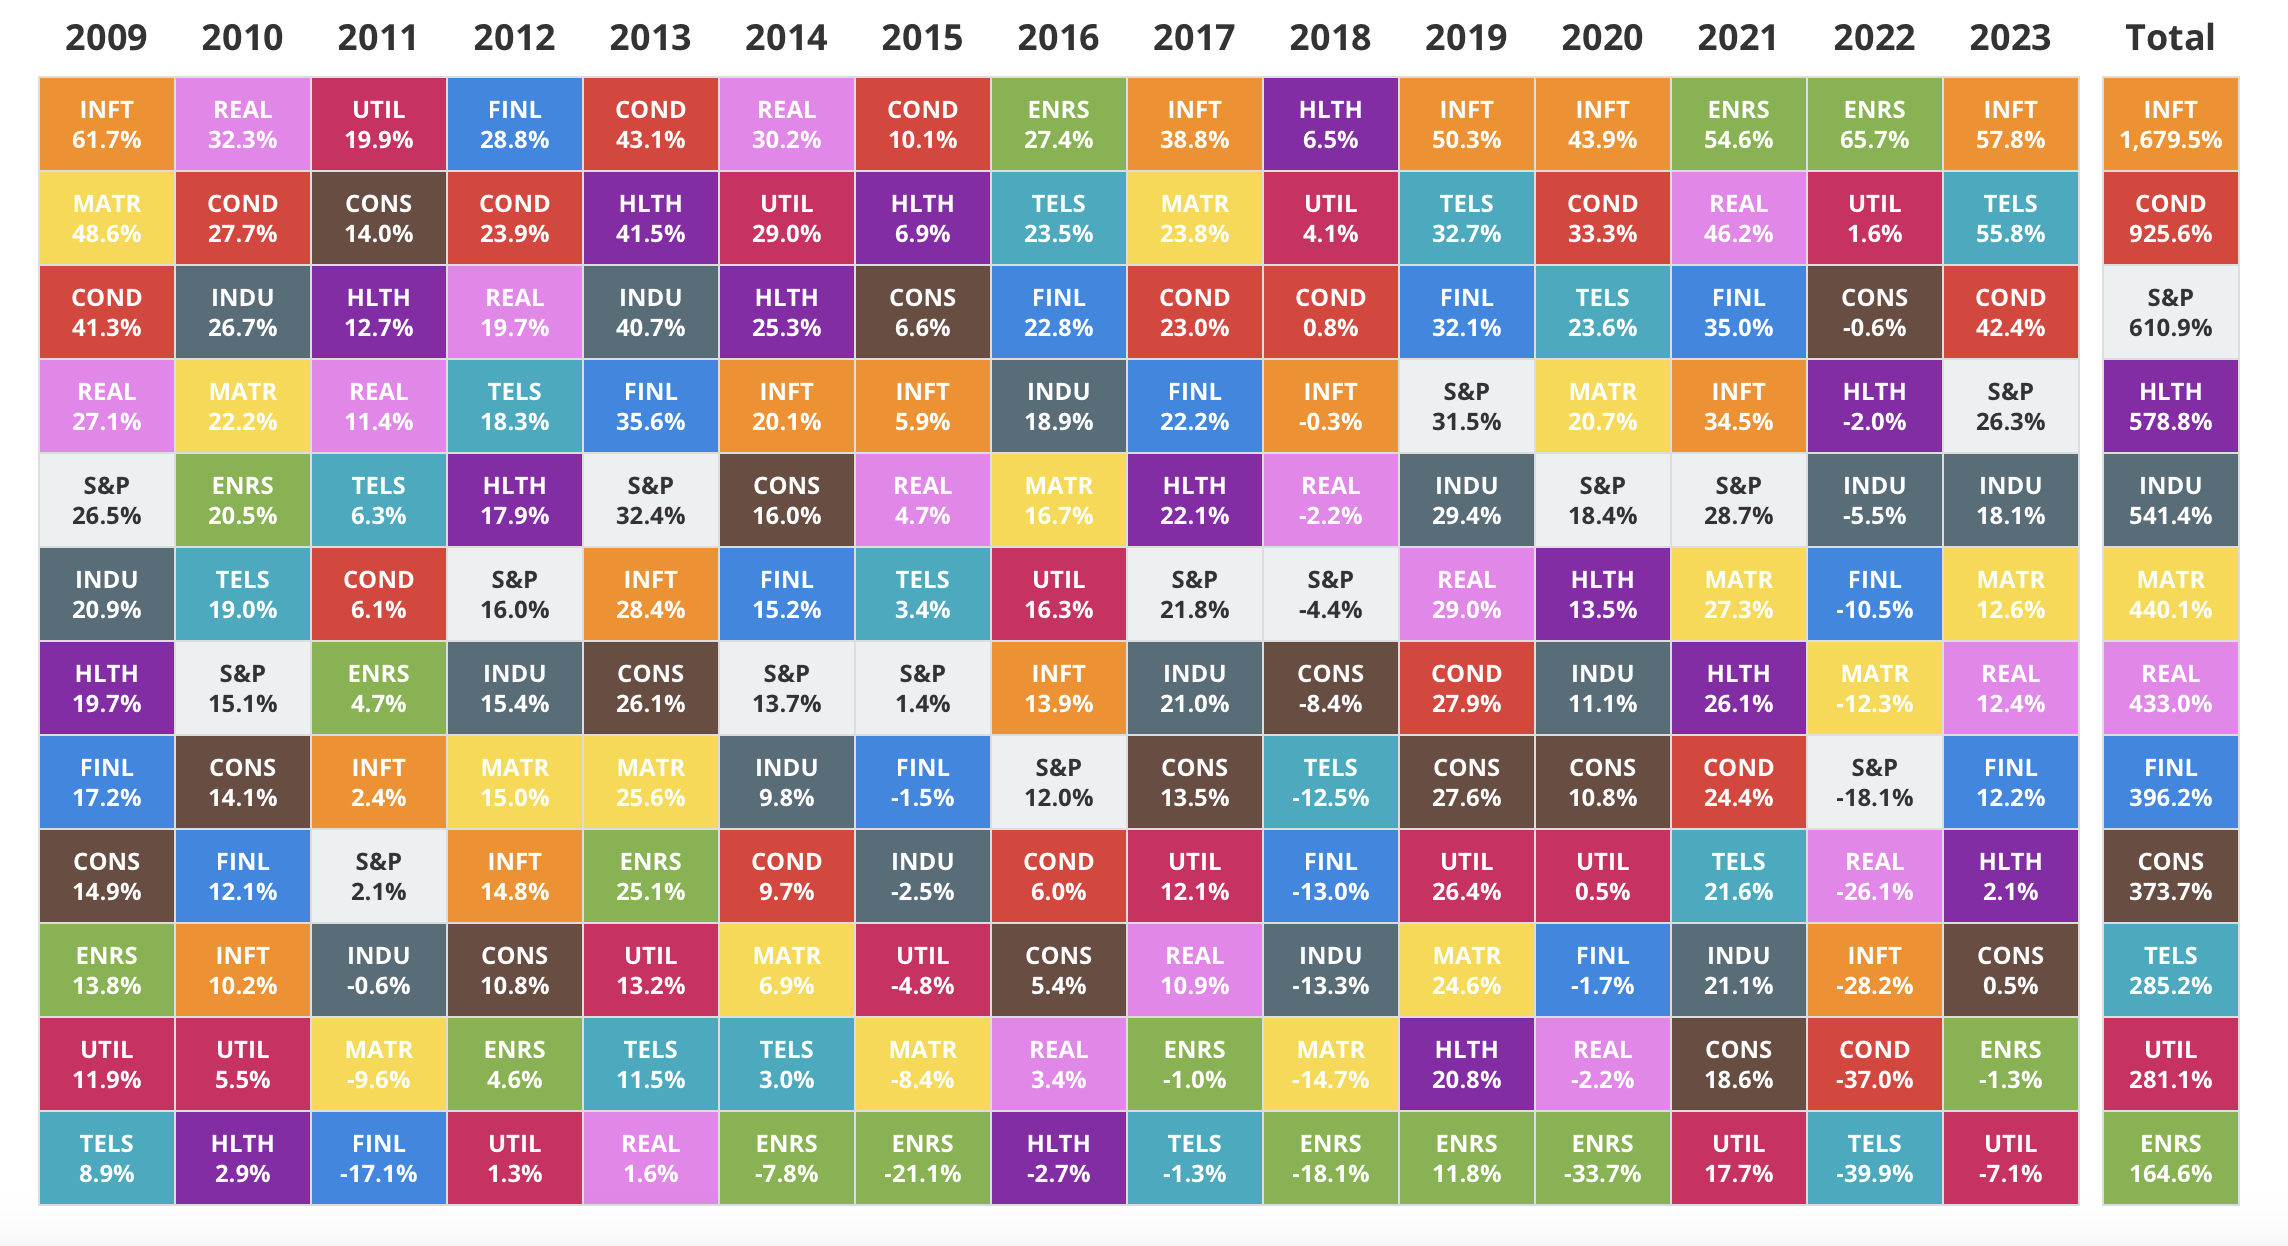
Valuation and Conclusion
Looking at a few fundamental metrics, WDIV does not present a compelling case for my portfolio. Its forecast revenue growth rate is 8% with a 2% forecasted earnings growth rate. I would prefer to see both higher revenue growth rate that is converted to a similar earnings growth rate as this implies the management teams of the various companies have the skills to convert revenue to earnings. Healthy earnings and revenue growth suggest the potential for price appreciation, which is absent here.
Additionally, WDIV is currently trading at a TTM 12.5 P/E. The forecast P/E is 11.9. This implies that WDIV is fully valued, if not slightly overvalued. In my experience as a value fundamental analyst, the forecast P/E needs to trade at a discount of at least 10% to its forecasted P/E, and often a deeper discount is required before I would invest. Should the near-term projected P/E forecast increase and WDIV become undervalued based on price and underlying fundamentals, I would consider changing my view of this ETF more favorably. For these valuation concerns, we rate WDIV a Hold at this time.

 Q2 2024 Earnings Call Transcript")

