Phynart Studio
Investment Thesis
Vanguard Industrials ETF (NYSEARCA:NYSEARCA:VIS) warrants a buy rating due to the fund’s low-cost ability to capture a highly diversified mix of holdings within the industrials sector. Industrial holdings are seeing major factors driving sector growth including robust new construction, record high defense spending, and infrastructure investment. Finally, while several of VIS’s holdings have been recently beaten down, they are also demonstrating resilience for a comeback.
Fund Overview and Compared ETFs
VIS is an ETF that is passively managed and seeks to track the MSCI U.S. Investable Market Industrials 25/50 Index. With its inception in 2004, the fund has 391 holdings and $5.3B in AUM. The fund includes a blend of large, mid, and small cap U.S. stocks. As expected, due to its market sector focus, VIS is predominantly heavy on industrials (84.85%), but also includes consumer discretionary (6.29%), utilities (3.80%), and other sectors.
For comparison purposes, other funds examined are iShares U.S. Industrials ETF (IYJ), Fidelity MSCI Industrials Index ETF (FIDU), and Invesco S&P 500 Equal Weight Industrials ETF (RSPN). IYJ is another passively managed fund and aims to include U.S. companies in its holdings that produce goods in construction and manufacturing. IYJ has the most distinctive differences with VIS in terms of holdings due to its heavy weight on capital goods (47.04%) and financial services (23.05%). FIDU is the most similar to VIS for holdings as it passively tracks the MSCI USA IMI Industrials Index. RSPN’s key difference from other peer funds is that is follows the S&P 500 Equal Weight Industrials Index. The fund therefore equally weighs stocks and rebalances quarterly.
Performance, Expense Ratio, and Dividend Yield
VIS has a 10-year compound annual growth rate, or CAGR, of 10.69%. By comparison, IYJ has a 10-year average annual return of 9.89%, FIDU has an average annual 10-year return of 10.18%, and RSPN has a 10-year average annual return of 12.18%. All funds except for RSPN have underperformed the S&P 500 Index over the past ten years, which has seen a 10-year total return of just over 174%.
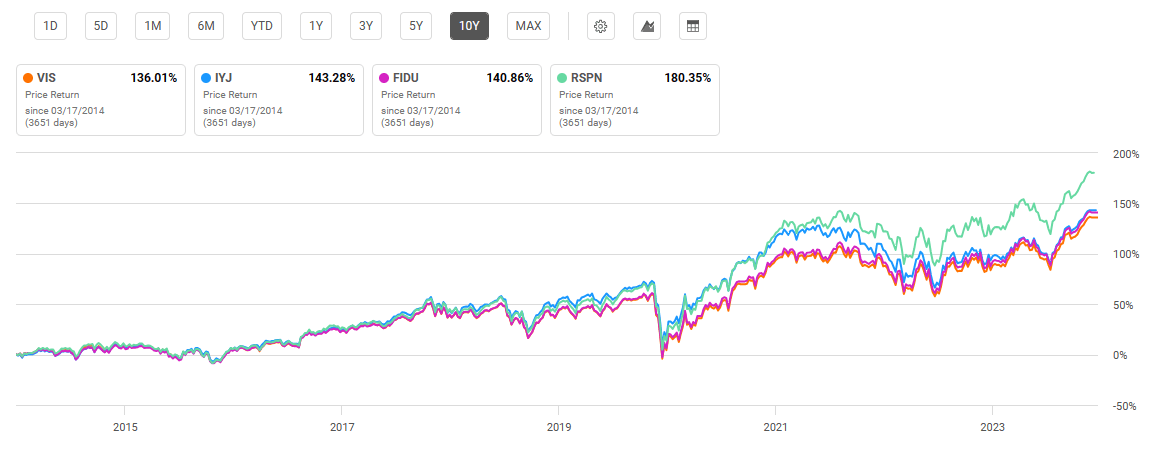
10-Year Total Price Return: VIS and Compared Industrial Exchange-Traded Funds (Seeking Alpha)
On par with most Vanguard ETFs, VIS has a relatively low expense ratio at 0.10%. While not quite as low as Vanguard’s S&P 500 Index ETF (VOO), for example, at 0.03%, this expense ratio is similar to other market sector funds from Vanguard. Additionally, 0.10% is on the lower end compared to peer industrial ETFs with only FIDU beating VIS at 0.08%. Additionally, VIS has a noteworthy dividend yield at 1.27% along with a 5-year dividend CAGR of 5.48%.
Expense Ratio, AUM, and Dividend Yield Comparison
|
VIS |
IYJ |
FIDU |
RSPN |
|
|
Expense Ratio |
0.10% |
0.40% |
0.08% |
0.40% |
|
AUM |
$5.31B |
$1.49B |
$1.00B |
$681.46M |
|
Dividend Yield TTM |
1.27% |
0.98% |
1.33% |
0.99% |
|
Dividend Growth 5 YR CAGR |
5.48% |
5.49% |
5.86% |
8.19% |
Source: Seeking Alpha, 15 Mar 24
VIS Holdings and Industrial Sector Growth Factors
VIS has the greatest diversification of compared industrial ETFs with 391 holdings. The fund has 27.22% weight on its top 10 holdings which is average compared to peers. IYJ is the most concentrated on its top 10 holdings with 34.81% weight and unsurprisingly RSPN, with its equal-weighted approach, has the lowest top 10 concentration at 14.85% weight.
Top 10 Holdings for VIS and Peer Industrial Exchange-Traded Funds
|
VIS – 391 holdings |
IYJ – 189 holdings |
FIDU – 388 holdings |
RSPN – 80 holdings |
|
GE – 3.45% |
V – 7.54% |
GE – 3.47% |
GE – 1.58% |
|
CAT – 3.44% |
MA – 6.57% |
CAT – 3.45% |
URI – 1.55% |
|
UNP – 3.13% |
ACN – 3.94% |
UNP – 3.17% |
BLDR – 1.51% |
|
UBER – 2.98% |
GE – 2.98% |
UBER – 2.93% |
AXON – 1.50% |
|
HON – 2.65% |
CAT – 2.88% |
HON – 2.69% |
CAT – 1.49% |
|
RTX – 2.61% |
UNP – 2.48% |
RTX – 2.68% |
HUBB – 1.49% |
|
BA – 2.37% |
RTX – 2.18% |
BA – 2.43% |
ETN – 1.48% |
|
ETN – 2.33% |
HON – 2.16% |
ETN – 2.35% |
UBER – 1.44% |
|
UPS – 2.17% |
AXP – 2.11% |
UPS – 2.19% |
FTV – 1.42% |
|
ADP – 2.09% |
ETN – 1.97% |
ADP – 2.13% |
HWM – 1.42% |
Source: Multiple, compiled by author on 15 Mar 24
Looking forward, the industrial sector has several factors that make VIS and other peer funds attractive. These include the forecast for new construction projects, strong government spending on both defense and infrastructure, and the rebound of two large holdings. Each of these distinct advantages are discussed further below.
New Construction Outlook: CAT and ETN
The first propellant for industrial-focused ETFs is the expected continuation of new construction within the U.S. In a consistent increase since 2021, the new construction industry within the U.S. is expected to see YoY growth of 7%, totaling $1.21T in value. The U.S. government is also fueling a strong outlook for construction as well. For example, the Infrastructure Investment and Jobs Act was signed in 2021 authorizing $550B in federal investment into infrastructure. According to the current administration, 1 in 5 miles of highways and 45,000 bridges across the U.S. need repair.
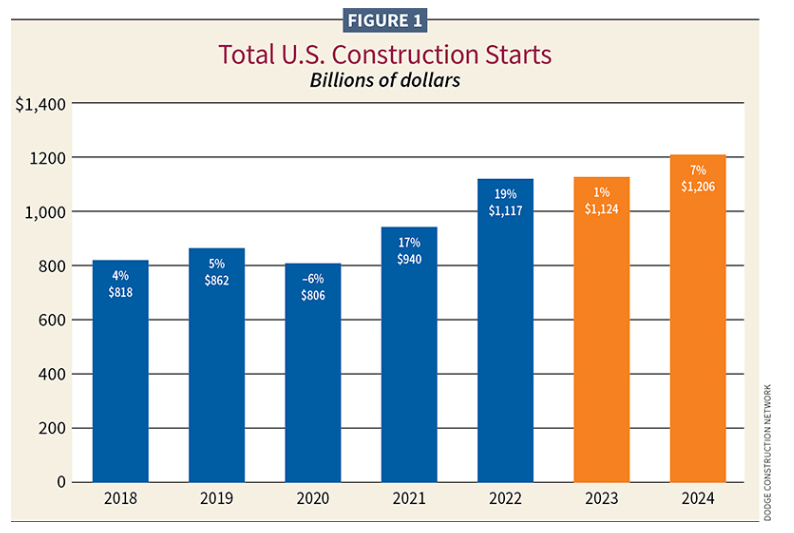
New Construction Starts, 2018-2024 (Dodge Construction Network, www.ecmag.com)
Capitalizing on this expenditure are VIS’s holdings such as Caterpillar Inc. (CAT) and Eaton Corporation (ETN). CAT, a construction equipment company, has seen strong growth including a 31.4% YoY EBITDA growth and solid profitability with a 15.41% net income margin. Additionally, the company is reasonably priced with a P/E ratio that is 30% below its sector median. Because electric distribution and integration is a critical part in all new construction, Eaton also stands to benefit. ETN has also seen impressive growth over the past year and boasts a 20.95% EBITDA margin. While future interest rates will play a major role in new construction looking forward, the trend so far this year has been encouraging.
Record Defense Spending: RTX, BA, HON, and GE
The second tailwind impacting VIS and peer industrial ETFs is record high defense spending. The fiscal year 2024 National Defense Authorization Act allots for over $800B in defense spending, also including the largest-ever investment into research and development. Defense contract companies including RTX Corporation (RTX), The Boeing Company (BA), Honeywell International, Inc. (HON), and General Electric Company (GE) are all poised to benefit from this spending. For example, General Electric was awarded a multi-million-dollar contract to increase production capacity for hypersonic flight composite materials. RTX also has benefited greatly with a $145 million contract for the PATRIOT missile defense system.
Recent Woes, But Rebounding: BA and UPS
While most of VIS’s top holdings have strong outlooks, two top companies that give pause for concern are BA and United Parcel Service, Inc. (UPS). Although Boeing has diversified business segments and will profit from high defense spending already covered above, its recent wave of commercial airliner troubles has given investors a headache. The Alaska Airlines panel blowout is well known and already concerning for Boeing. However, the aftermath of this incident and other mechanical issues is still unfolding. Recently, for example, the CEO of United Airlines asked Boeing to stop the manufacturing of 737 Max 10 airplanes for the airline due to certification concerns. While such incidents hurt the Boeing brand, the company’s strong business diversification and resiliency has caused the company to recover before. I believe the company will recover again.
Another recent laggard that I have faith will continue to rebound is UPS. In fall of last year, UPS cut its 2023 revenue forecast due to its fight with the International Brotherhood of Teamsters, which includes 340,000 employees. Indeed, UPS saw -9.35% YoY revenue growth and -2.67% YoY EBITDA growth from its union negotiations. However, roughly 6% of America’s gross domestic product travels through UPS’s trucks. Therefore, this is another example of a company with recent troubles that has a strong foundation to rebound.
Valuation and Risks to Investors
VIS has a current price of $235.49 at the time of writing this article. This price is near the top of its 52-week range of $179.27 to $238.69. VIS has also seen a one-year performance of 28.70%. This recent price return is slightly superior to all peer funds examined. However, VIS has still lagged the S&P 500 Index over the past year which has seen a one-year performance of just over 29%.
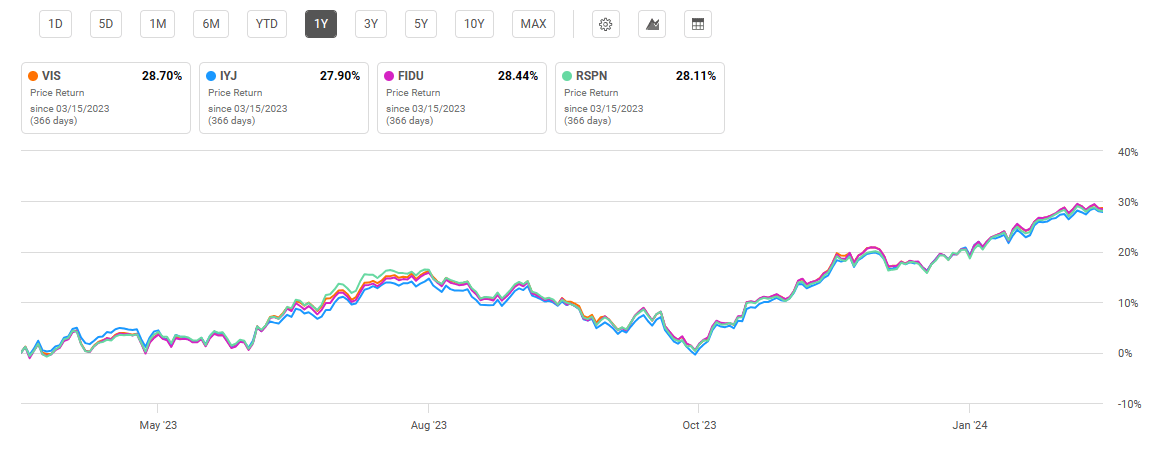
One-Year Performance: VIS and Peer Industrial ETFs (Seeking Alpha)
Currently, the industrial sector, as with most of the market, is not cheap. Utilizing price-to-earnings and price-to-book ratios for each of the industrial sector ETFs examined, we can get a sense of the overall valuation of each. VIS has a P/E ratio roughly on par with its peers at 28.91. This is approximately the same as the S&P 500 Index P/E ratio of over 27.7. Additionally, VIS’s P/B ratio is relatively similar to compared funds at 7.31. Therefore, while not a value buy, VIS will likely see returns at least on par with its historic performance given the growth factors previously discussed.
Valuation Metrics for VIS and Peer Competitors
|
VIS |
IYJ |
FIDU |
RSPN |
|
|
P/E ratio |
28.91 |
28.37 |
29.11 |
29.74 |
|
P/B ratio |
7.31 |
8.98 |
7.41 |
7.10 |
Source: Compiled by Author from Multiple Sources, 15 Mar 24
Despite its strong diversification, VIS does not come without risks to investors. Each industrial fund compared is sensitive to economic activity and growth. Therefore, in the event of economic recession, the industrial sector will be hit particularly hard. Additionally, looking at beta values as an implied metric for volatility, VIS sees a beta of 1.06 compared to the Dow Jones U.S. Total Stock Market Index. Therefore, one can expect volatility slightly greater than “the market” overall.
Concluding Summary
VIS is a low-cost ETF with high diversification in the industrial sector. There a several key main factors driving likely growth for industrials including strong new construction growth, solid defense and infrastructure spending, and the resiliency of several top holdings. While VIS demonstrates a valuation relatively close to the market overall, the industrial sector demonstrates several factors that makes the fund a buying opportunity looking forward.

 Q2 2024 Earnings Call Transcript")

