Thanakorn Lappattaranan/iStock via Getty Images
“Learn to deal with the valleys and the hills will take care of themselves.” – Count Basie
Despite all of the other headlines that surround investors they will be focused on earnings. The big banks have already started to report and some of the high-profile names visited the earnings confessional this week.
Institutional investors are relatively optimistic, that the economy will remain resilient, if not robust. The probability of a recession has eased considerably as economic growth remains more resilient than expected. In the latest Bank of America Fund Manager Survey as of December, 66% of respondents said that a “soft landing” is the most likely outcome for the global economy over the next 12 months. That is now the consensus view, something that seemed next to impossible just a year or two ago.
While consensus now expects a soft, non-recessionary landing in 2024, some economists continue to believe that a very “mild recession” is still on the table. They take the other side of the consensus that says rates are going to be cut dramatically. Instead, it’s still higher borrowing costs, rising credit card debt, and eventually a weaker job market that can damper consumer spending. This should drive the economy’s growth rate from a 2.3% pace in 2023 to a below-trend rate of ~1.0% in 2024. It should also lower inflation, eventually building a case for less restrictive Fed policy in the coming months. Yet when we consider no one, not even the Fed’s economic models forecasted the type of growth seen in the last two quarters, it makes any forecast unreliable.
Therein lies another conundrum. With the Fed Funds rate at 5.25%, GDP came in at 3.3% in Q4. With Atlanta GDPNow forecasting Q1 GDP at 3%, the argument can be made that current Fed policy isn’t restrictive at all. Those envisioning and/or making a case for rate cuts are asking for cuts to goose the economy in an election year. Perhaps they should step back review the economic backdrop and reflect on the possibility that rate cuts bring inflation back to life. One can only hope the Fed remains data-dependent and avoids the “political” games. If they follow that path the economy is telling us there is no need to cut rates anytime soon. That assumes the HOT GDP reports that have fooled the entire economic community aren’t loaded with anomalies. The latest reports say the economy is solid but economically sensitive companies like United Parcel (UPS), are reporting a cautious outlook for earnings and are poised to lay off 12,000 workers. It’s hard enough for an investor to navigate the stock market, it’s even harder when none of the data is aligned, and out of touch with historical precedents.
Despite (or perhaps because of) the consensus expectation for a “soft landing” helped along by Fed rate cuts, the vast majority of fund managers (62%) expect long-term yields to continue to fall. It is, therefore, little surprise that they are more bullish on bonds than they have been at any time since March 2009. Consequently, managers are also the most overweight bonds relative to commodities than they have been since…wait for it…March 2009.
The problem with that, though, is that the future seldom works out the way consensus expects it to. These types of positioning decisions are usually made by extrapolating the recent past into the future and once everyone is on the same side of the boat, I tend to walk to the other side. As an example, back in 2009, the majority was extremely overweight bonds relative to commodities, the iShares Core U.S. Aggregate Bond ETF (AGG) topped versus the iShares S&P GSCI Commodity-Indexed Trust (GSG) and did not make a new relatively high again until late 2014, more than five years later. This underperformance by bonds does not have to be repeated. But it does stand out to me that investors appear to simply assume that rates are going lower and bonds higher while few want anything to do with commodities. Many believe inflation is dead.
I rarely want to be on the same side as consensus for long. The average investor, by definition, sees only average returns. It’s very difficult to outperform, but settling for “average” is not my goal, however, which means I have to do something different if I want to have any chance of achieving above-average returns. This is why I was interested in the unloved Energy sector in early ’22 and had the good fortune to see a 57% rally in the sector before this recent consolidation phase.
Just about every “Outlook for ’23” had the same forecast. When money managers told everyone Bonds were the place to be, I took the “other side” of that argument and advised investors to remain COOL to that notion and limit exposure to what is a BEAR market trend. As measured by the Barclays Bond ETF (AGG), bonds gained 2% last year. The same thinking allowed me to look at commodities like Gold, Silver, and Uranium. I’ve covered them in my service updates for close to two years now, and the profits have been exceptional. Uranium ETF (URA) rose 52% last year and is up 11% in January far outpacing bonds and the indices. Now with the feeling that inflation is DEAD, many advisors claim the commodity complex will underperform. However, until we see a trend reversal I say we follow those BULL trends.
NEW ALL-TIME HIGHS
Now that the S&P 500, and the DJIA are at new all-time highs and the NASDAQ marching ever closer to doing the same, many questions have been answered. From a technical perspective that relieves a lot of the anxiety that had built up during the run to these levels. Strength begets Strength and there is little reason to “doubt” what the market is telling us. Whether it be a BULL or a BEAR, staying with the PRIMARY trend is the CORE principle of a successful strategy.
Navigating this market in the last year or so has been a lesson in understanding that the short term isn’t always aligned with the MACRO scene. There are many conflicting data points and issues present that question the price action. Consensus expects flat-to-slightly-negative earnings growth in the first quarter and for the S&P 500 to end the year around 5000-5100, only marginally higher than it is now. However, I plan to follow the same strategy deployed in Q4 ’23. Be selective in adding exposure to equities. That was well before new highs were established and the market was at a point where I felt the indices had limited upside. That has worked out well.
The reason; even if the broad market does not do much in the months ahead, that does not mean that individual stocks cannot still enjoy some nice moves, particularly in the first half of the year when expectations appear to be lower. I still have my concerns about where the market stands in the bigger picture and will continue to respect any breaking of notable support levels if and when they happen. But for now, the trend has been and indeed is my friend.
Q4 GDP surprised to the upside, and unless this economy falls off a cliff in Q1 or Q2 (Not likely) that is the scene investors should continue to navigate. The stock market’s price action is not forecasting any slowdown at least for the next 6 months or so. Other subtle signs suggest the economy can slip into a “Goldilocks” backdrop in the first quarter or two. So I’ll let the others debate the Fed’s rate-cutting policy and the recession argument.
As the opening quote states, the valley that was the “22 BEAR market was dealt with and now I’ll deploy a strategy to reap the rewards of a more positive setup until the “trend” changes.
The Week On Wall Street
Since bottoming out at extreme oversold levels back in October, the S&P 500 hasn’t skipped a beat, and since that low hasn’t seen a pullback of even 2% on a closing basis. The S&P 500 entered the trading day on a 3-week winning streak and has posted weekly gains in 12 of the last 13 weeks.
The modest losses on January 19th ended a streak of six straight daily gains of which five were record highs. The S&P picked up right where it left off with a broad rally on Monday making it six record highs in the last seven trading days. All of the indices posted gains and it was a “small cap” day as the Russell 2000 (IWM) rallied 1.3%. The DJIA also set another record high.
A quiet session ensued on Tuesday after the across-the-board rally. The market spent the day digesting recent gains and adopted a wait-and-see attitude with the FOMC and mega-cap earnings on the way. The S&P posted a modest 3-point loss, while the DJIA recorded another record-high.
A “Sell the News” event in Technology bled over to the general market and kicked off the worst day the markets have seen in four months. All of the indices lost more than 1% while technology stocks moved the NASDAQ Composite to a 2% loss.
Sentiment turned quickly. Large-cap tech earnings were celebrated with gusto. The peak-trough two-day 2% dip led to a Thursday-Friday rally that added 2.9% and another new high for the S&P 500. The DJIA added two more new highs to end the week making it nine record closes in ’24.
EMOTION feeds momentum and fading momentum has not been a good idea lately. It’s been a time to either “play” the momentum or watch.
THE FOMC Meeting
The FOMC left the rate band unchanged at 5.25% – 5.50%, which was never in doubt. And the policy statement was cautiously amended. The FOMC may be getting ready to lower rates, but it’s not there yet. And there is a lot of data to go. The key phrase on guidance now reads:
“In considering any adjustments to the target range.” Removed was the statement from December: “In determining the extent of any additional policy firming.” That takes out some of the hawkishness, but not all. Indeed, the Fed limited the dovishness of its stance. It left the door open for adjusting rates either down or up in coming meetings:
“The Committee does not expect it will be appropriate to reduce the target range until it has gained greater confidence.
When you’re diving down the highway at 90 MPH (raising rates at the fastest pace in history), it’s best not to shift into reverse (cut rates). Instead, it might be better to shift into “Neutral” and that is exactly where the Fed is now.
As of Wednesday afternoon Fed funds futures are still pricing in a 47% chance of a March rate cut. They see no issue with going 90 mph and shifting into reverse.
THE ECONOMY
The economists and the economic data continue to be WILDLY out of sync. Non-farm payrolls didn’t beat estimates of 180k they crushed them coming in at 353k. The last two reports were revised higher. A report that was filled with strength, and sends another arrow into the body of the folks calling for a rate cut. The unemployment rate was 3.7% for the third month in a row, and the labor force participation rate, at 62.5%, was unchanged in January,
Despite what the GDP reports tell us, and what the Fed stated this week, Fed funds futures are still pricing in a 20+% chance of a rate cut in March and a 97% chance of a cut in May. Unless GDP and now this job report are outliers, that is a pipe dream. It doesn’t matter if the 2% inflation target is achieved, this economy is too buoyant for rate cuts.
MANUFACTURING
Economists keep waiting for that elusive Bottom in Manufacturing.
Chicago PMI dipped 1.2 points to 46.0 in January, below forecast, after slumping 8.4 points to 47.2 in December. It is further unwinding the surprising 10.6-point pop to 55.6 in November. Before that surge, the index had been below 50 since September 2022.
Dallas Fed manufacturing index tumbled 17.0 points to -27.4 in January, much lower than projected, after bouncing 9.5 points to -10.4 in December.
Dallas Fed (www.tradingeconomics.com)
This is the lowest reading since May. Most of the components remained in contraction.
In case you hadn’t noticed, this month’s regional Fed manufacturing reports were a big disappointment not only on an absolute level but also relative to expectations. Not only were all five reports negative (indicating contraction) but they were also all weaker than expected.
Dallas Fed Manufacturing report. Huge miss.
KC Manufacturing. Miss
Richmond Fed Manufacturing. Miss
Philadelphia Fed Manufacturing. Miss
Empire Manufacturing. A Gigantic miss.
Going back to 2011, the collective magnitude of the misses of the five reports was the third largest on record trailing only the months of December 2018 and March 2020.
Then investors got a “surprise”;
The US Manufacturing Purchasing Managers’ Index posted 50.7 in January, up from 47.9 in December and slightly higher than the earlier released ‘flash’ estimate of 50.3. The latest upturn ended a two-month sequence of decline and signaled the strongest improvement in operating conditions since September 2022.
Construction spending jumped another 0.9% in December following the upwardly revised 0.9% increase in November and the 2.1% jump in October, making this a very strong report. Overall spending has been on the rise since January 2023.
The ISM manufacturing index jumped 2 points to 49.1 in January, another better-than-expected result, after edging up to 47.1 in December. This is the 15th straight month below 50, but is the highest since the 50.0 in October 2022.
CONSUMER
The consumer confidence index rose to a 2-year high of 114.8 in January from 108.0 leaving the index just above the prior 2-year high of 114.0 in July of 2023, but still below the cycle-high of 128.9 in June of 2021. Today’s consumer confidence rise joins a Michigan sentiment surge to a 30-month high of 78.8. Analysts saw an IBD/TIPP index bounce to a 9-month high of 44.7 in January from 40.0, versus a 12-year low of 36.3 in October.
Confidence has displayed a modest updraft since mid-2022, after a prior deterioration from mid-2021 peaks. The Conference Board measure has remained elevated, but Michigan sentiment and the IBD/TIPP are fluctuating around historically weak levels. All the surveys face headwinds from high mortgage rates, tight credit conditions, and recession fears and are nowhere near prepandemic levels.
Michigan consumer sentiment improved to 79.0 in the final print for January versus the 78.8 preliminary. This is the highest since July 2021, but well below pre-pandemic levels.
Michigan Sentiment (www.sca.isr.umich.edu/files/chicsr.pdf)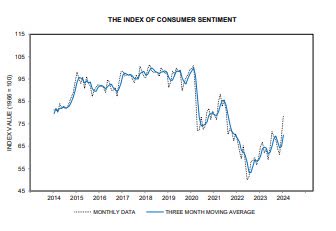
U.S. JOLTS: job openings increased by 101k to 9,026k in December after bouncing 73k to 8,925 in November. This is the best since September and reflects the resilience analysts have been seeing in the data. There are 1.4 job openings for every unemployed seeker. However, “quitters” dropped 132k to 3,392k after falling 104k to 3,524k. It is a fourth straight month of decline, suggesting some unease over the job market. The hire rate increased to 3.6% from 3.5%.
The Global Scene
In the Eurozone, we got first reads on Q4 growth from France, Austria, Spain, Italy, Germany, Portugal, and the Eurozone as a whole. Mexico also joined in the results parade.
In general, the results were stronger than expected. On an annualized basis, GDP surged 2.5% in Spain and 3.2% in Portugal (versus around 1% estimated), helping drive a 0.2% QoQ annualized change for the Eurozone.
EU GDP (www.bespokepremoum.com)
That helps the EU avoid a technical recession after Q3 growth was negative. The same can’t be said for Germany, where two straight GDP declines leave GDP lower today than it was in Q1 of 2022. Germany’s factory woes are an amazing contrast to the much more robust Spanish growth backdrop: GDP has risen almost 6% in total since Q1 2022, a staggering contrast with the declines for the “sick man of Europe”.
Global Manufacturing PMIs were released this week;
Emphasizing the sense of stabilization, the J.P. Morgan Global Manufacturing PMI posted 50.0 in January, a level consistent with no change in operating conditions over the month. This halted a 16-month sequence below the neutral 50.0 mark.
UK manufacturing contracts as Red Sea crisis hits supply chains and contributes to rising costs.
The UK Manufacturing Purchasing Managers’ Index posted 47.0 in January, up from 46.2 in December but below the earlier flash estimate of 47.3. The PMI has signaled a deterioration in operating conditions in each of the past 18 months. Four out of the five PMI sub-components – output, new orders, employment, and stocks of purchases – were showing trends consistent with overall contraction
The EUROZONE – remains in contraction
Eurozone Manufacturing PMI at 46.6 (Dec; 44.4). 10-month high.
Eurozone Manufacturing PMI Output Index at 46.6 (Dec: 44.4). 9-month high.
Contractions in output, new orders, and purchasing ease, but Red Sea disruption lengthens lead times.
CHINA
The Caixin China General Manufacturing PMI was 50.8 in January, unchanged from December. This marks the first time since May 2021 that the index has remained in the expansion zone for three straight months.
INDIA
The India Manufacturing Purchasing Managers’ Index recovered from an 18-month low of 54.9 in December to 56.5 in January. The latest reading highlighted the strongest improvement in the health of the sector since last September.
JAPAN
At 48.0 in January, the headline au Jibun Bank Japan Manufacturing Purchasing Managers’ Index rose fractionally from 47.9 in December to signal a further modest deterioration in the health of the sector.
POLITICAL SCENE
The House of Representatives overwhelmingly passed a tax package on a vote of 357-70 sending a strong message to the Senate for passage. Senate passage is not assured, but we give a greater than 50% probability of its passage. This vote pressures the Senate to potentially consider it under regular order, if necessary, in the coming days/week. Time is short, as the tax filing season has already started, and the Senate is set to go on recess at the end of next week. With pressure, we could see a push to prevent the Senate from leaving town until this is done. The strong bipartisan House vote and popular provisions may prove politically difficult to oppose when called up for a vote.
Overview of tax package provisions. A big plus- an important restoration of the 2017 tax cuts. The negative – more “giveaways” that enhance the “welfare” state and burden taxpayers.
- Child Tax Credit: $33.5 billion to expand the CTC through 2025, following its initial expansion (and subsequent phase-out) as part of the 2021 American Rescue Plan spending package. Expansions include a ramp-up in the portion of the credit that is refundable through 2025 (up to a maximum of $2,000, calculated by the number of children multiplied by 15% of the taxpayer’s income), the expansion to the per-child methodology to calculate the refundable portion, and the ability for taxpayers to choose between the preceding or current taxable year to determine eligibility.
With 1.4 jobs available for every unemployed individual one has to wonder why it’s deemed necessary to increase federal benefits.
- Corporate tax benefits: $32.8 billion to restore key business tax credits through 2025 that had ended at the end of 2022 as part of the 2017 Tax Cuts and Jobs Act. These include the restoration of full upfront domestic R&D expensing, restored interest deductions, and an extension of full bonus depreciation.
- Low-Income Housing Tax Credit: $6.3 billion to increase the Low-Income Housing Tax Credit.
- Disaster assistance: $4.9 billion in tax relief provisions for losses due to natural disasters.
- Taiwan tax breaks: Extension of tax treaty-esque treatment to Taiwanese firms and individuals with income from U.S. sources to address double taxation concerns.
.
GEOPOLITICS
Since the Hamas attack on Israel that opened the latest Middle East conflict back on October 7th, the prevailing model for the impact of the conflict on both global markets generally and crude or products specifically has been to assess the odds of a broader regional war. Attacks against shipping by Yemen’s Houthi separatist movement have had a larger global impact, mostly by forcing detours around the Red Sea and increasing both shipping time and costs. Those impacts are still marginal in terms of inflationary impact and supply chain performance, but given the Houthis receive significant support from Iran at some point that does raise risks of conflict escalation.
The same can be said for the deaths of three American soldiers at a base in Jordan last weekend at the hands of militias backed by Iran. The response from NATO and the US has been very muted. Also of note; The financial sanctions are still not being imposed.
Besides the sanctions, the US can strike directly at these militias, without escalating to a direct armed conflict with Iran’s armed forces. But even that sort of response does pose some risk for further escalation towards a broad war between Iran and some combination of the US, Israel, and others. However, what increases the risk of escalation exponentially is inaction.
The US under President Reagan took out half of Iran’s entire navy as payback for Iran setting mines in the Persian Gulf. Iran’s oil platforms were also targeted and destroyed. There was NO WAR after that as Iran backed down that summer. Allowing the terrorists to dictate policy on global shipping, as they act with impunity emboldens this enemy to take out more lives and threaten the global economy.
FOOD FOR THOUGHT
An anti-business backdrop has economic ramifications.
Two and a half years into Lina Khan’s tenure, the FTC has lost every single merger challenge it has brought through litigation across both federal and administrative court without even a single win in litigation in cases as varied as Microsoft’s acquisition of Activision Blizzard, Meta’s acquisition of Within, Illumina’s acquisition of Grail, etc. The FTC also filed an antitrust suit against Amazon last year.
The mere thought of Amazon cornering the robot vacuum market was just too much for the FTC to handle. Amazon terminated its offer to buy iRobot (IRBT) today as the FTC disclosed it had already decided it was going to reject the merger.
Now it’s on to the Artificial intelligence phenomenon. Lina Khan and the Federal Trade Commission announced it has issued subpoenas to five companies requiring them to provide information regarding recent investments and partnerships involving generative artificial intelligence companies and major cloud service providers. The compulsory orders were sent to Alphabet (GOOG, GOOGL), Amazon.com (AMZN), Anthropic PBC, Microsoft (MSFT), and OpenAI. FTC Chair Lina M. Khan;
“History shows that new technologies can create new markets and healthy competition. As companies race to develop and monetize AI, we must guard against tactics that foreclose this opportunity. Our study will shed light on whether investments and partnerships pursued by dominant companies risk distorting innovation and undermining fair competition.”
There are times when scrutiny is well advised but Khan’s zero-win track record cannot be defended. It is hurting companies, employees, and consumers. The sheer cost to defend what turns out to be irresponsible prosecution has a lasting effect.
Disable corporate America and you effectively disable the economy.
ENERGY POLICY
It’s no secret that the energy industry has been a target of the anti-business movement in the last 2+ years. The halt on LNG (Liquified Natural Gas) projects that was mentioned here a while back is now a reality. The Biden administration has halted permits on LNG projects under climate activism pressure.
I will note that this will not stop the construction of terminals that have already received export licenses. Seven LNG liquefaction terminals are currently operating, ten more have gotten an Energy Department export license, and four more are awaiting final approval.
However, this move is a symbolic win for environmentalists, while others see this as a threat to National Security. Then there is the EU, which “thought ” they had a deal with the US when the administration pledged additional LNG export to the region to limit dependence on Russian Fuel exports.
For whatever UNKNOWN reason climate fanatics see the US as a global polluter, all while US carbon emissions have come down substantially and the reason for that isn’t EVs or Solar panels and windmills. Ironically it’s because of NATURAL GAS. It happens to be one of the CLEANEST burning fuels on the planet.
US Carbon Emissions (www.statista.com/statistics/183943/us-carbon-dioxide-emissions-from-1999/)
The US LNG announcement gives a boost to Qatar, another major LNG exporter vying to supply Europe. Qatar has already signed up Italy and will become a viable alternative as the EU abandons the Russian supply. If they do, they reject one bad actor only to make a new deal with another. It’s no secret that Qatar harbors the leaders of the Houthi terrorist group that is now disrupting global shipping in the Red Sea. They also sided with Hamas and endorsed its takeover of Gaza in 2007. Qatar is hardly the innocent bystander that some believe.
This appears to be yet another self-inflicted wound that impacts the US energy industry and one that enhances funding for terrorist organizations around the globe.
The Daily chart of the S&P 500 (SPY)
A new high, a quick 2-day retracement, and off to the races with another record close to finish the week.
S&P 500 (www.tc2000.com)
If you are a BULL there is little to be concerned about in the DAILY chart of the S&P. Perhaps the only negative one can reach for is that we are setting up for a blowoff top. Those counting on overbought levels to take down the index have been wrong for 14 straight weeks. I continue to “warn” about guessing what will occur based on a “feeling”. The market is a prime example of how that could bring a lot of pain to an investor’s portfolio.
INVESTMENT BACKDROP
Time flies when you are having fun – January is in the books and if we measure performance by the large-cap indices it was a good start to the new year for the BULLS. Looking into the details, however, shows more of a mixed bag.
Except for the Russell 2000 and the Dow Transports, all other major indices added 1+ percent in the month. The action was more concentrated as the S&P equal weight index (RSP) lagged by 2.5%. The small caps disappointed losing 3.9%, but we can look to that as consolidation after a 13% Q4 rally where 11% of that came in December.
January Performance (www.seekingalpha.com/checkout?service_id=mp_1232)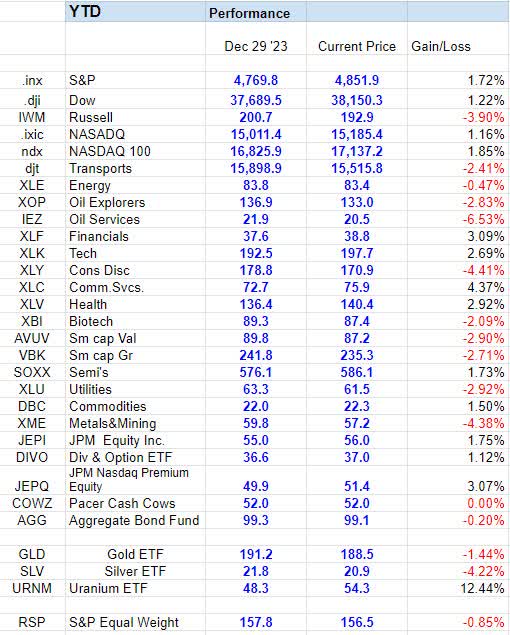
Communication Services and Financials finished one/two at the sector level, and Healthcare and Technology followed them. Unfortunately, they were the only sectors in the green.
Silver continued its sloppy action with a 4% loss, Gold was modestly lower, and just because the calendar has changed it hasn’t disrupted the uptrend in Uranium. The metal added 12% in January on top of its 52% gain in ’23.
At some point, we will get a healthy consolidation period in the MEGA -7. This should allow an opportunity for other areas of the market to briefly rotate into favor and for breadth to strengthen in the broad market. Cyclical sectors like financials, industrials, and energy have seen their trajectories improve enough to suggest they are rotating into favor near-term. This should help prevent a significant pullback as the megacaps digest their HUGE gains.
If that doesn’t occur it will be a cautionary signal.
FINAL THOUGHTS
When the S&P 500 struck a new all-time high on Friday, January 19th. It was the first time it had done so since January 4, 2022, more than two years ago. That is a long time between new highs, historically speaking. Bespoke Investment Group notes that, at 512 sessions, it was by far the longest gap without a new high since the Financial Crisis era and the seventh longest streak without a record in history. Once the Dow Jones Industrial Average and NASDAQ 100 recaptured their prior peaks over the past few weeks, it seemed only a matter of time before the S&P did the same.
New highs often lead to even higher prices and there are upside “targets” worth considering, but it’s important to remember that targets should be used for guidance only and are not guaranteed. Likewise, the move over the past few days has firmly taken the index up into the 4800-4900 “target” zone that I placed on the index back in November and therefore, feels like a culminating accomplishment in several ways.
However, I will be the first to admit that I was skeptical that a new high would be struck again even this soon after the rough year we experienced in 2022. The scene looked more like a ‘topping’ pattern that I often referred to the weekly chart updates to members of my service.
When I look at the entire picture that still could be the case. Many stocks do remain well below their former highs, including such popular measures as the NASDAQ Composite, Russell 2000, Value Line Geometric Index, or something like the ARK Innovation ETF (ARKK). The NASDAQ needs to rally ~6% before establishing a new all-time high, but the small caps (IWM) are still 20% below their previous high.
A raging BULL market or a very selective BULL market? It confirms the advice that has been part of the strategy. Selectivity is key. STAY with a plan that includes a bullish backdrop and one that works best for you.
THANKS to all of the readers that contribute to this forum to make these articles a better experience for everyone.
These FREE articles help support the SA platform. They provide information that speaks to Both the MACRO and the short-term situation. With a diverse audience, there is no way for any author to get specific unless they’re simply highlighting ONE stock, ETF, etc. Therefore, detailed analysis, advice, and recommendations are reserved for members of my service offering on the platform.
The information provided here is verified by SA and in most cases, links are provided as supporting documentation. If anyone can point out a comment in any article I put forth and demonstrate that it is factually INCORRECT – I will REMOVE it. –
Best of Luck to Everyone!

 Q2 2024 Earnings Call Transcript")

