pcess609
Investment Thesis
Vanguard’s Health Care ETF (NYSEARCA:VHT) warrants a hold rating due to its slight underperformance in comparison to peer healthcare funds. Additionally, because of its broad diversification, VHT has lower weight on top healthcare performers like Johnson & Johnson (JNJ) and UnitedHealth Group Inc. (UNH). Finally, VHT demonstrates the least desirable valuation metrics compared to other examined healthcare funds. Despite these drawbacks, VHT is worth holding due to its stable long-term performance and low expense ratio.
Fund Overview and Compared ETFs
VHT is an ETF that seeks to track the performance of the MSCI U.S. Investable Market Health Care 25/50 Index. With an inception in 2004, the fund has 421 holdings and $19.47B in AUM. Vanguard’s health care ETF has a mix of large, mid, and small cap U.S. stocks. For comparison purposes, other healthcare ETFs included are iShares U.S. Healthcare ETF (IYH), Fidelity MSCI Health Care Index ETF (FHLC), and Health Care Select SPDR Fund (XLV).
IYH generally seeks to track the performance of U.S. equities in the healthcare sector. FHLC tracks the MSCI USA IMI Health Care Index, which includes predominantly health care stocks within the U.S. equity market. XLV seeks to track the performance of the Health Care Select Sector Index. This fund therefore seeks a representation of the health care sector of the S&P 500 Index. Because VHT’s peer ETFs each have different objectives, they have slightly different holdings and performance history.
Performance, Expense Ratio, and Dividend Yield
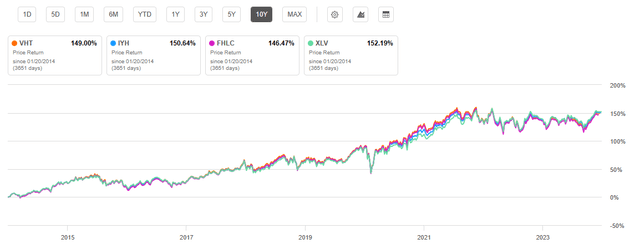
VHT has a 10-year compound annual growth rate, or CAGR, of 11.03%. By comparison, IYH has a 10-year CAGR of 10.88%, FHLC has a 10-year CAGR of 10.96%, and XLV has a 10-year CAGR of 11.20%. Each of these healthcare funds have underperformed the S&P 500 Index over the past five- and ten-year time periods. However, to compensate for this underperformance, the ETFs have lower volatility than “the market” overall, as I will discuss later.
VHT 10-Year Price Return Compared to Peer Competitors (Seeking Alpha)
As expected with an ETF from Vanguard, VHT has a low expense ratio at 0.10%. This is lower than each compared peer ETF other than FHLC. Income seekers will be somewhat disappointed with the dividend yields for the examined healthcare ETFs. VHT is roughly on par with its peers with a dividend yield of 1.34%. However, the fund’s dividend yield has been growing with a 5-year CAGR of 8.94%.
Expense Ratio, AUM, and Dividend Yield Comparison
|
VHT |
IYH |
FHLC |
XLV |
|
|
Expense Ratio |
0.10% |
0.40% |
0.08% |
0.10% |
|
AUM |
$19.47B |
$3.28B |
$3.10B |
$39.54B |
|
Dividend Yield TTM |
1.34% |
1.16% |
1.37% |
1.56% |
|
Dividend Growth 5-Year CAGR |
8.94% |
-0.87% |
9.70% |
9.75% |
Source: Seeking Alpha, 20 Jan 24
VHT Holdings and Key Differences
The quantity of holdings varies greatly between the funds examined from XLV’s 64 holdings to VHT’s 421 holdings. However, the top 10 weights for each ETF are very similar. The top two holdings for each examined fund are UNH and Eli Lilly and Co. (LLY). Below these top two holdings are JNJ and Merck & Co Inc. (MRK). Despite VHT having the greatest diversification, its weight on these top holdings is relatively similar to the other peer ETFs.
Top 10 Holdings for VHT and Peer Healthcare ETFs
|
VHT – 421 holdings |
IYH – 114 holdings |
FHLC – 371 holdings |
XLV – 64 holdings |
|
UNH – 8.43% |
LLY – 9.87% |
UNH – 8.40% |
LLY – 9.61% |
|
LLY – 8.13% |
UNH – 8.97% |
LLY – 8.10% |
UNH – 9.23% |
|
JNJ – 6.52% |
JNJ – 7.26% |
JNJ – 6.50% |
JNJ – 7.50% |
|
MRK – 4.78% |
MRK – 5.63% |
MRK – 4.76% |
MRK – 5.80% |
|
ABBV – 4.73% |
ABBV – 5.39% |
ABBV – 4.71% |
ABBV – 5.57% |
|
TMO – 3.54% |
TMO – 3.93% |
TMO – 3.53% |
TMO – 4.07% |
|
ABT – 3.30% |
ABT – 3.69% |
ABT – 3.29% |
ABT – 3.82% |
|
PFE – 2.81% |
AMGN – 3.04% |
PFE – 2.80% |
AMGN – 3.15% |
|
DHR – 2.80% |
PFE – 2.97% |
DHR – 2.79% |
PFE – 3.07% |
|
AMGN – 2.66% |
DHR – 2.78% |
AMGN – 2.65% |
DHR – 2.88% |
Source: Multiple, compiled by author on 20 Jan 24
All ETF investors know that a fund’s future performance is tied to the returns of its individual holdings. VHT is no different and represents both advantages and disadvantages compared to its peers. A key advantage for VHT is its lower exposure to LLY. However, its lower weight on UNH and JNJ puts the fund at a disadvantage. I will further explain each of these key differences below.
LLY – Strong Track Record but In Danger of Being Overvalued
Despite being a healthcare company with an impressive stock price return, VHT does well to have a lower weight on LLY compared to IYH and XLV. VHT is highly diversified and therefore has a slightly lower weight on LLY at 8.13%. Eli Lilly has seen strong growth due to the success of its diabetes and obesity drugs. This success has resulted in a 5-year total price return of a massive 436%. The company’s obesity drugs are estimated to drive upwards of $65 billion in sales. Furthermore, the company is very profitable at a 78.67% gross profit margin. However, LLY’s success appears to be already priced in with a 113.85 P/E GAAP. This puts LLY’s P/E at 257% above its sector’s median. Therefore, a slightly lower weight on LLY is arguably a benefit for VHT currently.
UNH – Solid Growth with Favorable Valuation
A negative point for VHT is its lower weight on UNH. UnitedHealth Group’s CEO recently stated that the company “enters 2024 well prepared to build on our efforts to improve patient care and consumer experiences”. The company’s historic metrics reaffirm this statement as UNH has seen a YoY revenue growth of 14.6% and an EBITDA growth of 17.82%. Furthermore, the company is valued currently with a P/E GAAP that is 33.8% below its sector median. Additionally, its price/sales ratio is 67% below its sector median. Therefore, VHT would be better postured if it held greater weight on UNH.
JNJ – Still Seeing Strong Profitability
A second downside for VHT is its lower weight on JNJ. Johnson & Johnson is a very profitable company with a gross profit margin of 67.56% and net income margin of 35.49%. In addition to strong profitability, JNJ is well known for its 61 years of dividend growth. Despite a dividend yield of almost 3%, the company has a dividend payout ratio at a sustainable level of 44.23%. Despite these strengths for JNJ, VHT has a lower weight on the holding at 6.52%, compared to IYH’s 7.26% and XLV’s 7.50%.
Valuation and Risks to Investors
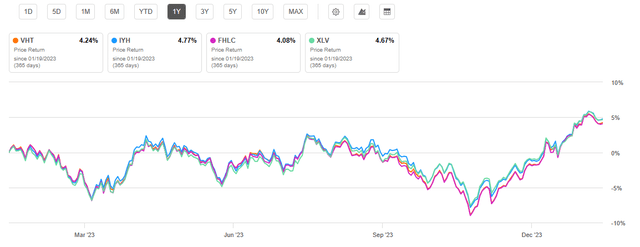
VHT is currently trading at $255.27 at the time of writing this article. This price is near the upper limit of the fund’s 52-week range of $222.27 and $259.57. It is also approximately 4% below its all-time high price of $266.42 seen back in December 2021. Similar to its long-term 10-year price return, VHT has seen a one-year return roughly on par with its peer healthcare funds. At 4.25%, VHT’s return is just below the average one-year price return of the other three funds.
One Year Price Return for VHT and Compared Healthcare ETFs (Seeking Alpha)
Despite a performance that is below its peer ETFs, VHT demonstrates indications of being overvalued. For example, VHT’s price-to-earnings ratio is 29.2, higher than all the other healthcare funds examined. While I anticipate VHT to see returns consistent with its long-term CAGR over the next year, it will likely continue to underperform its peers considering its current valuation.
Valuation Metrics for VHT and Peer Competitors
|
VHT |
IYH |
FHLC |
XLV |
|
|
P/E ratio |
29.2 |
24.19 |
27.15 |
20.78 |
|
P/B ratio |
4.4 |
4.76 |
4.09 |
4.66 |
Source: Compiled by Author from Multiple Sources, 20 Jan 24
One major advantage of all healthcare ETFs examined is their relatively low volatility. This volatility can be measured by examining the beta value of each fund. VHT has a beta value of 0.66 compared to the Dow Jones U.S. Total Stock Market Index. This value less than 1.0 indicates the fund experiences lower volatility than “the market” overall. By comparison, IYH has a 3-year beta of 0.66 and FHLC has a 3-year beta of 0.70.
Concluding Summary
Vanguard’s VHT ETF is a solid fund within a sector that has seen strong returns thanks partially to advances in diabetes and obesity pharmaceuticals. While I expect VHT to see solid long-term returns at a low expense ratio, it is ultimately mediocre in comparison to other peer healthcare ETFs examined. This is predominantly due to its holdings including a lower weight on UNH and JNJ and a heavier weight on LLY. Additionally, VHT has the greatest P/E ratio compared to peer healthcare ETFs indicating a valuation that is less desirable. While VHT has several drawbacks, it remains an attractive choice for investors looking for strong long-term returns at a volatility typically lower than the market overall.


