Mananya Kaewthawee
In my April 2, 2024, Seeking Alpha article entitled “Moving Out Of QQQ And Into SMH As Magnificent 7 Shrinks,” I pointed out that investors looking for an alternative investment to Invesco QQQ Trust ETF (QQQ) can consider VanEck Semiconductor ETF (SMH), which continues to grow strongly in 2024.
SMH is one of 443 ETFs hold Nvidia Corporation (NVDA) stock, according to ETF.com. With a 20.54% allocation weight, which is one of the highest ETFs, it is also one of the highest-performing semiconductor ETFs. Its share price growth of 78.28% for the past 1-year period, yet it pales in comparison to NVDA, which has grown 266.16%.
This difference raises two questions, which is the topic of this article:
- Is there a better performing semiconductor ETF with a high allocation weight of NVDA than SMH?
- Why not invest in NVDA directly, rather than any ETF with a high NVDA allocation weight?
In this article, I compare SMH with Proshares Ultra Semiconductor ETF (NYSEARCA:USD), detailing the pros and cons of each. I then compare both ETFs with NVDA.
Investment Alternatives
VanEck SMH
Table 1 shows the Top 10 VanEck SMH holdings. Its top two holdings are Nvidia (20.54%) and Taiwan Semiconductor aka TSMC (TSM) (11.86%). Importantly, all companies in the Top 10 are associated with artificial intelligence (“AI”) either as a supplier of the chips (Nvidia, AMD (AMD), Broadcom (AVGO), Intel (INTC), Qualcomm (QCOM), Texas Instruments (TXN)); maker of the chips (TSMC, Broadcom, Intel), or equipment suppliers to make the chips (ASML (ASML), Applied Materials (AMAT), Lam Research (LRCX)).
VanEck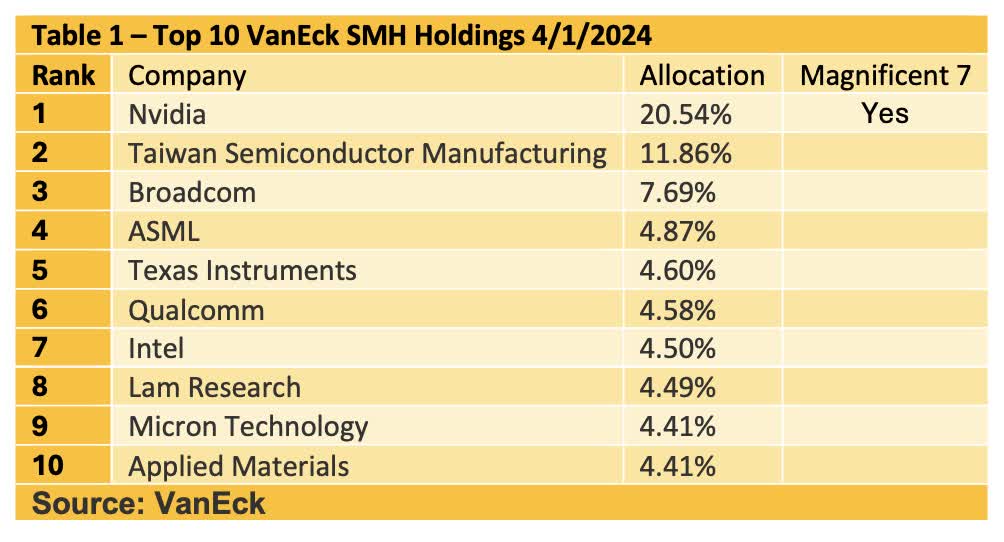
Alternative #1 – ProShares USD
SMH is a Sector Equity Technology fund, while the ProShares ETF, USD, is an Alternative Leveraged Equities fund. The main difference lies in their investment approach:
- VanEck SMH offers a direct investment in the semiconductor industry, while
- ProShares USD seeks to provide daily investment results, before fees and expenses, that correspond to twice (2x) the daily performance of the Dow Jones U.S. Semiconductors Index. Due to its leveraged nature, the USD ETF is more volatile and is designed for short-term trading with the goal of amplifying the returns of the semiconductor index. This higher risk and reward profile makes it more suitable for experienced investors who can actively manage their investments and are comfortable with the possibility of significant losses.
As a comparison of these two funds, SMH has an expense ratio of 0.35% while USD has an expense ratio of 0.95%. SMH is a large fund with 17.58 billion in assets under management, or AUM. USD, on the other hand, is a medium fund with 806.73 million in assets under management.
VanEck, ProShares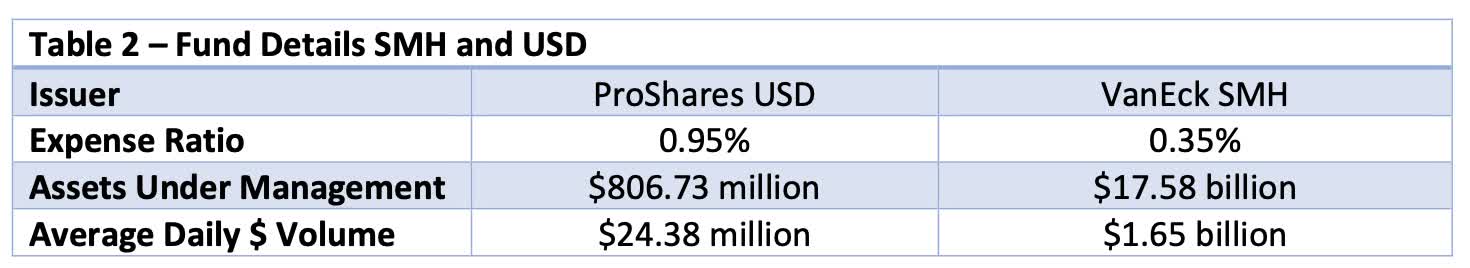
Table 3 shows the Top 20 ProShares USD holdings. Its top two semiconductor holdings are Nvidia (32.54%) and Broadcom (8.81%). In addition, its semiconductor holdings mirror those of SMH, as described above. Thus, USD is another ETF with a large percentage of its holdings in AI companies like SMH, but with more risk but also more reward.
ProShares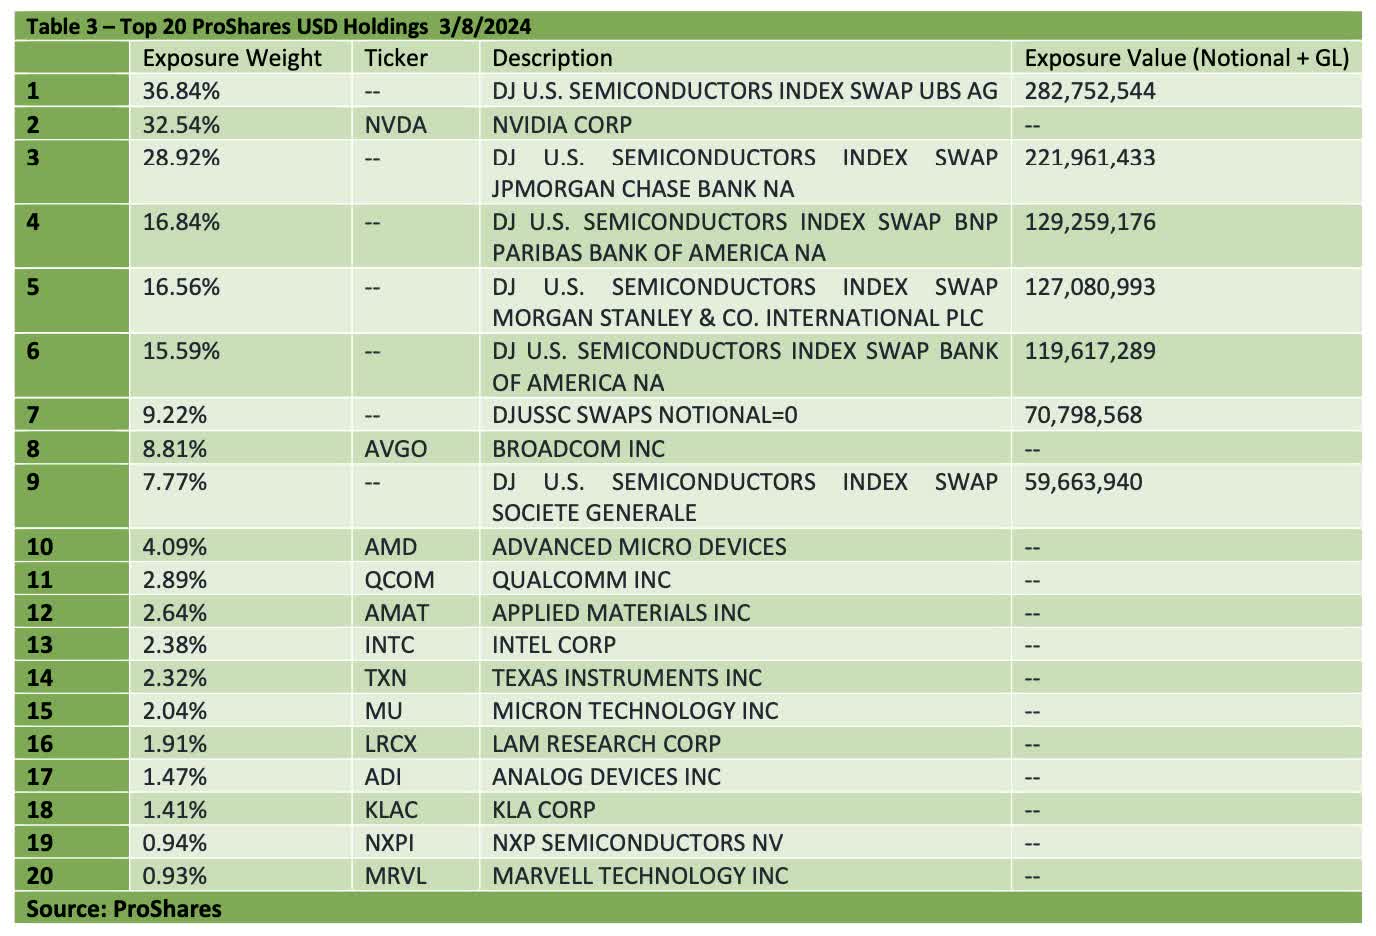
The top allocation of 36.84% is the DJ U.S. Semiconductors Index Swap UBS AG, which refers to a financial derivative contract, specifically a swap, that is linked to the performance of the Dow Jones U.S. Semiconductors Index. This index tracks the performance of the semiconductor sector within the United States, representing companies that are major players in the manufacturing, design, and distribution of semiconductors.
In a swap agreement, two parties exchange financial instruments or cash flows based on a specified benchmark – in this case, the Dow Jones U.S. Semiconductors Index. The specifics of a swap can vary, but typically, one party agrees to pay a fixed or variable interest rate in return for receiving the performance returns of the underlying index from the other party. UBS AG, a global financial services company, would be the counterparty or one of the parties involved in this swap transaction.
These instruments are complex and involve various risks, including counterparty risk (the risk that the other party may fail to meet its obligations) and market risk. They are typically used by investors with a thorough understanding of both the instruments themselves and the underlying market sector.
Share Price Metrics: SMH vs. USD
Chart 1 shows the performance of USD as compared to SMH between January 1, 2022, and April 11, 2024.
We see that USD Price % Change underperformed SMH throughout 2022 and 2023, but broke out in early 2024, growing 2X that of SMH.
YCharts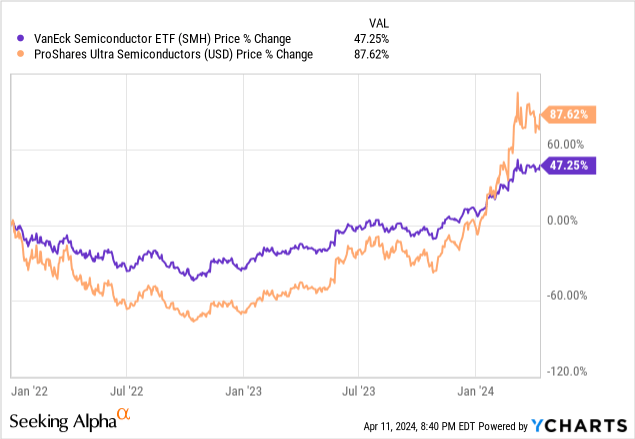
Chart 1
A clearer picture is evident in Chart 2 for the 1-year period, where USD grew 260.90% and SMH grew 77.46%.
YCharts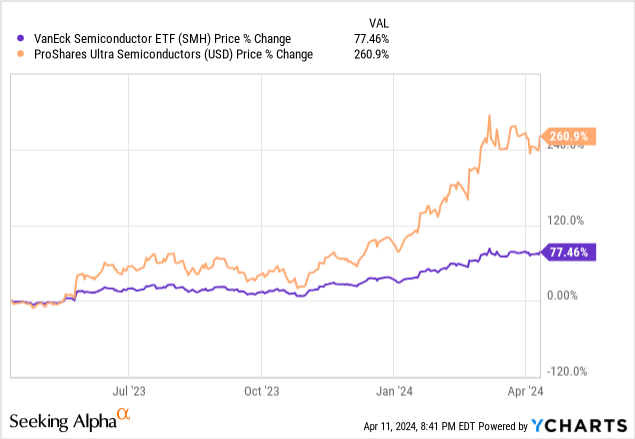
Chart 2
Chart 3 shows that both SMH and USD are above the 200-Day Moving Average since Q1 2023.
YCharts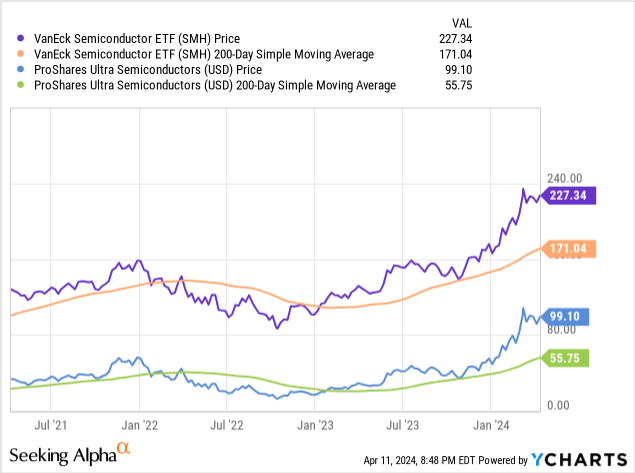
Chart 3
SMH
The VanEck Semiconductor ETF stands out in the investment landscape, boasting a stellar performance with a more than 74% increase over the past year, significantly outpacing the S&P 500’s (SP500) 27% gain. This surge reflects the high demand in the AI and semiconductor sectors, propelled by advancements in technologies requiring substantial computing power.
With a low net expense ratio of 0.35%, SMH offers investors an affordable entry into the burgeoning AI and semiconductor markets. It includes key players like Nvidia, Broadcom, and Intel, spotlighting the fund’s strategic positioning in AI-related stocks. Nvidia’s GPUs, essential for AI applications like OpenAI’s ChatGPT, underscore the fund’s investment in groundbreaking technology.
Additionally, the ETF’s notable investment in Taiwan Semiconductor Manufacturing, representing 9.69% of the fund, emphasizes its stake in a critical supplier for a wide range of tech applications. The annual distributions and a 12-month yield of 0.51% further enhance the ETF’s appeal, providing a cost-effective way for investors to tap into the dynamic growth of the semiconductor industry.
USD
ProShares Ultra Semiconductors ETF is trading at 99.01 as of the 11th of April 2024. The ETF is designed to achieve specific “daily goals,” aiming to deliver twice the daily performance of its semiconductor equity index. Over a 1-year period, USD has successfully met these objectives, as shown above in Chart 2. Remarkably, over a 10-year span, USD has realized a growth of 3,624.86%, outpacing many traditional, non-derivative ETFs due to its reliance on index swaps and derivatives. This strategic positioning has allowed USD to not only surpass the double in total price return compared to non-derivative ETFs, but also to quadruple the growth rate of the VanEck Semiconductor ETF, which has experienced a 906.17% growth over the same decade.
However, potential investors should weigh the higher risk associated with ProShares Ultra Semiconductors ETF, alongside its higher expense ratio of 0.95%, compared to more conventional non-derivative semiconductor ETFs like SMH, which has a lower expense ratio of 0.35%.
Semiconductor growth in 2024 is expected to be 13% according to the SIA. But artificial intelligence and generative AI like ChatGPT are expected to grow stronger, according to The Information Network’s report titled “Hot ICs: A Market Analysis of Artificial Intelligence (AI), 5G, Automotive, and Memory Chips.”
Alternative #2 – Nvidia Stock
Above I showed that Nvidia was the driving stock for SMH and USD, and both ETFs held a high allocation. That raises the questions whether investors should just buy the stock directly rather than as part of an ETF.
In Chart 4, I add NVDA to the previous 1-year performance in Chart 2 above. Here we see that Nvidia’s share performance 233.5% is ahead of SMH at 78.40%, but behind USD growing 266.5%.
YCharts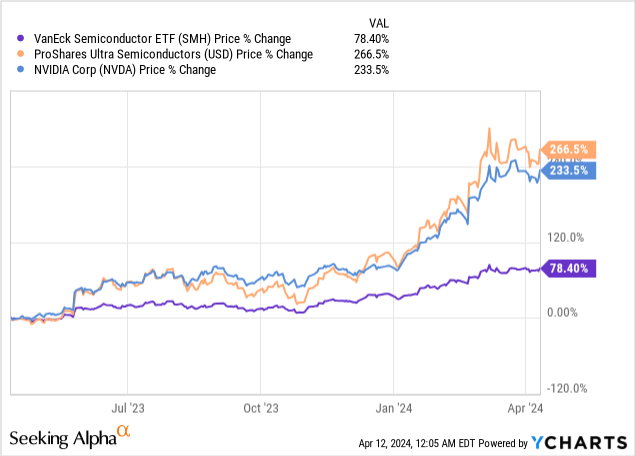
Chart 4
Investor Takeaway
The choice of individual stocks versus ETF is left to the individual investor, and no two investors have the same strategy, particularly when it comes to risk. By picking individual stocks, investors have the opportunity to outperform the market if they select high-performing companies. This is appealing for those willing to do the research and take higher risks for potentially greater rewards.
In the past 1-month period, SMH has underperformed USD and NVDA, but clearly has a lower volatility, as shown in Chart 5. But according to VettaFi, “USD can be a powerful tool for sophisticated investors, but should be avoided by those with a low-risk tolerance or a buy-and-hold strategy.”
YCharts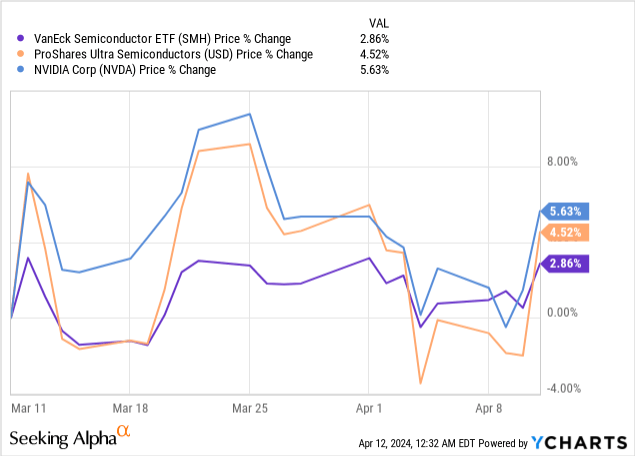
Chart 5
Investing in individual stocks allows investors to build a customized portfolio based on their analysis, preferences, and predictions about future trends. They can decide when to buy or sell, offering more direct control over their investment choices.
According to Microaxis, Nvidia has a volatility of 3.18 and is 5.21 times more volatile than the NYSE Composite. 28 percent of all equities and portfolios are less risky than Nvidia.
For example, Nvidia entered correction territory on Tuesday, April 9 as the stock fell 10% from all-time highs, due to the introduction of Intel’s new AI chip called Gaudi 3, that competes with Nvidia’s most advanced chips.
ETFs provide instant diversification across a wide array of stocks, sectors, or even asset classes, reducing the risk of significant losses that can occur from the underperformance of a single stock. However, in this analysis SMH and USD both have a high allocation of NVDA, and if it wasn’t for this high percentage, share performance of both ETFs would be lower.
While buying multiple stocks to achieve diversification can be costly due to transaction fees, ETFs offer a more cost-effective way to achieve a diversified portfolio with a single transaction.

 Q2 2024 Earnings Call Transcript")

