Wicki58/iStock via Getty Images
Introduction
UMH Properties (UMH) focuses on owning and operating manufactured home communities. As of the end of last year, UMH owned and operated 135 manufactured home communities with a total of almost 26,000 developed homesites in several US states.
UMH Investor Relations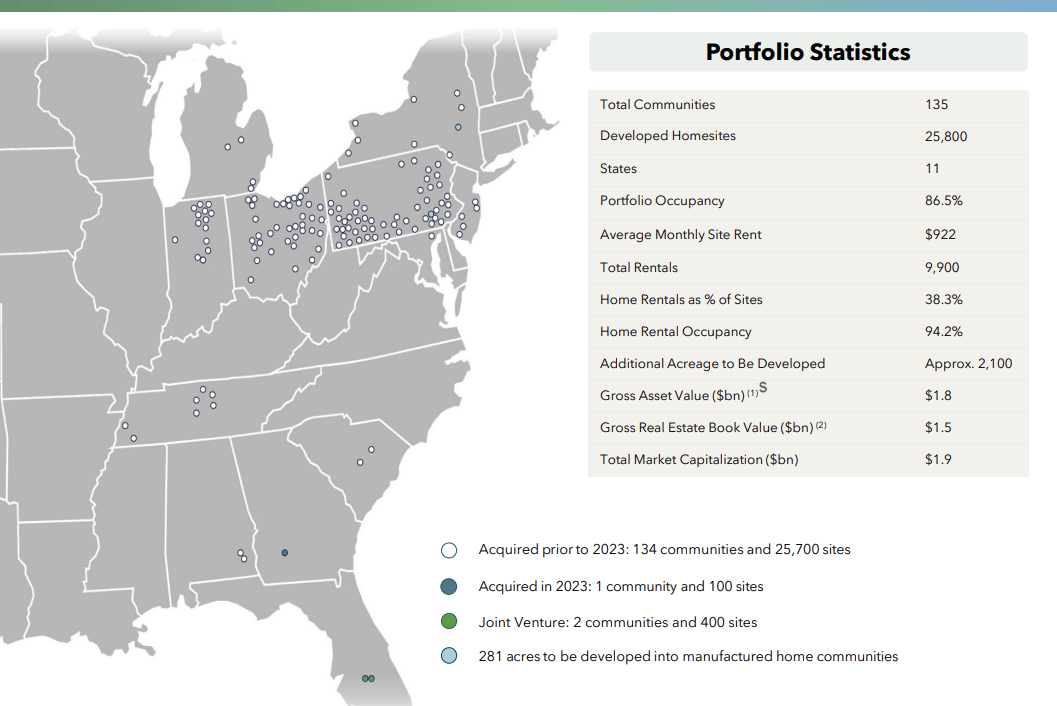
In a previous article, which was published in January 2023, I focused on the REIT’s preferred shares, which are trading with (UMH.PR.D) as primary ticker symbol as I like the risk/reward of that type of security better.
2023 was a good year for UMH
In my previous article I predominantly focused on the REIT’s preferred shares, and those securities are the focus of this article as well. This means I will be zooming in on both the preferred dividend coverage ratio as well as the asset coverage ratio.
Looking at the Q4 2023 and FY 2023 results, we see UMH Properties made excellent progress in the same property category. As you can see below the NOI on a same-property basis increased by almost 19% in the final quarter of 2023 while there was a 12.5% increase noticeable in the entire financial year. It’s worth emphasizing the annualized NOI result from the fourth quarter indicates the Net Operating Income on a same property basis would likely already come in between $115M and $120M.
UMH Investor Relations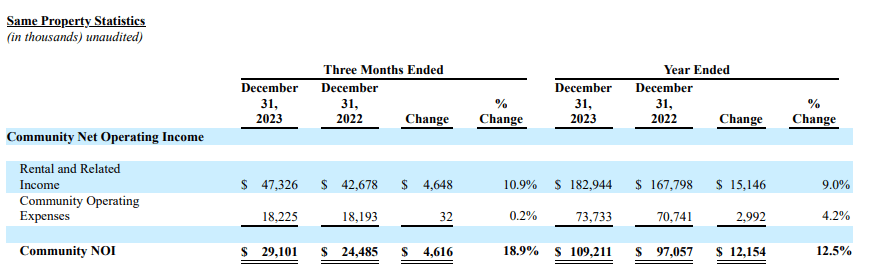
That’s based on the 126 assets it owned during 2022 and 2023. As mentioned in the introduction, the REIT currently owns 135 sites. The total community NOI was slightly lower at $108.4M due to some elevated expenses.
UMH Investor Relations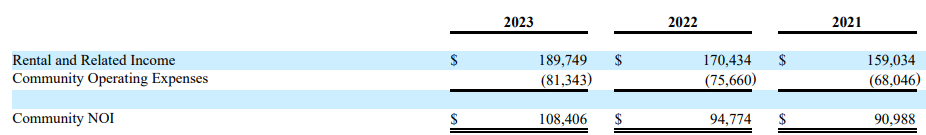
When looking at a REIT, not the income statement but the FFO calculation is what matters most. As you can see below, the total FFO attributable to the common shareholders of UMH Properties almost doubled to $51M, but that isn’t a fair representation of the underlying performance. The normalized FFO is a better metric as it excludes the negative impact of $12.9 related to the redemption of preferred securities in 2022. The normalized FFO was $54.5M in FY 2023 which is a pretty impressive result compared to the $46.8M in 2022 and $41.1M in 2021.
UMH Investor Relations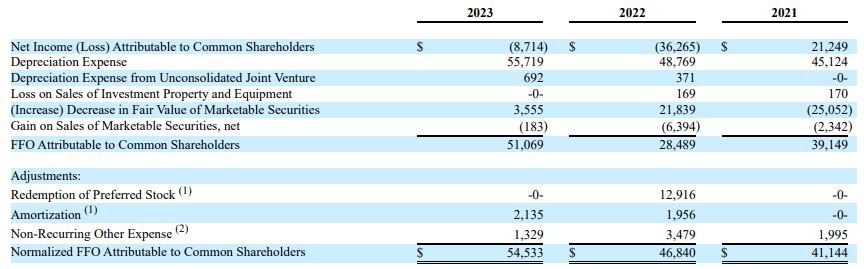
As the starting point to calculate the FFO and Normalized FFO is the net income, it is important to understand the preferred dividends are already included in this calculation. As you can see below, UMH Properties paid $16.7M in preferred dividends during 2023 which means the normalized FFO before taking the preferred dividends into consideration was approximately $71M.
UMH Investor Relations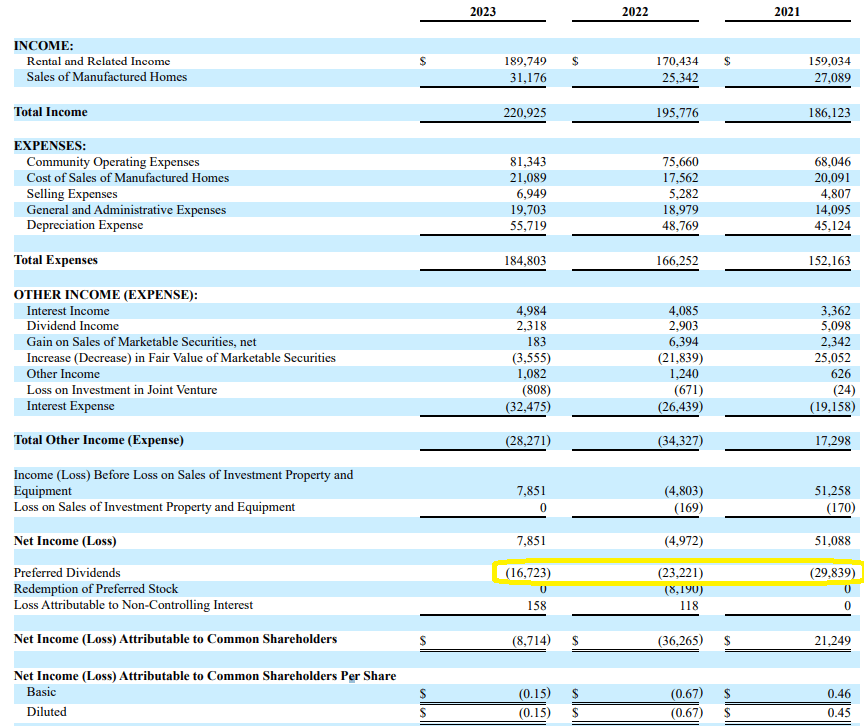
This also means the REIT only needed just under 24% of its underlying FFO to cover the preferred dividends. I generally prefer to see a lower ratio, but as the preferred equity is backed by real estate assets I am okay with a relatively high payout ratio. That being said, it is important to realize the REIT ended the year with 11.6M preferred shares outstanding and the $290M in preferred equity requires $18.5M in preferred dividend payments going forward – investors should thus expect the total amount of preferred dividends to increase in 2024 and beyond.
The normalized FFO per common share was approximately $0.86 during 2023, based on a $54.5M normalized FFO and a weighted average share count of 63.1M shares.
I still prefer the preferred shares
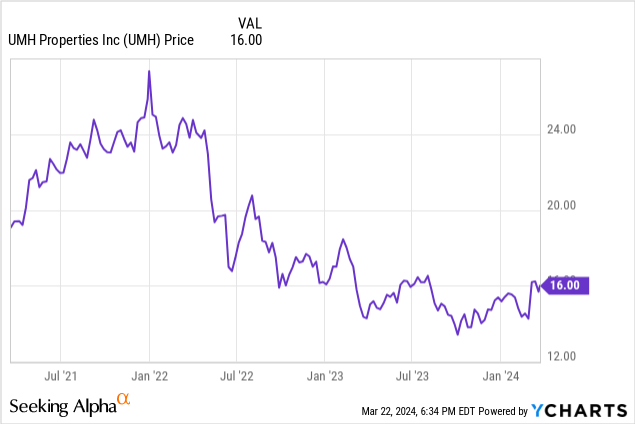
UMH Properties issued an initial 2 million cumulative preferred shares Series D in 2018, and these securities are trading with (UMH.PR.D) as ticker symbol. This series offers a preferred dividend yield of 6.375% based on the $25 principal amount which means this security pays $0.3984375 per share on a quarterly basis. Subsequent to the initial public offering, UMH continued to issue preferred shares and as of the end of 2023, there were 11.6M preferred shares outstanding for a total of $290M in preferred capital. UMH continues to issue preferred shares as it is a relatively low cost of capital. Based on Friday’s closing price, the preferred shares of UMH Properties offered a preferred dividend yield of approximately 6.78% using $23.50 as its closing price.
Seeking Alpha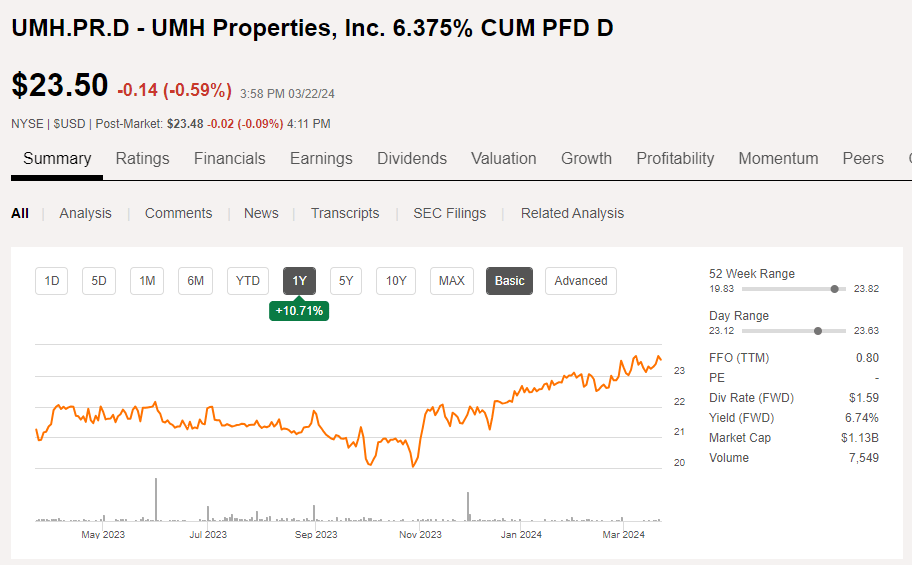
In the previous section of this article I already explained the preferred dividends are quite well-covered, but I obviously also wanted to have a look at the asset coverage ratio. The asset side of the balance sheet (shown below) indicates the balance sheet contains a total of $1.43B in assets, of which $1.151B is related to real estate assets. This includes in excess of $400M in accumulated depreciation expenses.
UMH Investor Relations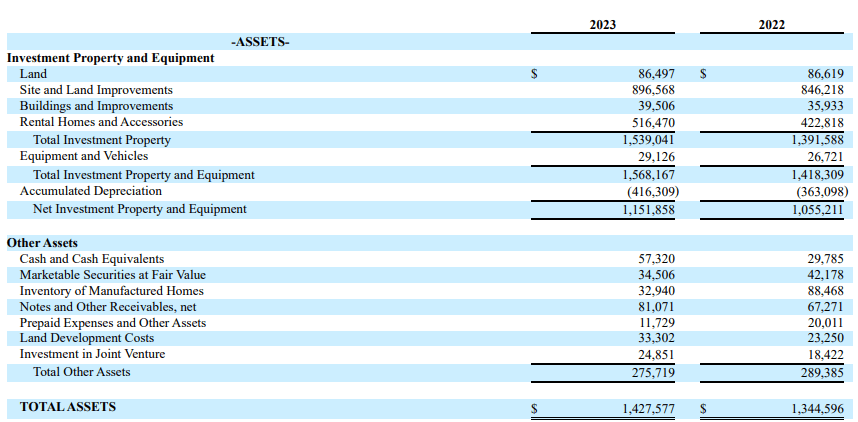
On the liabilities side of the balance sheet, there are just $721M in liabilities with $496M in mortgages, $94M in loans and $100M in bonds. Considering the asset side of the balance sheet contains $57M in cash and $35M in marketable securities, the net debt is just under $600M.
UMH Investor Relations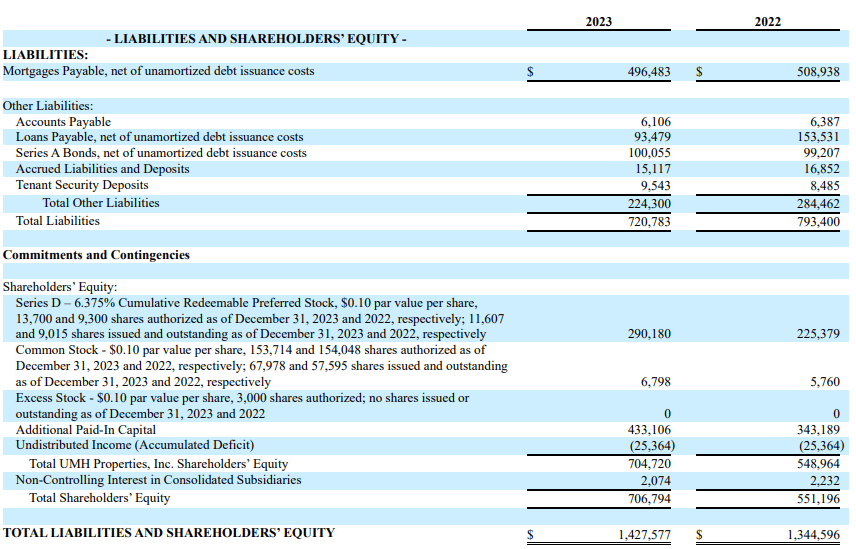
The total amount of equity on the balance sheet came in at $707M ($705M attributable to UMH Properties), of which $290M is preferred equity which means there is approximately $415M in common equity which ranks junior to the preferred equity. While $415M is a pretty comfortable cushion keep in mind that’s based on the book value of the assets and with an annualized NOI close to $115-120M per year, the $1.15B book value of the real estate assets appears to be understated. Applying an 8% yield to $115M in NOI would result in a fair value of $1.44B and an additional $300M that would act as a cushion for the preferred shares.
Investment thesis
Right now, the common shares of UMH properties only really make sense if you expect the interest rates on the financial markets to decrease as I see no other reason why you’d want to pay almost 20 times the normalized FFO for UMH Properties. While you could indeed argue residential real estate commands higher multiples (and taking the anticipated 5% rent hike into consideration), I would feel more comfortable owning the preferred shares instead of the common units of UMH Properties. If I’d want to have exposure to the equity of an operator of a manufactured home community, I would prefer Flagship Communities (OTCPK:MHCUF). I like UMH’s management team very much, but I’d like to see a share price below $15 before considering buying the common units.
I currently have no position in any of UMH Properties’ securities.

 Q2 2024 Earnings Call Transcript")

