
Hans Hansen/DigitalVision via Getty Images
Investment Thesis
UFP Industries’ (NASDAQ:UFPI) growth over the past 9 years was due to organic growth and acquisitions. At the same time, its performance was boosted by an extraordinary price spike in 2021/22. The company is fundamentally sound with topline and bottom-line growths even if you ignore the 2021/22 price spike.
Unfortunately, it operates in a low-growth sector. To achieve double-digit growth, it will have to undertake continuous acquisitions. UFPI is a cash cow that can enable it to pursue such an acquisition strategy. However, a valuation based on this continuous acquisition scenario does not provide a 30% margin of safety.
Business background
UFPI designs, manufactures, and supplies products made from wood, composites, and other materials. It currently has 3 reporting segments – Retail Solutions, Packaging, and Construction.
- The Retail Solutions segment comprises three business units, each focusing on distinct product offerings. These included lumber garden products, composite decking, and project boards. The segment has sales to major retailers like The Home Depot and Lowes. This is the biggest segment, accounting for about 40% of the total revenue in 2023.
- The Packaging segment accounted for about 25% of the total revenue in 2023. Its products included custom packaging products, wooden pallets, corrugate, and labels.
- The Construction segment products included roof trusses, engineered wood components for residential and light commercial projects, and custom interior fixtures. In 2023, this segment accounted for 30% of the total revenue.
The majority of the balance of 5% of the 2023 revenue came from its international operations. In other words, the bulk of UFPI’s business came from America.
The key feature of UFPI is that its growth over the past decade was driven by a combination of organic growth and acquisitions.
- There were annual acquisitions for the period covered by my analysis – 2015 to 2023.
- The size of the annual acquisitions ranged from USD 4 million in 2015 to USD 475 million in 2021.
The company provided data from 2016 on unit growth due to acquisitions and organic growth. Based on the data, I estimated that over the past 9 years, acquisition accounted for a bigger part of the growth. Refer to Chart 1.
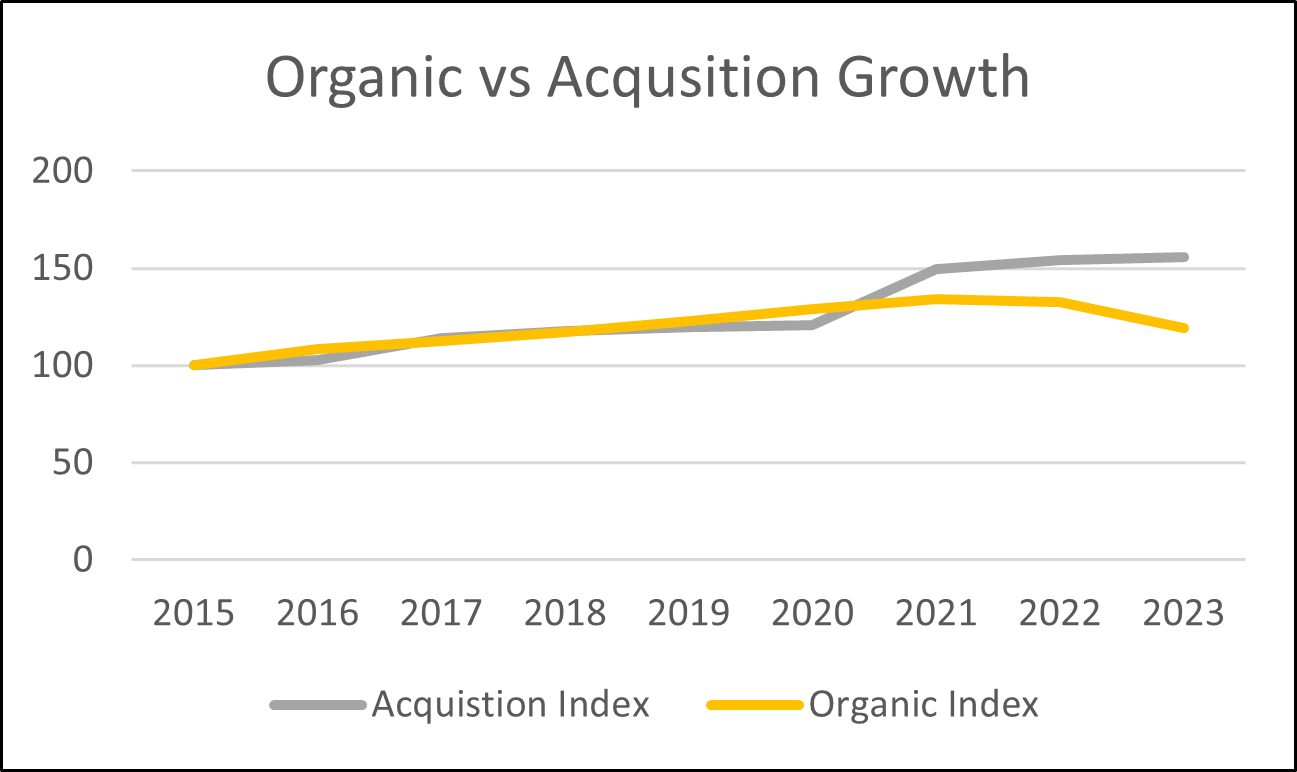
Chart 1: Growth components (Author)
Note to Chart 1: I assumed the revenue index of 100 for 2015. The Acquisition Index for the year was derived by multiplying the previous year’s index by the % acquisition growth for the year. The Organic Index was similarly derived based on the % organic growth.
Operating trends
I looked at 2 groups of metrics to get a picture of the operating trends.
- The left part of Chart 2 shows the trends for 3 metrics – revenue, PAT, and gross profitability (gross profits / total assets).
- The right part of Chart 2 shows the returns – ROIC, ROE and ROA.
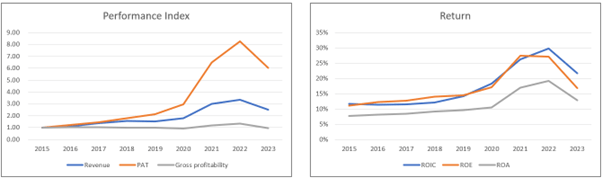
Chart 2: Performance Index and Return Trends (Author)
Note to Performance Index chart. To plot the various metrics on one chart, I have converted the various metrics into indices. The respective index was created by dividing the annual values by the respective 2015 values.
You can see a general uptrend from 2015 to 2023 for revenue and PAT. Over this period, revenue grew at 12% CAGR while PAT’s growth rate was a bit more than double that of revenue at 25% CAGR.
Given the profit trend, you should not be surprised to see similar trends for the 3 returns. Over the past 9 years, ROIC and ROE averaged about 17% each. Given that these returns are greater than the current WACC of 10% and cost of equity of 11%, UFPI created shareholders’ value.
The relatively sharp increases in revenue and profits in 2021 and 2022 were driven by extraordinary jumps in product prices.
- Refer to the right part of Chart 3. You can see that there were general price spikes in 2021/22. Prices has since declined to be in line with the long-term price trend.
- Refer to the left part of Chart 3. In the context of UFPI, there were both increases in average selling prices and sales volume in 2021/22.
The key takeaway is that the 2021/22 performance is not reflective of the long-term potential of the company. You have to discount the 2021/22 price spike effect.
Excluding the price growth, volume growth was 7.9% CAGR over the past 9 years. This is not a high-growth sector, as overall revenue growth of 12% included acquisition growth. I have earlier pointed out acquisitions accounted for a bigger part of the growth.
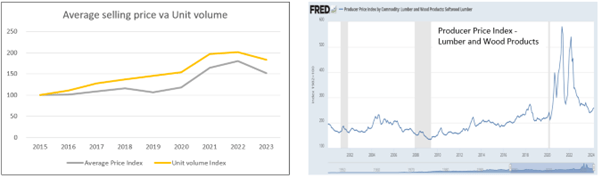
Chart 3: Price and Volume Effects (Author, FRED)
Note to left part of Chart 3: The Average selling price and Unit volume index were derived based on data provided by the company with the 2015 value set to 100 each.
While there was strong topline and bottom-line performance, there was no improvement in gross profitability. In other words, there was no improvement in capital efficiency.
To get a better understanding of the operating profit, I broke it down into various components, as shown in the left part of Chart 4. I also carried out a DuPont Analysis of the ROIC, as shown in the right part of Chart 4.
- There were improvements in the contribution margin. You can see that despite the price decline in 2023 (refer to Chart 3), the contribution margin continued to improve in 2023.
- This is a business with low operating leverage. Over the past 9 years, fixed costs averaged 9% of the total costs (fixed + variable cost).
- The jump in ROIC in 2021/22 was mostly due to an almost proportionate jump in Operating margin.
- There was a declining trend for the asset turnover, despite being “distorted” by the 2021/22 price spikes.
My analyses show that while it was able to improve contribution margins (i.e., better control over variable costs), there were no improvements in capital efficiencies (e.g. gross profitability, asset turnover).
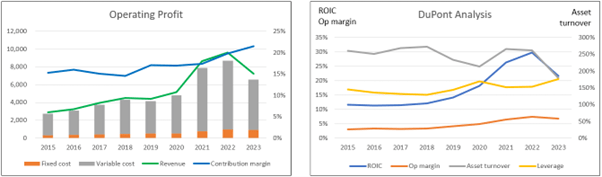
Chart 4: Op Profit Profile and DuPont Analysis (Author)
Note to Op Profit Profile of Chart 4. I broke down the operating profits into fixed costs and variable costs.
- Fixed cost = SGA, Depreciation & Amortization and Others.
- Variable cost = Cost of Sales – Depreciation & Amortization.
- Contribution = Revenue – Variable Cost.
- Contribution margin = Contribution/Revenue.
Financial position
I would rate UFPI as financially sound based on the following.
As of the end of Mar 2024, it had USD 1.1 billion in cash and cash equivalents. This is about 25% of its total assets.
As of the end of Mar 2024, it had a Debt Capital ratio of 11.4%. This had come down from its 2021 high of 20.5%. According to the Damodaran Jan. 2024 dataset, the Debt Capital ratio for the paper/forest products sector was 27.2%.
It was able to generate positive cash flow from operations every year over the past 9 years. From 2015 to 2023, it generated USD 3.6 billion cash flow from operations, compared to its PAT of USD 2.7 billion. This is a good cash conversion ratio.
It has a good capital allocation track record, as can be seen from Table 1. It was able to cover the CAPEX and acquisitions with the cash flow from operation. Excess was returned to shareholders as dividends and share buybacks. And it was able to build up its cash position.
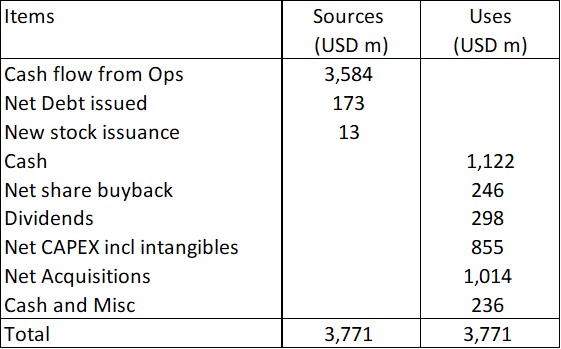
Table 1: Sources and Uses of Funds 2015 to 2023 (Author)
As can be seen from Table 1, it is a cash cow. If there was any negative point, I would have thought that it could have spent more on buyback or dividends.
Reinvestment
Growth needs to be funded and one way to assess this is the Reinvestment rate defined as (Reinvestment/NOPAT).
Reinvestment = CAPEX & acquisitions – Depreciation & amortization + Increase in Net Working Capital.
Over the past 9 years, UFPI incurred an average of USD 115 million per year on Reinvestment. Based on the average NOPAT of USD 299 per year, we have a 39% average Reinvestment rate. This rate included the cash spent on acquisitions.
Without the acquisitions, the average Reinvestment rate reduces to 1%. This illustrates that the company has the financial capacity to have continuous acquisitions.
Valuation
Any valuation of UFPI should take into account the following:
- The 2021/22 performances were outliers due to the price spikes.
- Annual acquisitions seem to be part of the company’s DNA.
If you look at the right part of Chart 3, you can see that the 2023 price had come down to be in line with the long-term price trend. Accordingly, UFPI’s 2023 performance would be representative of its current size (in volume terms) as well as the long-term price position. In other words, if I use the 2023 performance, it would ignore the 2021/22 price spikes.
Next, to model the continuous acquisitions, I used the past 9 years’ annual average Reinvestment of USD 115 million as the target Reinvestment.
On such a basis, I estimated the intrinsic value of UFPI to be USD 140 per share, compared to its market price of USD 117 per share (as of 27 May 2024). Unfortunately, there is only a 20% margin of safety. From a conservative basis, I would not consider UFPI a buy.
Valuation model
I valued UFPI using a single-stage Free Cash Flow to the Firm (FCFF) Model. Refer to Table 1. This model enabled me to address both the price spike and continuous acquisition requirements.
Value to the Firm = FCFF X (1 + g) / (WACC – g)
FCFF = EBIT(1- t) X (1 – Reinvestment rate).
EBIT(1-t) was estimated based on the operating profit profile, as shown in the left part of Chart 4.
The key parameters in the model were:
- I assumed the 2023 values for the revenue, contribution margin, and capital efficiency. These represented the long-term performance that ignored the 2021/23 price spikes.
- The Reinvestment rate was based on the fundamental growth equation of Growth = ROIC X Reinvestment rate.
- The growth rate was a variable that I changed to arrive at USD 115 million Reinvestment (item l) thereby achieving the continuous acquisition requirement.
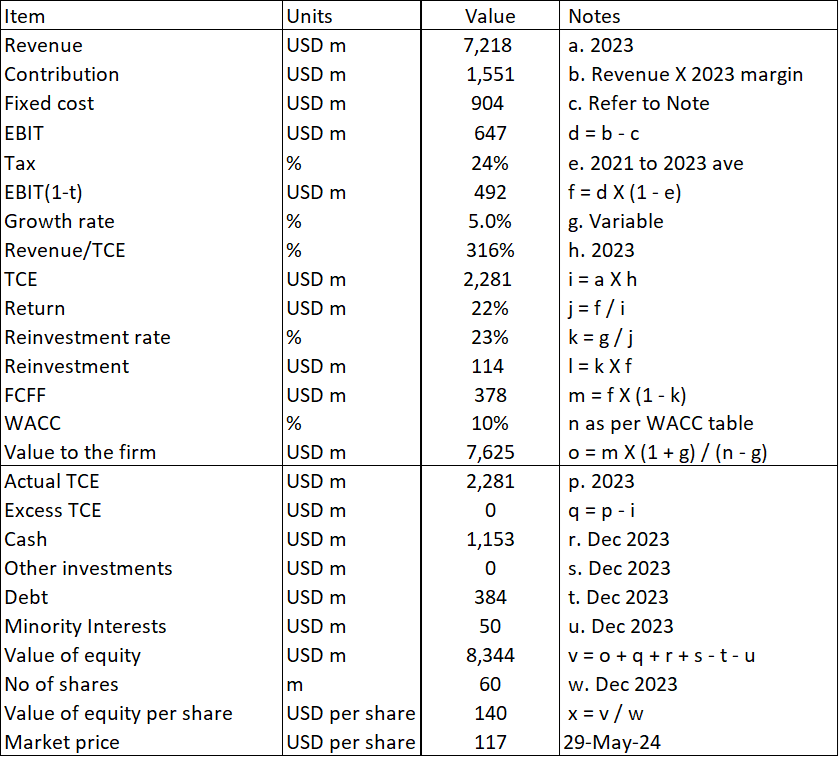
Table 2: Valuation model (Author)
Except for the following, the other terms in the valuation model are self-explanatory
Item c. This was based on the 2023 fixed cost + past 9 years average asset write-off and/or sale of investments.
Item m. The WACC is based on a Google search for the term “UFPI WACC” as per Table 3.
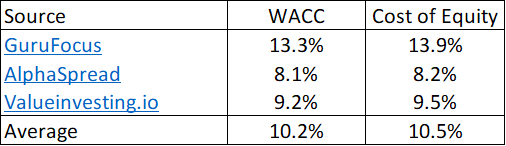
Table 3: Estimating the cost of funds (Various)
Risks and limitations
You should consider the following when looking at my valuation:
- Reinvestment to achieve continuous acquisitions.
- 5% growth rate.
- Price spikes
In my valuation model, I have used the single-stage perpetual growth model. I used the growth rate as an independent variable to determine the Reinvestment of USD 114 million to deliver the continuous acquisitions.
In reality, the Reinvestment varies yearly depending on the size of the acquisitions.
For example, it was USD 642 million in 2021 and USD 82 million in 2020. It was even negative USD 34 million in 2019. The negative arose because the sales shrank, resulting in a reduction in Net Working Capital.
As such, when interpreting my valuation, think long term. If the company was to incur above average acquisition amounts for the next few years, the intrinsic value would be higher than what I have estimated.
The other point about the model is that I was lucky in that the growth rate to determine the Reinvestment was smaller than the WACC. The model will break down if the growth rate is about the same as the WACC. I would then have to adopt a different valuation model if this happens.
The only way to mitigate the issues above is to rely on the margin of safety. You can understand why I am looking at a 30% margin of safety based on my valuation approach.
You may think that the 5% in the model is a low growth rate compared to its past 9 years 12% CAGR in revenue. This 5% is on the high side for estimates of the US long-term GDP growth rate. If I had to use a higher growth rate, it would reach a stage where UFPI’s revenue would be higher than the US GDP growth rate and the model would not be realistic.
Next, in my model, I have assumed that there would not be future price spikes. I treated 2021/22 as an anomaly and not some fundamental change to the business environment. If you believe that we are now living in a more volatile economic situation, you cannot rule out another price spike.
Conclusion
I would consider UFPI a fundamentally sound company.
- It has topline and bottom-line growth even if you ignore the 2021/22 price spikes.
- It is financially sound.
- While there are some debates about its track record in improving operating efficiencies, it has delivered improving returns.
- It created shareholders value.
The main concern is that it is operating in a low-growth sector. The only way to achieve double-digit growth is via continuous acquisitions.
Therein lies the challenge, as the value of a company depends on the size and timing of acquisitions. In my valuation, I assumed a continuous annual acquisition that is equal to its past 9 years’ average annual acquisition.
On such a basis, I estimated that there is only a 20% margin of safety. As such, I would not recommend UFPI a buy.

 Q2 2024 Earnings Call Transcript")

