thamerpic
UBS (NYSE:UBS) is the last big Swiss bank standing. It made headlines last year when it bought Credit Suisse (CS), its main rival, for $3 billion to alleviate concerns that CS was on a death spiral. If you didn’t follow the news at the time, I’d recommend the following SA articles that also helped me make my mind to be long UBS at the time: by IP Banking Research, Daniel Jones and Cavenagh Research.
After this recent price movement to almost $30 per share I started thinking more about how much further could UBS go. Since the acquisition was announced, the majority of SA Analysts have rated UBS a Hold and my rating will be no different. So why should you bother reading another Hold rating? The main attraction is that I expect to give a detailed deep dive of UBS operations and how it is valued against peers. I’ll not be focusing that much on the current quarter earnings, but on how much money will UBS make in the future and if that translates into upside for current shareholders. I’ll first compare UBS with its peers and validate why it isn’t valued in line with the most appreciated banks in terms of Price to Book Ratio (P/B) despite a solid Return on Equity (ROE). Then, I’ll move to review the earnings potential of each UBS’s segment and how that compares to management expectation. In the end, it will be clear what needs to happen for UBS to deserve a rerating that will deliver upside to investors. In the meantime, I believe UBS is a Hold with good opportunities to keep an eye on.
Note that all numbers are in USD, unless otherwise stated.
Is UBS Another Value Trap European Bank?
I think UBS is usually seen as just another European bank within a region that has seen slow growth since the Great Financial Crisis (GFC) in 2008. To understand if that is a fair assessment of the company, I believe the best way is to compare UBS against its European and American banks based on ROE and P/B. To me, those are the two most important metrics for a bank because Book Value is required to increase Assets (i.e. loans) and growing it is a good sign for future earnings, while ROE shows if the bank puts the money it retains (Book Value) to good use. First, let’s compare UBS with its European peers for these two measures.
Price to Book ratio for Selected European Banks from 2005 to 2023 (Seeking Alpha)
What’s pretty obvious from the graph above is that prior to the GFC the European banks were valued by the markets at more than 1.0 P/B with the average of the six banks chosen likely close to 2.0. I interpret a P/B above 1.0 as a bullish reading from the market towards the bank as the expectation is clear that the bank will continue to grow its Book Value. After the GFC, all European banks suffered a major rerating, bringing their P/B below 1.0 with some sporadic exceptions by UBS and HSBC (HSBC). If a P/B above 1.0 is bullish, then a P/B below 1.0 is bearish, mainly because the expectation now is that banks won’t be able to generate enough cash to both significantly increase their equity and pay dividends to investors.
It’s interesting to note UBS’s performance: its P/B dipped following the Credit Suisse acquisition and has recently regained territory. The reality is that the market was slow to appreciate the acquisition as Book Value increased and Price stayed close to $20. Now that the stock price is around $30 it is once again slightly above 1.0.
When reviewing the ROE for the same period, it’s possible to see that the P/B rerating of Europeans banks to below 1.0 isn’t unjustified. Unfortunately, I had to cut the graph from 2005 to 2023 in two as the significant losses during the GFC distorted the ROE for UBS and Deutsche Bank (DB), but I believe it’s clear that between 2005 and 2007 these banks enjoyed ROE between 15% and 20%, while after 2010 their ROE has been pretty much stable at 10% or less.
Return on Equity for Selected European Banks from 2005 to 2007 (Seeking Alpha) Return on Equity for Selected European Banks from 2010 to 2023 (Seeking Alpha)

However, UBS shines as the leader in P/B and ROE, so, in terms of European banks, UBS could be considered the leader of the pack. That poses an interest question: if it’s the leader of the European banks, how does it compare with American banks? The graph below shows the P/B ratio for UBS and selected American banks. UBS trades in line with Goldman Sachs (GS), above the big retail banks Bank of America (BAC) and Citi (C), but quite far from the two leaders JPMorgan (JPM) and Morgan Stanley (MS).
Price to Book ratio for Selected American Banks and UBS from 2005 to 2023 (Seeking Alpha)
When adding the ROE graph, it’s clear that UBS is a very good contender for American banks, as it is second place with 11.27%, only after JPM’s 14.27%. Now comes the interesting part: if UBS has a higher ROE than Morgan Stanley, why doesn’t it trade at 1.59 P/B like MS? Sure, Morgan Stanley isn’t a Retail Banking, has achieved a significant turnaround since 2010 and focused much more in managing wealthy individuals’ money, but isn’t UBS in a similar process?
Return on Equity for Selected European Banks and UBS from 2010 to 2023 (Seeking Alpha)
So my key takeaway of all these graphs is that UBS is the uncontestable leader in Europe in terms of positive perception by the market, but still falls short of JPM and MS. As my final evidence, note how much each segment comprises of Revenue for UBS, JPM, MS, BAC, GS and Santander (SAN). UBS has an Asset & Wealth Management (AWM) segment as significant as Morgan Stanley and this is sometimes touted as why Morgan Stanley trades at more than 1.5 P/B. UBS has the smallest portion of revenue coming from Retail Banking compared to the other banks (except Goldman Sachs) and a similar portion as BAC coming from Investment Bank & Trading. AWM is the most stable of these businesses and doesn’t suffer from the high costs of Retail nor the volatility in earnings from Investment Bank & Trading. By these terms and comparing strictly with MS, UBS would deserve a continued rerating of its P/B to close to 1.5 as it has a similar revenue mix and a higher ROE. To confirm this hypothesis, we’ll deep dive now into each of UBS’s segment and how their performance will translate into Book Value and Return on Equity.
Revenue Share for Each Segment in UBS, JPM, MS, BAC, GS, SAN in 2023 (Author, UBS IR, JPM IR, MS IR, BAC IR, GS IR, SAN IR)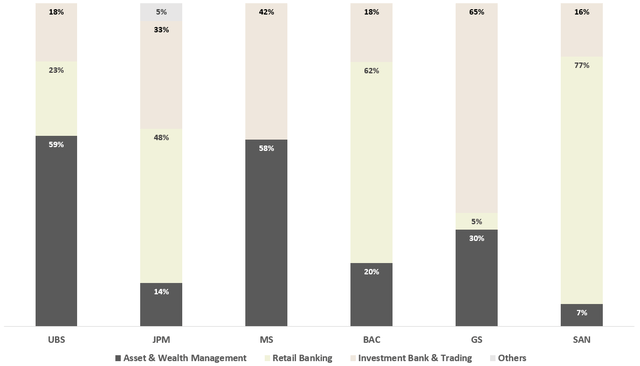
As a disclaimer, it’s not standardized how each Bank reports its revenue, so I had to take some liberty to bundle them and try to put a coherent picture for analysis.
A Deep Dive on Each of UBS’s Business Segment
Global Wealth Management
The Global Wealth Management (GWM) segment cares for High-Net-Worth Individuals, Ultra-High-Net-Worth Individuals and Family Offices, providing services of Portfolio Management, Advisory, Brokerage and Lending. It mainly derives Revenue from Recurring Net Fee Income (50% of Q3’23 Revenue), Net Interest Income (33% of Q3’23 Revenue) and Transaction-Based Income (17% of Q3’23 Revenue). The Recurring Net Fee Income is mainly the monthly fee paid by these individuals and Family Offices to have access to UBS’s products, which makes for a very stable and reliable source of revenue. Net Interest Income is exactly what it means: Interest earned on lending to these individuals and Family Offices. Finally, Transaction-Based Income comes from the fee that UBS charges for executing a transaction on behalf of customers such as stock purchases, allocating money in funds, etc, thus making it more dependent on how the markets are behaving.
Probably the most important metric in this segment is Assets Under Management (AUM) and how it is growing. As can be seen from this Q3’23 Earnings slide, UBS has been able to stabilize the outflow of Assets and Deposits from Credit Suisse. This is great news and it means that they can shift their focus to recapture some of that money back, instead of just reassuring clients that everything is fine.
Net New Money and Net New Deposits for GWM and P&C from 3Q’22 to Q3’23 (UBS IR)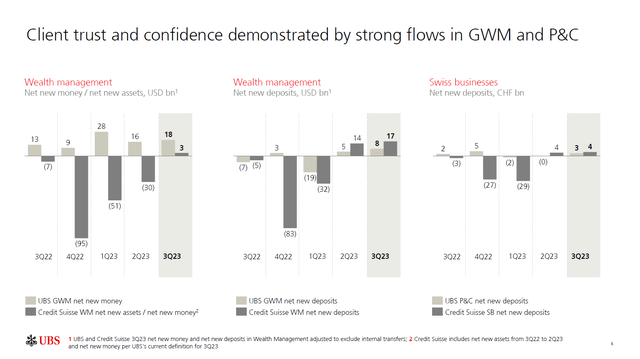
However, there is still a lot of work to be done. The graph below shows the Operating Profit and ROE trend for both UBS and Credit Suisse since FY’20. I have also expanded the FY’23 by quarter on the right to show the impact of consolidating Credit Suisse into UBS. The Global Wealth Management from Credit Suisse had a significant lower ROE than UBS’s. Thus, when reviewing FY’23 it is possible to see the effect in ROE of this acquisition. Now, UBS needs to focus in bringing back this ROE to its usual 25%. I forecasted a path to this 25% in FY’24 and FY’25 and we’ll evaluate this in the Valuation section.
UBS and Credit Suisse Op Profit (in Billion) and ROE (in %) from FY’20 to FY’25 Estimate (UBS IR, Credit Suisse IR, Author)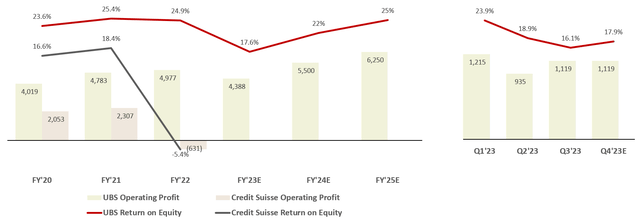
Personal & Corporate Banking
The Personal & Corporate Banking (P&C) is UBS’s Retail operation in Switzerland and is similar to any other retail bank. 60% of its Revenue comes from Net Interest Income (lending to individuals and corporations), 18% from Recurring Net Fee Income (the monthly fees paid by customers) and 22% from Transaction-Based Income (UBS’s fee for executing transactions on behalf of customers). As highlighted in the previous section’s slide, UBS has also stabilized Credit Suisse retail operations and has added $7 billion CHF in new deposits during the Q3’23. The key metric for a retail bank is the country’s interest rate, which is shown below. Switzerland has just ended a significant period of negative interest rates and, hopefully for UBS, will remain in positive territory for the future.
Swiss National Bank Interest Rate Last 10 Years (Tradingeconomics.com, SNB)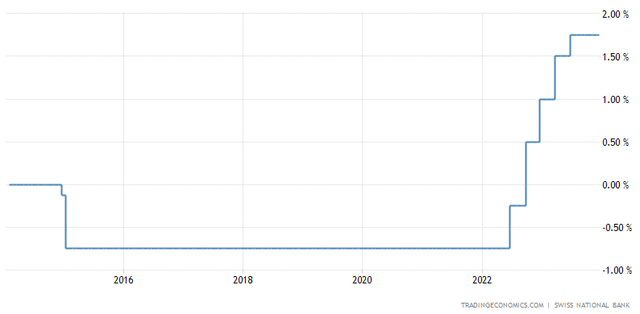
Again, as shown in the graph below, it’s possible to see that Credit Suisse had a significant lower ROE than UBS in the retail banking segment. ROE continues to take a dive during FY’23, but, similar to the GWM segment, I’m forecasting a comeback to its UBS-like ROE until FY’25.
UBS and Credit Suisse Op Profit (in Billion) and ROE (in %) from FY’20 to FY’25 Estimate (UBS IR, Credit Suisse IR, Author)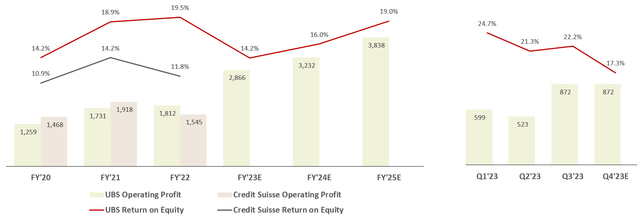
Asset Management
The Asset Management (AM) represents the UBS’s in-house products in several different asset classes like Equities, Fixed Income, Hedge Funds, ETFs, Real Estate, etc. It’s the smallest segment of UBS, representing only 6.5% of Q3’23 revenue, and it mainly earns management fees (if you invest in a proprietary UBS fund, they charge 1% of your assets, for example). The GWM segment, for example, can channel clients’ money towards the UBS in-house products sold through the Asset Management segment or invest it in products from other banks and financial services companies.
UBS and Credit Suisse Op Profit (in Billion) and ROE (in %) from FY’20 to FY’25 Estimate (UBS IR, Credit Suisse IR, Author)
As you’re probably used by now, above is the same graph already displayed for the AM segment, showing that Credit Suisse had a significantly lower ROE than UBS. This seems to be the most volatile segment of all, so trying to figure out an expected future ROE for FY’24 and FY’25 is no simple task. I decided to be more conservative here and considered a 40% ROE for FY’25 which is likely an average of both companies.
Investment Banking
Finally, the Investment Banking (IB) segment is where one would expect to see Credit Suisse in a better position than UBS. IB is mainly the business of providing advisory services to all players within the financial markets. Prior to the pandemic and all the issues with Credit Suisse, the bank was usually ranked as the first or second bank in total IB fees after the five major US banks, with UBS in a very distant position. If we combine Credit Suisse and UBS IB fees for 2019, this new company would rank fifth and surpass Citi as one of the top investment banks. I deliberately chose 2019 to show the potential of Credit Suisse without its recent problems. Note that below is only IB fees and this doesn’t reconcile with total revenue for this segment as it has other products besides fees.
2019 Investment Banking Ranking (Refinitiv)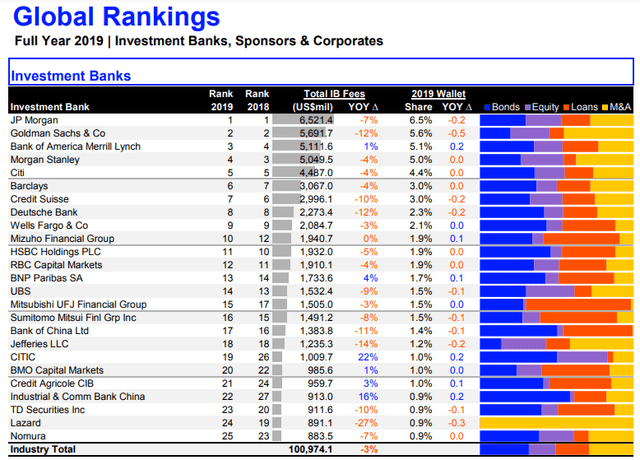
However, with all that happened with Credit Suisse in the past years and the significant drop in investment banking activity last year, even this segment lost its shine and posted significant losses in FY’21 and FY’22. A rebound in FY’24 of M&A and IPO activity could support a comeback and, if UBS manages to leverage the past strength of Credit Suisse in this segment, significantly increase operating profit and ROE.
UBS and Credit Suisse Op Profit (in Billion) and ROE (in %) from FY’20 to FY’25 Estimate (UBS IR, Credit Suisse IR, Author)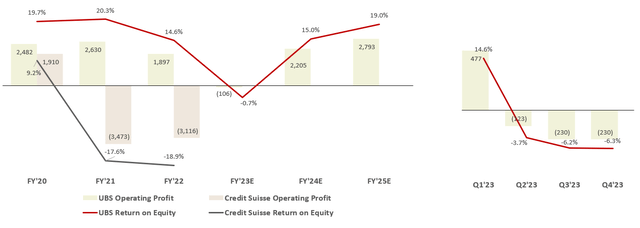
Valuation
Now it’s time to put all of the pieces together. If we sum all of the Operating Profit that I estimated for FY’25 we arrive at a total of $13.8 billion, but that doesn’t take into consideration neither Taxes nor Operating Profit from the segments Non-Core and Legacy, and Group Items. These two remaining segments are almost impossible to forecast as Non-Core Legacy refers to the run-off assets from Credit Suisse that UBS decided to dispose and Group Items refers to corporate expenses and other expenses (e.g. integration or acquisition expenses).
In combination, these two segments have posted losses close to $1 billion in the years prior to the acquisition, with that amount jumping to more than $2 billion just in Q3’23 driven by integration-related expenses. I don’t expect the losses from Credit Suisse to remain indefinitely, so let’s say it will be back to $1 billion loss in FY’25. So starting with $13.8 billion, less $1 billion loss for these two segments and removing 25% for taxes (which is UBS’s historical rate), our calculation arrives at $9.6 billion in Net Income for FY’25. This translates to an 11.2% ROE when considering the current $85.4 billion Book Value, which is pretty much in line with what UBS has been historically posting. To be fair, UBS could retain part of its Q4’23 and FY’24 earnings and increase Book Value, but if the Operating Profit doesn’t improve versus my forecast, ROE would drop.
Expected RoTCE1 for UBS in FY’26 (UBS IR)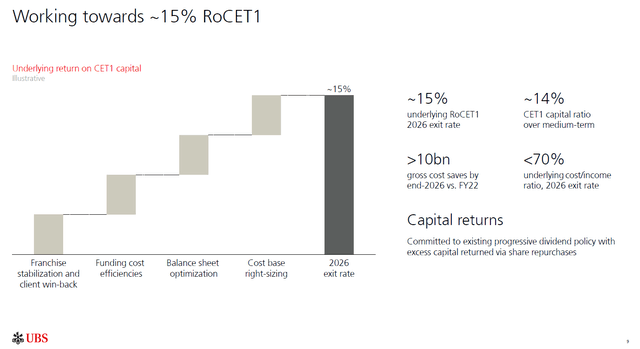
It’s also important to check my forecast with what management expects to deliver. In the slide above shown during Q3’23 earnings, management highlighted their expectation of ~15% RoCET1 in FY’26. Note that this doesn’t mean ROE will expand to ~15% from the 11.2% I forecasted. RoCET1 is different from Book Value, as it discounts some hybrid capital instruments, subordinated term debt and other risks. As of Q3’23, UBS reported its Common Equity Tier 1 Capital at $78.6 billion.
Amount of UBS’s Common Equity Tier 1 Capital as of Q3’23 (UBS IR)
The same $9.6 billion now translates to a 12.2% RoCET1 compared to the 11.2% ROE. With a simplistic math, we could consider that ~15% RoCET1 translates to ~14% ROE, which in this case would be a significant improvement versus the historic ~11% that UBS reported and that I have also forecasted. So we are left with a conservative scenario of 11% ROE that is in line with what UBS has delivered and a 14% ROE that more closely aligns with management expectation and translates to a significant capture of synergies given the Credit Suisse integration.
Finally, the last piece of inquiry is if ROE will translate into Book Value growth. ROE can improve to 14% from 11% by two ways: an increase in Net Income at a faster pace than increase in Book Value or simply a decrease in Book Value. Note that “Funding Cost Efficiencies” and “Balance Sheet Optimization” in the walk of ~15% RoCET1 could mean a decrease in Book Value. The two graphs below highlight the importance of growing Book Value. If a Bank grows it, then it can increase its assets and thus generate more Net Income. If it doesn’t grow, it will likely not generate more Net Income than it currently is. JPM and MS were the two banks that grew Book Value per Share the most since 2005 and that translated to a higher Price Return. Both graphs have the same order.
Book Value per Share for UBS, JPM, MS, BAC and SAN from 2005 to 2023 (Seeking Alpha) Price Return per Share for UBS, JPM, MS, BAC and SAN from 2010 to 2023 (Seeking Alpha)

If UBS wants to be valued at more than $30 per share, it needs to translate its ROE or RoCET in Book Value per Share growth. This metric (Book Value per Share) has been almost flat for the past 20 years, with the only exception being the acquisition of Credit Suisse. This acquisition is what prompted the stock to rise from $20 to $30 and I don’t expect any upside left because of that – this low-hanging fruit has already been picked.
So what investors need to see from UBS is those ~$10 billion being generated as Net Income flowing not only to Dividends and Buybacks, but also to support future growth. If UBS achieves an ROE close to ~14% and manages to grow its Book Value, than I’d expect a rerating of the stock to 1.5x P/B. Investors would be very happy to see their shares jump from $30 to $45 while also collecting some 5% return in Dividends and Buybacks (assuming that 50% of earnings is retained to grow Book Value). However, if UBS only manages to increase its ROE but not Book Value, I’d expect this stock to be much more like a bond that returns 10% yearly. Investors would not see much price appreciation, but would benefit from a ~$10 billion Net Income that could be used for Dividends and Buybacks.
I can’t claim to know which of these two scenarios is more likely, but investors would be wise to keep a close look at how ROE and Book Value evolve during the next quarters. This will tell us if the company is heading towards being more like a bond without price appreciation and a 10% return or it has a high chance of being rerated by the market and returning 50% in price and some 5% in dividends and buybacks.
Risks and Q4 Earnings Expectation
The major risk I see for UBS is the execution of Credit Suisse integration. It’s a good sign that UBS has decided to give up its loss protection agreement with the Swiss government, but that doesn’t necessarily mean that more losses aren’t in the horizon from the discontinued operations of Credit Suisse. Although a good political move, I believe it was necessary to avoid future backlash as UBS prepares to cut thousands of jobs, mainly in Switzerland. It wouldn’t be good publicity to fire thousands of Swiss nationals while having the financial support of the government in case of any losses. It’s important to keep monitoring the Non-Core and Legacy segment and see that losses are decreasing and not increasing.
I could also point to an economic slowdown or a recession coming from the high interest rate environment we are currently on, but that recession seems to never arrive. Still, UBS is not a retail bank, but a giant Wealth Management company with a small bank operation, so I believe that this exposure can protect them from volatility in earnings.
Finally, UBS reports Q4’23 earnings on February 6th and I’d expect to see continued losses from Credit Suisse integration. Investors who check UBS financials should make sure they review the “Underlying” section as that’s where UBS reports financials excluding one-timers from this integration. So murky numbers are still on the horizon and shouldn’t be seen as bad news, but any sign of improving ROE and Book Value will support a bullish view.
Takeaway
My Hold rating is based in the still unsure scenario of what UBS will be in the future: a 10% bond-like stock or a stock on the verge of a P/B rerating and 50% upside. I definitely wouldn’t sell this stock as I can’t see it trading below 1.0 P/B, but I can’t recommend investors to Buy as I don’t have a clear view of ROE improvement and Book Value growth. If positive signs are shown in Q4’23 or in later quarters, then investors may want to take quick action to capture this possible upside.
Investors who bought UBS at the time of the Credit Suisse acquisition announcement are likely holding a 50% price appreciation and a minimum expectation of ~15% returns in dividends and buybacks, plus the possibility of a 50% upside. My advice to Hold is mainly targeted to these shareholders.


