RiverNorthPhotography
Overview
The possibility of investing into a company that I have been a consumer of for large portions of my life has always been very cool to me. Furthermore, collecting a growing dividend from a company that I, personally, consume from is an added bonus that makes the concept even more attractive to me. However, it would be highly irresponsible to invest in a company just because you are familiar with their products, so I aim to give a fair analysis here by reviewing their financials, dividend growth, valuation, and vulnerabilities.
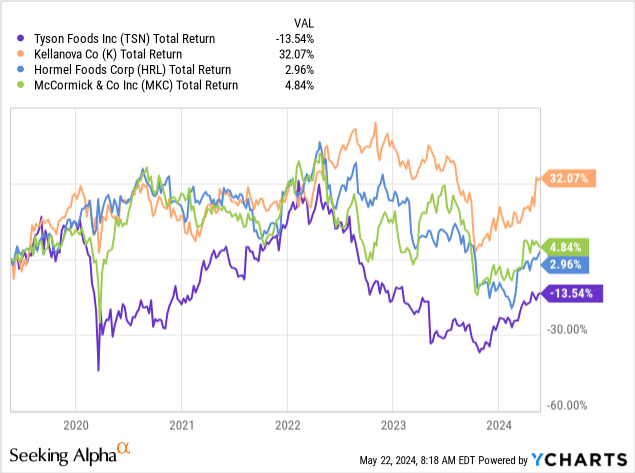
Tyson Foods (NYSE:TSN) is probably most popular for their chicken strips, but they operate as a worldwide food company that brings in revenue through the following segments: Beef, Pork, Chicken, and Prepared Foods. However, TSN has been struggling to gain any momentum with increasing revenue from sales due to macro conditions. As a result of this, we can see that TSN actually underperforms some peers such as Kellanova (K), Hormel Foods (HRL), and McCormick (MKC) in total return over a five-year period. TSN is the only company with negative total returns here.
For some context, Tyson is approaching 90 years of age, as the company was founded back in 1935. TSN captures about 26.6% of the foods market share through their four segments, and this percentage has increased gradually since 2019’s market share total of 22.6%. This is quite impressive given the difficulty around the foods market at the moment.
Between the combination of higher interest rates, higher inflation, and stagnant wages, consumers are starting to shift how they spend their dollars at the groceries. So being able to grow market share dominance while consumers shift their spending habits is quite an achievement. However, let’s take a look at the financials and segment performance to dig a bit deeper.
Financials – Segment Performance
TSN recently reported their Q2 earnings and the results were a bit mixed as earnings per share landed at $0.62, beating expectations by $0.22 per share. However, revenue decreased by 0.5% year over year, amounting to $13.07B for the quarter. This can be attributed to mixed results throughout each of the segments. Sales amounts look almost identical from the year prior, as Q2 sales totaled $13.07B and Q2 sales of the prior year totaled $13.13B. However, what stands out is that operating income and net income per share increased for this year’s Q2.
TSN Q2 Earnings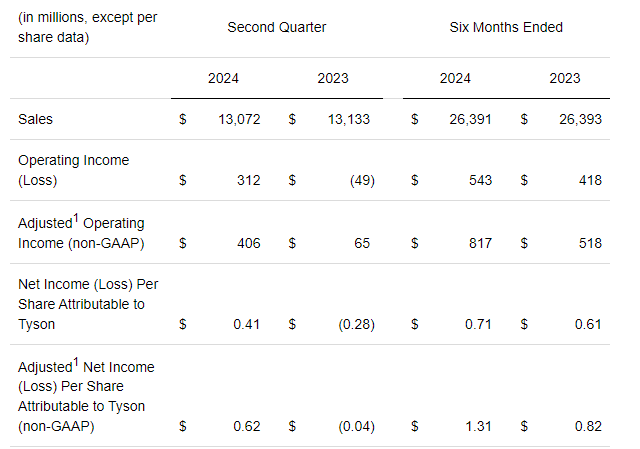
Starting off with the prepared foods segment, prices decreased by 1.4%, but this was offset by an increase in volume of 0.7%. Total sales for the quarter came in at $2.4B, which is in align with Q2 of the previous year, which also totaled $2.4B. This increase in volume here was driven by the previously completed Williams Sausage Company acquisition. The operating margin here slightly decreased from 10.4% down to 9.7%, which can be attributed to startup costs. So while this segment didn’t show any meaningful growth, it managed to stay aligned with prior performance. Operating income is expected to fall within the range of $850M to $950M by the end of the fiscal year in this segment.
The chicken segment saw decreases, with sales totaling $4B, down from last year’s total of $4.4B. This can be attributed to a 6.1% decrease in volume as well as a 2.1% decrease in pricing across these product lines. However, this was offset by higher operating margins of 3.9% which helped boost adjusted operating income up to $160M, marking an improvement from the $166M loss suffered in the year prior. This segment saw lower volumes because of the lower production amounts, and sale prices decreased due to pass through of lower input costs. Chicken is projected to have the strongest growth, with operating income landing between $700M to $900M for the year.
The beef segment saw an increase in sales amounting to $4.95B, an increase over the prior year’s total of $4.6B. This can be rooted in a 2.8% increase in volume as well as a 4.5% increase in pricing on these products. Sales increased due to higher pricing per pound and higher average weights of their meat cuts. However, operating income suffered a loss of $34M due to negative adjusted operating margins of -0.7%. The outlook for beef remains poor as TSN expects production to decrease 2% for 2024 and anticipate an operating income loss between $100M to $400M.
Lastly, we did see some improved spreads within the pork segment. Sales amounted to $1.48B, which was a slight increase from the prior year’s total of $1.42B. This slight increase was driven by higher volumes of 2.9% and slight price increases at the rate of 1.9%. Adjusted operating income also grew to $33M because of a 2.2% increase in adjusted operating margin, which was an improvement over last year’s loss of $31M. Sales in this segment were higher due to higher product pricing, mostly. Domestic production is estimated to increase by 3% for the fiscal year and operating income may land between $50M to $150M.
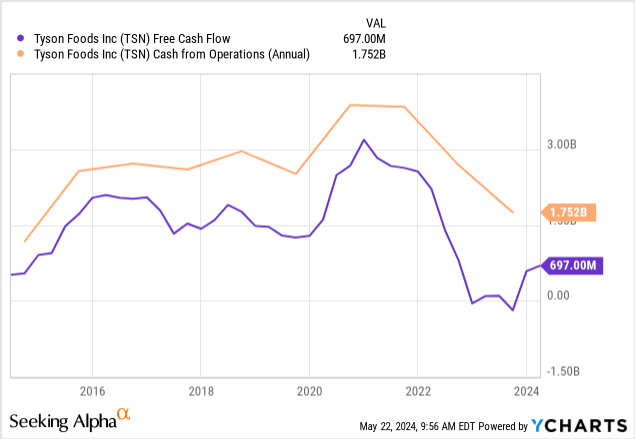
We can see that both cash from operations, as well as free cash flow, decreased around Q2 of 2022. Coincidentally, this is when interest rates started rapidly rising before reaching their decade highs. I believe that these higher interest rates are a contributing factor to the slowed growth of TSN because higher rates firstly increase borrowing costs, but it also increases the operational costs for TSN if suppliers end up passing through those costs as the price for raw materials or livestock increases. This would ultimately have a trick down effect and would create tighter profit margins for Tyson.
Vulnerabilities
While increases in costs and shrinking operational margins can be a result of higher interest rates, this also creates a dynamic of shifting consumer spend. Tyson remains highly vulnerable to the spending patterns of its customers and as the general costs of living increase, consumers are looking to cut their spending bills down wherever they can. This includes opting for store-brand or cheaper alternatives than national brands like TSN. There is already a ton of data to back the shift that more consumers actually prefer the store branded alternatives.
eMarketer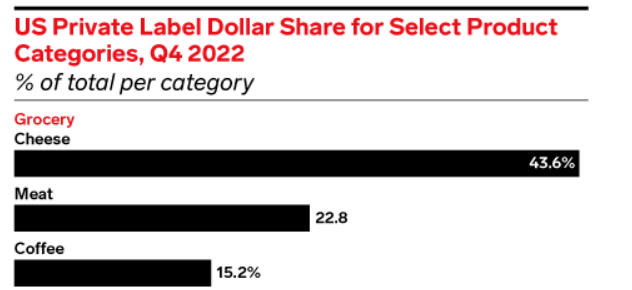
As we can see, private labeled meat now accounts for over 22% of the US market share. As prices continue to rise, I imagine that more consumers will begin embracing these private labeled alternatives since quality, taste, and ingredients are generally the same. At the end of the day, I believe that sacrificing the small nuanced differences between Tyson chicken strips versus a more affordable private label brand is an easy choice for consumers to make if it means they get to save a bit of money.
This extends across most age brackets as well, with data suggesting that 64% of Gen Z shoppers frequently buy private labeled brands. Over 50% of shoppers stated that private labeled alternatives offer a similar valuable, reliable, and variety-based experience while also being more cost-efficient. This isn’t a problem that unique to Tyson, since a lot of peers also face the same challenges within the foods categories outside of meats. Some examples of that would be companies like General Mills (GIS) or Hormel Foods (HRL) that also have experienced decreases in volume and experienced a loss of market share to these private labeled products.
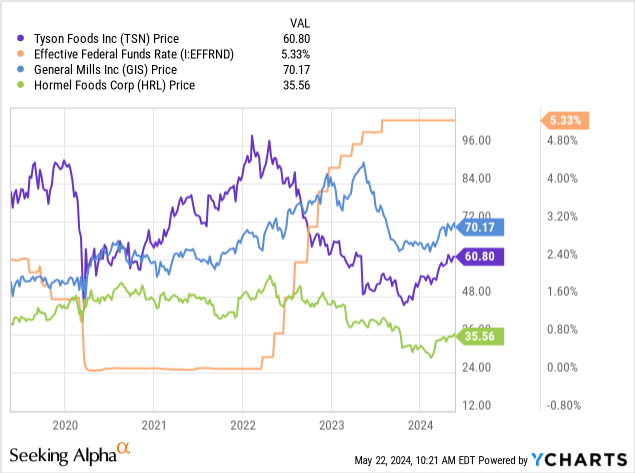
Additionally, we can see that they all follow a very similar trend of vulnerability to the interest rates increases. When the federal funds rate started to rapidly increase throughout 2022, we saw all share prices for these companies retreat to the downside. This can be attributed to the increased borrowing costs and increased operational costs throughout different channels of the business. As we continue to sit in this higher rate environment, the best approach here for companies within the food category would be efficient capital management until the cycle shifts and interest rates start to come back down.
Dividend
As of the latest declared quarterly dividend of $0.49 per share, the current dividend yield is 3.2%. While a low starting yield like this isn’t something that gets people too excited, the value has been in the growth of the dividend over time. TSN has increased their dividend payouts for over twelve consecutive years. For example, over a long ten-year time period, the dividend has been increased at a CAGR (compound annual growth rate) of 22.74%. However, this growth has slowed in these challenging macroeconomic times to a dividend CAGR of 3.89% over a three-year time period. This sort of growth can help long-term investors lock in a solid yield on cost.
However, I feel that this growth may be threatened by the higher payout ratio and struggling momentum with free cash flow. The current dividend payout ratio listed sits at a whopping 97% when the sector median payout ratio is closer to 50%. There are currently slight signs of this improving with the rising free cash flows. Free cash flows a year ago sat at negative $328M, but this has since improved to $556M.
As operating margins improve over time, we will likely see free cash flow begin to increase even further. Cash and cash equivalents have now surpassed $2B and cash from operations totals $2.16B, so they should be able to at least maintain the current dividend rate for the next year. If interest rates start to get cut by the end of the year, this would significantly improve the rate of cash generation of operational margins should improve, and debt payments have the potential to decrease.
Valuation
The price of TSN still sits below its pre-pandemic levels and is down over 24% in price on a five-year time frame. The current forward price to earnings ratio sits at 31.1x, which indicates extremely over valuation when compared against the sector median of 19.45x. However, the average Wall St. price target for TSN sits at $63.50 per share, representing a potential upside of only 4%. The highest price target sits at $83 per share and the lowest is at $51 per share. In order to get another estimate of a fair value, I decided to run a dividend discount model here, since TSN has a solid track record of raising the dividend.
I first compiled all the annual dividend payout amounts dating back to 2018. We can see that the dividend has increased at a CAGR of 7.54% since then. I also input an estimated full-year dividend payout of $1.95 per share for 2024, representing a very conservative dividend increase of only 1%. In terms of growth, I thought that an estimated growth rate of 6% was fair, since year over year revenue growth has averaged 6% over the last five years and EPS long-term growth has averaged about 7%.
Author Created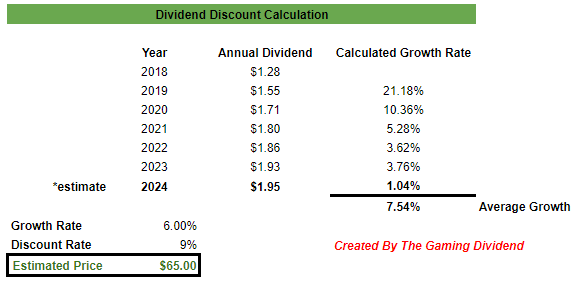
With the inputs in place, I come to an estimated fair value of $65 per share. This closely aligns with the average Wall St. price target and represents a potential upside of approximately 7%. When combined with the current dividend yield of over 3%, there is a possibility to see double-digit returns from this point forward. However, it’s important to keep in mind that the market conditions are not ideal surrounding the higher interest rates and tightening consumer spend, so this 6% growth target may not get hit until these conditions improve.
Takeaway
In conclusion, Tyson has to maintain efficient capital management to ride out this unfavorable market cycle. Increases in operational margins may have impacted their business, but this has been an issue across the entire food sector and has affected peer businesses. The growth of the chicken and prepared foods segments continues to be the main driver of business growth for now, as beef and pork struggle to gain any momentum. I believe that once interest rates start to come down, we may see the price start to recover to the upside as margins improve, consumer spending loosens, and raw material costs come down. In terms of valuation, there may be a slight upside potential to $65 per share, based on my dividend discount model. The current dividend payout ratio remains high, but prospects are improving as free cash flow has grown over the last quarter.


