franckreporter
Investment Briefing
In our opinion the basic materials sector offers a compelling risk reward calculus over the coming 12 to 18 months. Our findings from Q3 2023 earnings illustrated that the basic materials sector had 10% of the projected S&P 500 index earnings growth this year, but held just 2% notional value of the market-weighted index at the time. Readers of mine will have seen the chart in Figure 1 extensively published throughout our most recent series of analyses.
Moving into the new year, we are already well into Q4 2023earnings season. Just under half of the sectors reporting at the time of publication.
According to FactSet analysis of the numbers so far (Figure 1a), the materials sector, along with the consumer discretionary, consumer staples and healthcare sectors, had the highest percentage of companies reporting above earnings estimates. This is constructive. It confirms somewhat there is upside potential within the sector and that top-down security selection can be tilted towards are names within the basic materials domain.
Figure 1.
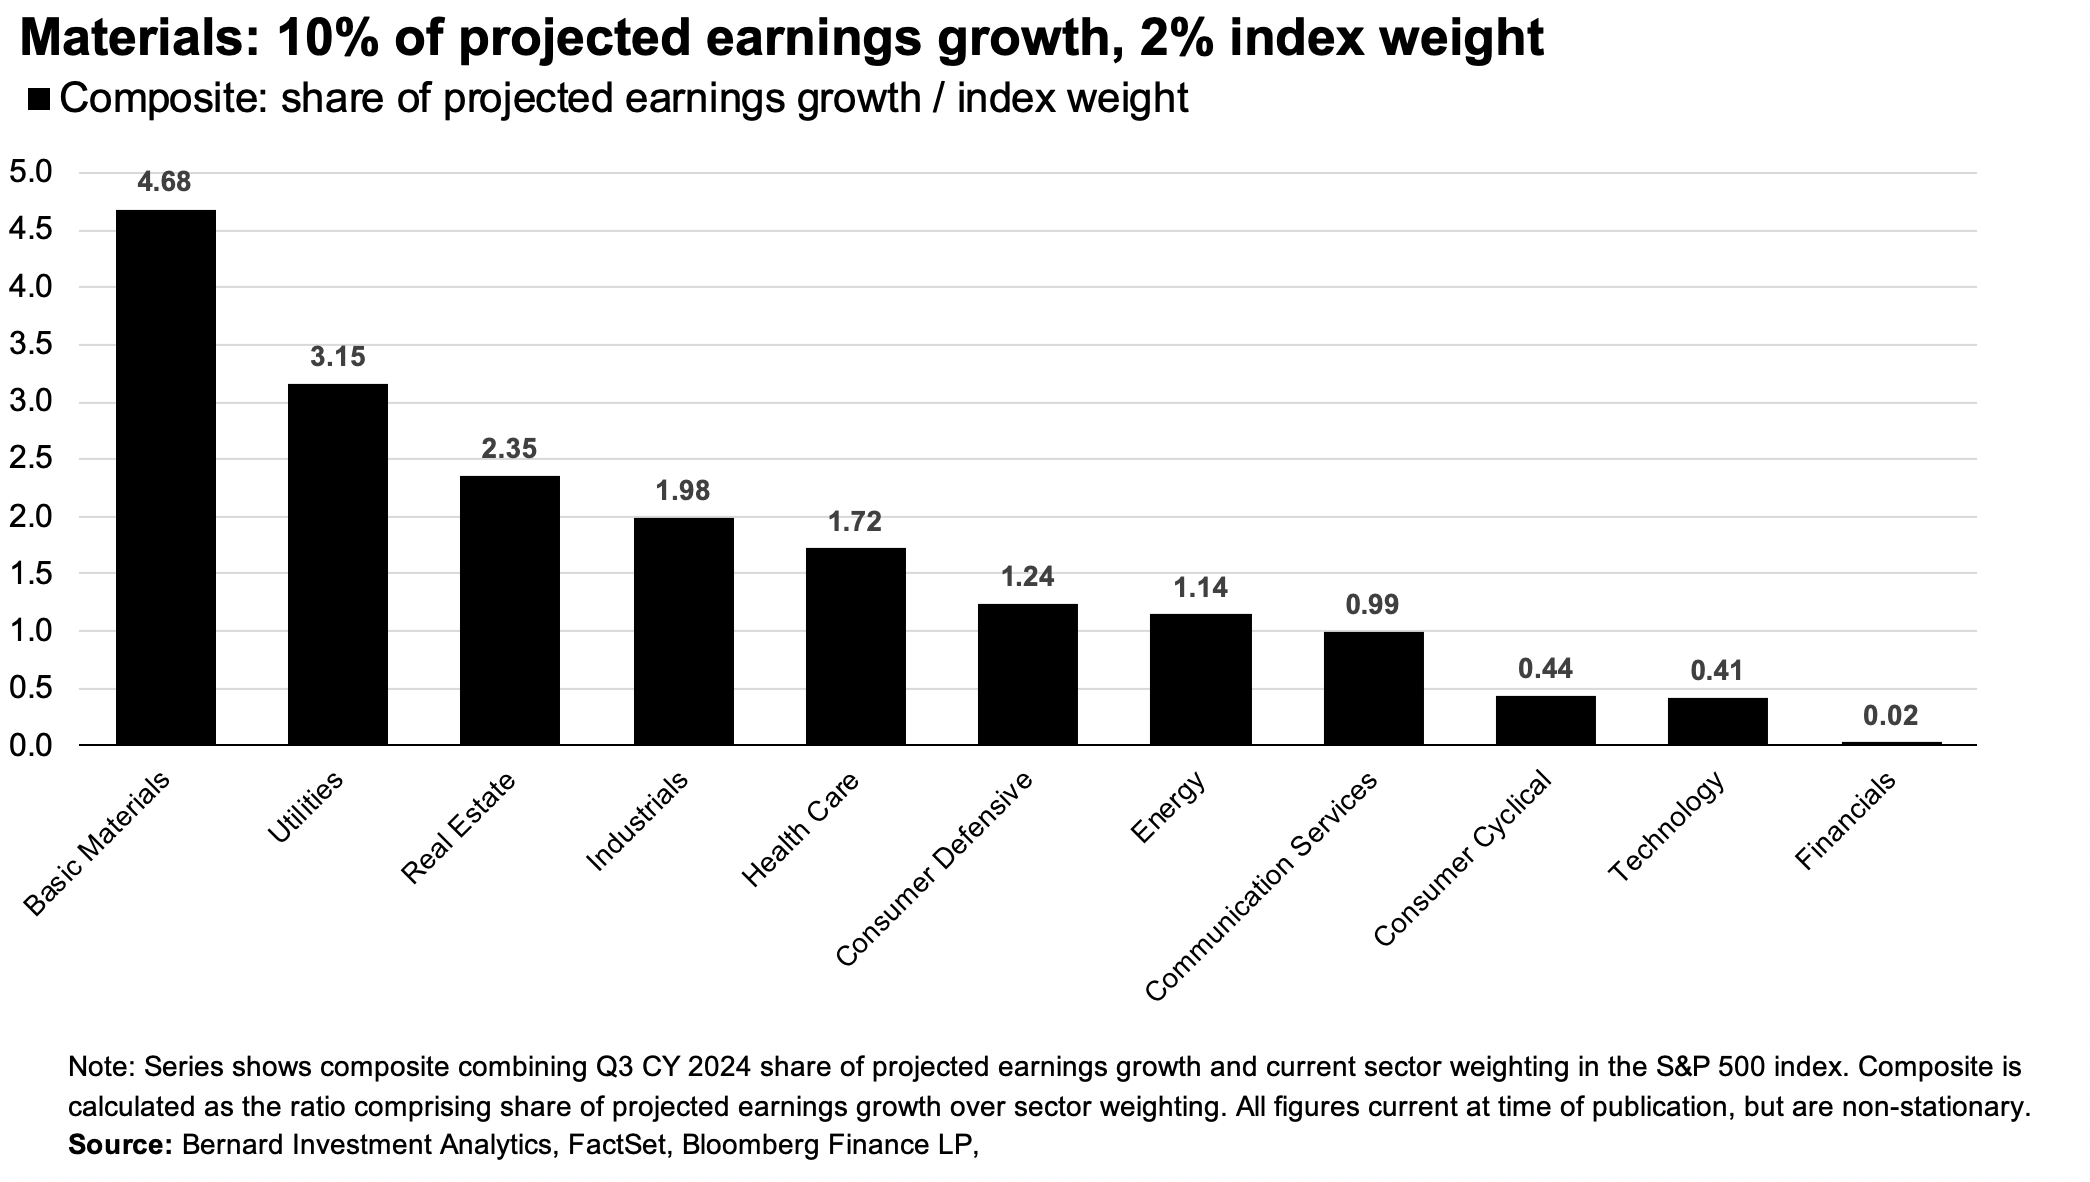
Figure 1a.
Source: FactSet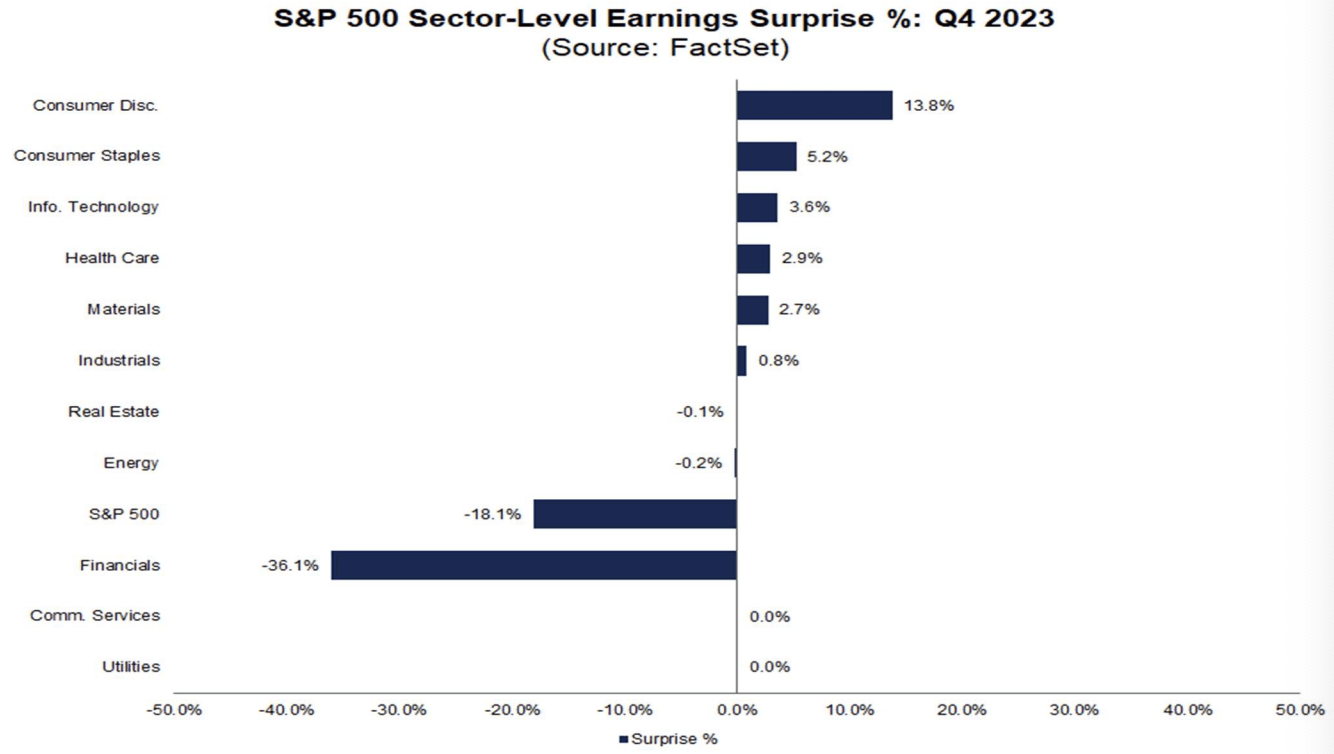
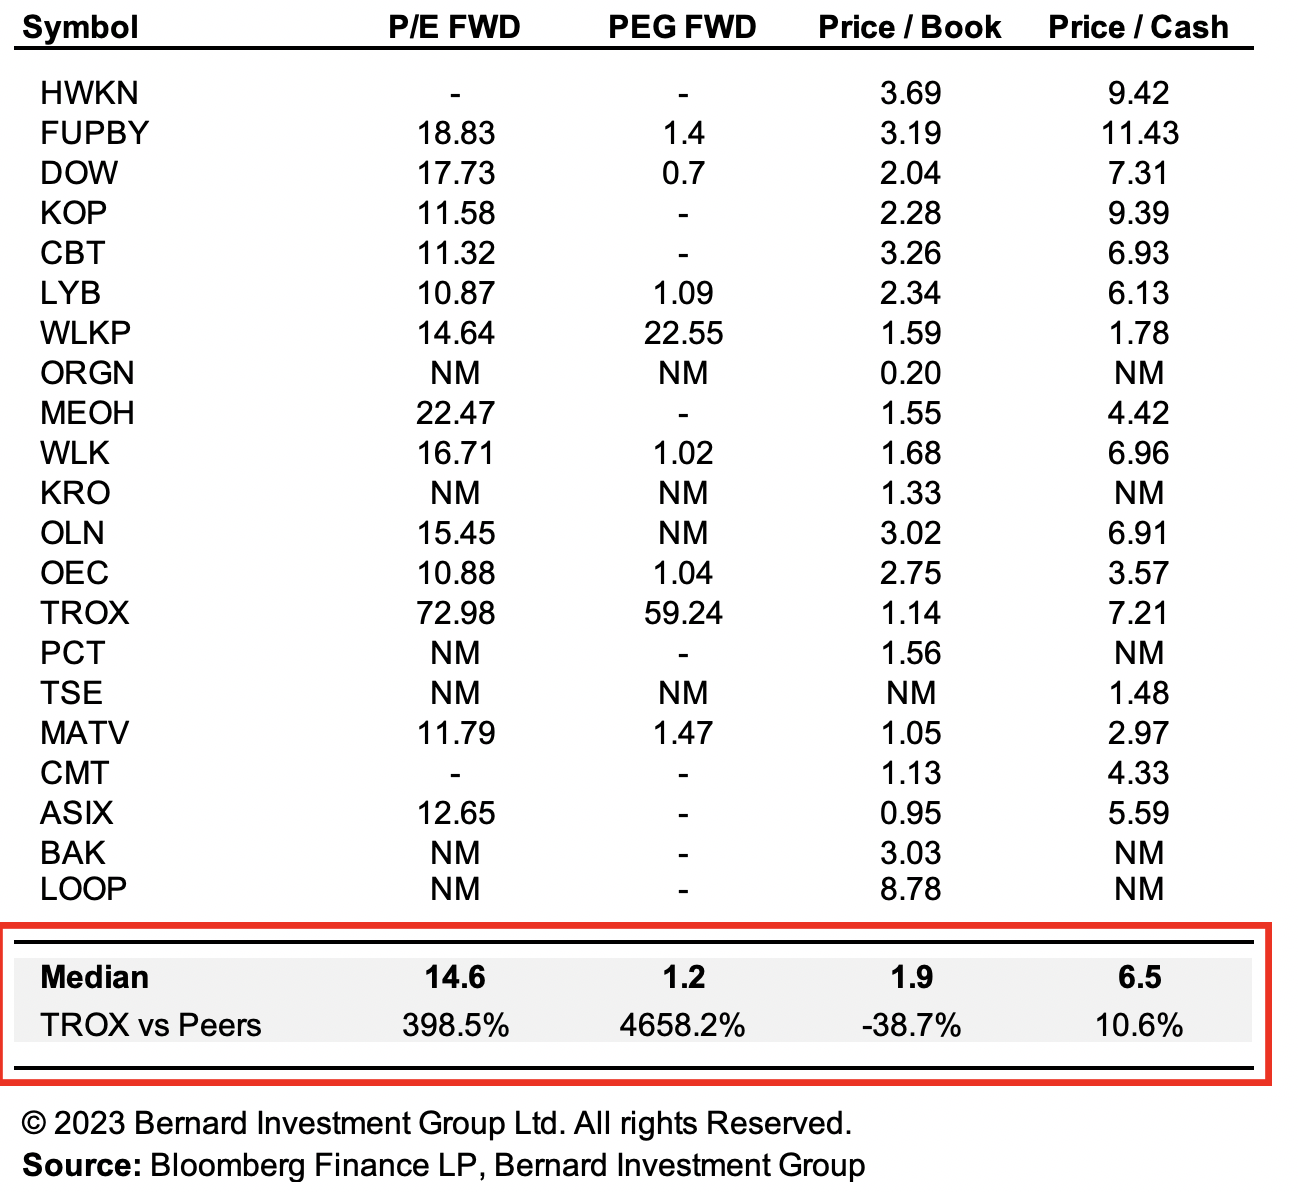
Within the material sector lies the commodity chemicals industry currently trading at 14.6x forward earnings and around 2x book value of equity. For these prices, the industry is paying a 15.4% cash flow yield. Adjusted for earnings growth assumptions, and at current market value relative to earnings, investors are paying $1.24 every $1 in future earnings growth as a median (Figure 2).
Recent outperformance in the equity of Tronox Holdings (NYSE:TROX) since November 2023 has brought the company onto our radar. TROX is manufacturer of titanium oxide (“TiO2”) pigment in the Americas and EMEA.
Titanium dioxide is a naturally occurring oxide of the titanium group, renowned for its remarkable optical and chemical properties, namely, its opacity, durability and UV resistance. Consequently it finds extensive use as a pigment in markets such as paints and coatings, cosmetics, plastics, and so forth.
Research projects the global titanium dioxide market to grow at a compounding annual rate of around 6% to 6.5% over the coming 6 years in to 2030. This is a high-growth industry, therefore. Demand is expected to be driven by heightened consumption of paints and coatings in and markets such as construction, automotive, and fabrication just to name a few.
This report will cover all the moving parts in the TROX investment debate, providing context for investors across all the investment horizons.
Net-net, we rate TROX a hold at $10-$10.50/share on grounds of staring valuations, potential sales + earnings growth, but lacklustre return on incremental capital employed into the business.
Note: The company’s dividend is not discussed here, and bears no impact to our thesis should it change in any meaningful way. It has therefore been excluded from this analysis.
Critical findings supporting hold thesis
The arguments outlining our mutual stands on TROX are outlined in the data points below. Critically, we find there is potential evidence in TROX’s story looking out across a 1-3 year investment horizon.
-
Investment returns 0-12 months
Returns for any public security in the 12 months after purchase most heavily dictated by starting multiples. Those companies priced below peers and on an absolute basis with exceptional fundamentals offer a statistical advantage to the risk reward calculus— being that multiples are tight, the ratio of downside to upside is heavily skewed towards the latter.
In this vein, there are immediate headwinds to TROX’s short term investment returns due to the extensive premium which it trades, in our opinion. The company sells at 73x forward earnings, which adjusts to 60x when folding in forward growth assumptions. It also sells at 1x the book value of its equity, meaning that:
(1). It has created no value of the cost of equity,
(2). No additional market value beyond the equity capital employed into the business.
It should also be noted that these multiples of price to earnings are at meteoric valuations when compared to respective peers as seen in Figure 2. A balancing fact is that TROX producers around 10 percentage points higher cash flow yields at its current market value.
In addition, JPMorgan analysts have lowered their price assumptions on titanium dioxide to around $3,120 dollars per metric ton, down from a previous forecast of $3,350 per metric ton for 2024/25. We are aligned with this view, given the combination of 1) supply chain choking points, and 2) a higher cost of capital within the latest business cycle which may hurt demand for pigment in the short term. Any recovery in the price of titanium dioxide is unlikely in the near term in our opinion due to additional supply coming from China and a weakening of the overall demand cycle.
These are not constructive points to suggest a re-rating to the upside over the coming 12 months, by estimation.
Figure 2.
-
Investment returns 1-3 years
The investment outlook for any corporation over a 1–3 year window is highly dependent on fundamental factors driving the business, in particular (but not limited too) sales and earnings growth.
The points on valuation above become slightly less relevant when looking at this length of horizon (and beyond). Consensus estimates on sales and earnings growth for the company have been reasonably accurate over the last five years to date. After extensively analysing a range of potential scenarios and probabilities, our growth assumptions lead us to similar conclusions as Wall Street for TROX’s growth route.
The Street has the company to grow earnings by 335% in 2024, from $0.20 per share two $0.86 per share. At today’s market value this implies a 16.7x forward earnings multiple. Critically, the street also forecasts another 77% growth in earnings for 2025, justifying 9.4x 2025 earnings at today’s prices.
Factoring in these great assumptions, both numbers and note, you begin to look far more appealing. What’s more is the company is expected to grow top line sales by around 7% – 7.5% over this duration, which is around 100 basis points ahead of the projected growth for the titanium dioxide market. In this scenario TROX would invariably capture additional market share by growing faster than the broader market. Our estimation is that it could also obtain a higher percentage of the profit pool as a result of this.
Therefore we are reasonably constructive on the company over a 1–3 year holding period. The next question stems back to one of opportunity cost. That is, what is the next best opportunity forgone by allocating to TROX, and what returns might be left on the table as a result of this. This requires judgement over a longer-term horizon, as is discussed below.
Figure 3. TROX Revenues, historical & projected
Source: Seeking Alpha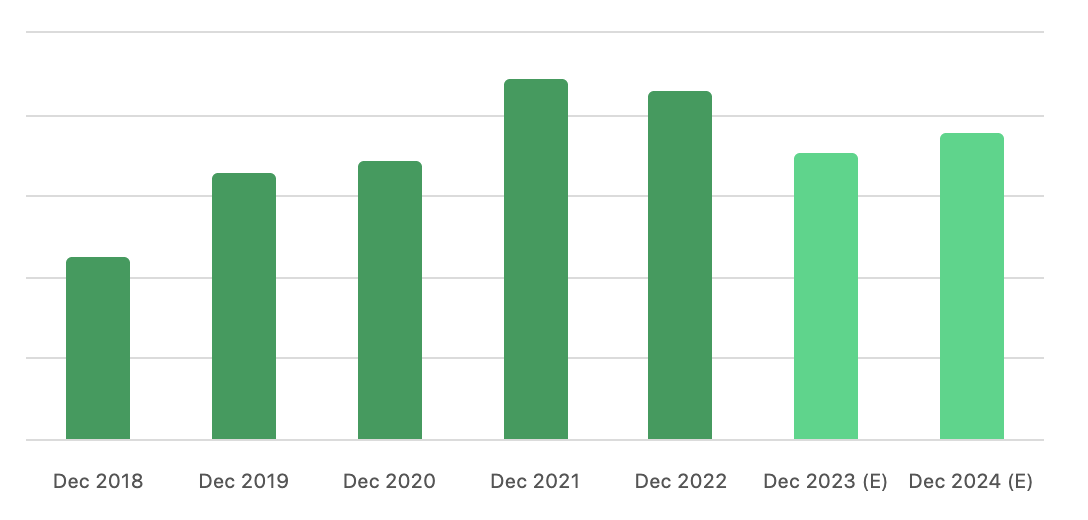
-
Investment returns 3 years+
Thoughtful analysis of a company’s business economics is a sound guiding principle to long-term investing. This encompasses a firm’s ability to (i) allocate incremental capital, to then (ii) produce subsequent growth in earnings as a result of these investments.
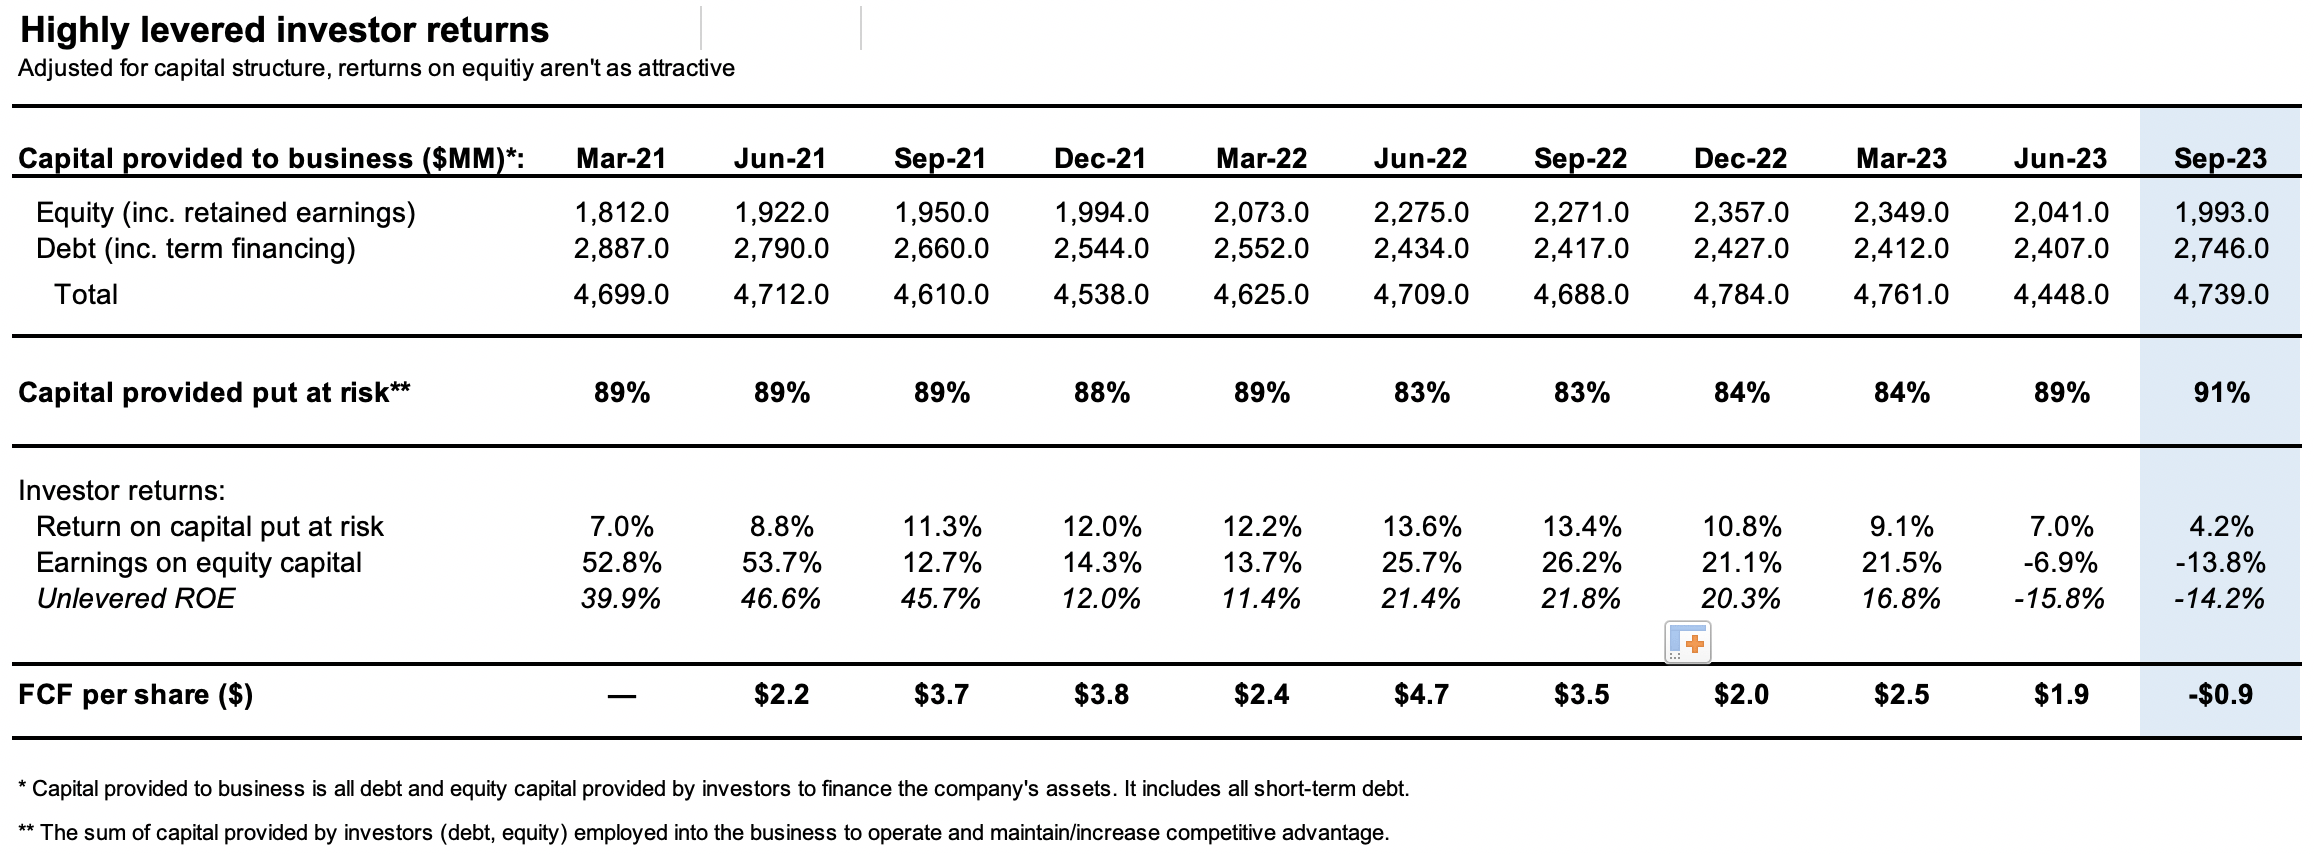
Unfortunately TROX has not excelled in this domain in recent years. Whilst this is in a historical context, it does provides valuable data to draw inferences from moving forward. Notably, the company has put around 90% of the capital provided by investors at risk, with he remainder returned to investors by way of the company’s dividend.
On the capital which has been invested into the business operations the company has produced earnings at a range of 7% to 13.6% return on capital from 2021 – 2023 (TTM values), as seen in Figure 4. This is below long-term market averages of c.12% and unlikely to create shareholder value beyond what investors could reasonably achieved elsewhere by simply riding the equity indices. In TROX’s case, over this time, $1 of capital has been more valuable in the investors hands than in the company’s hands. As far as a litmus test four the creation of shareholder wealth, the company has failed to in our view.
Figure 4.
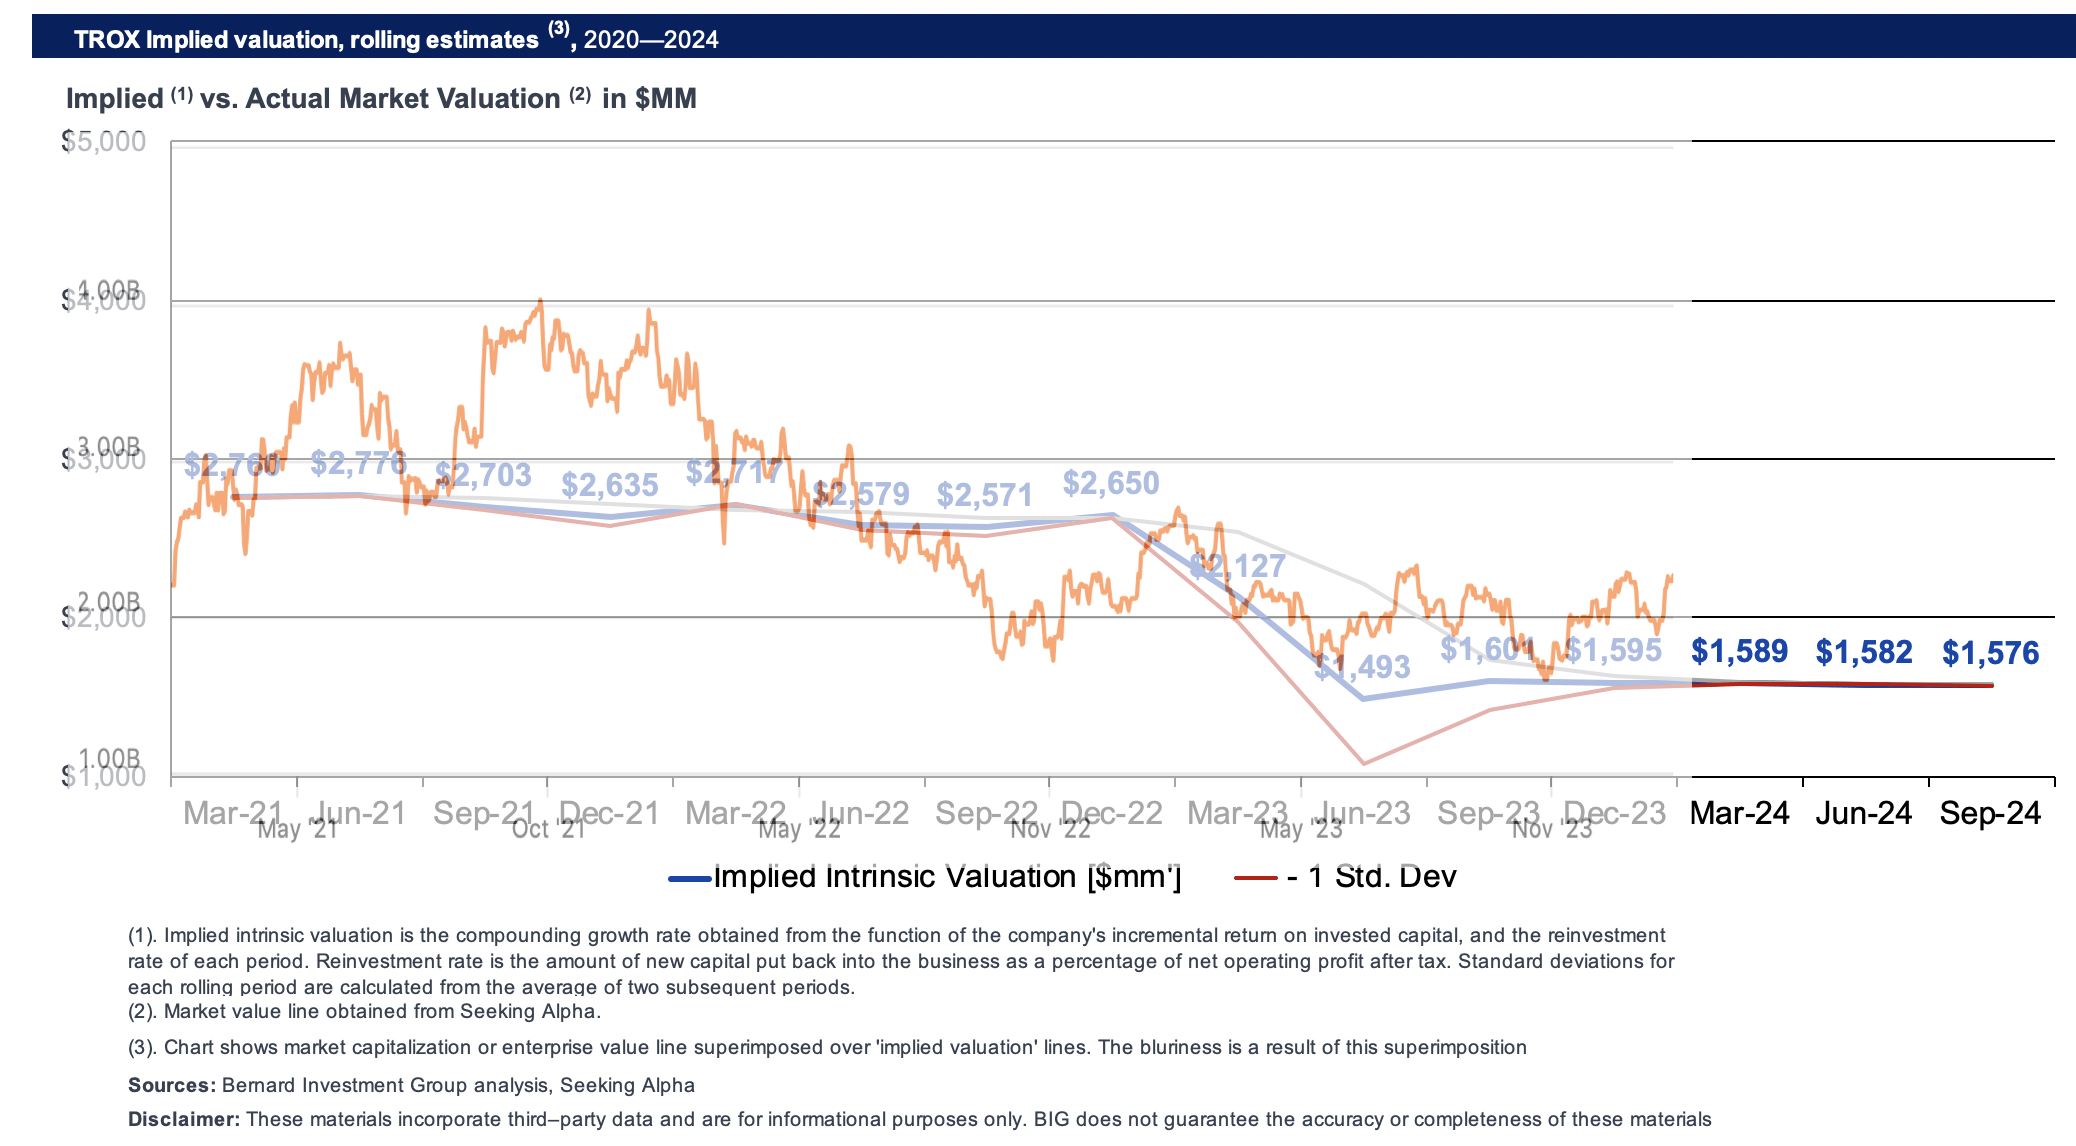
Benchmarking the company’s reinvestment rates and return on invested capital, then compounding its intrinsic value at this function, it appears the market has been a reasonably accurate judge of fair value these last 2–3 years (Figure 5). On an implied intrinsic value basis, it appears the company hasn’t grown its underlying value much beyond the $2.7Bn—$2.8Bn mark. This is evidenced on:
- The company’s current trajectory of growth and earnings, and more importantly,
- It’s allocation of incremental capital and subsequent earnings produced;
We estimate the company its worth around $1.6—$2Bn in market value at the time of publication otherwise $10-$10.50/share. As such, there is no support for a buy rating for long-term holding periods of up to/greater than 3 years.
Figure 5.
Discussion summary
Based on the extensive list of points raised in this report, we are comfortable in rating TROX a hold. The contributing factors include:
- Statistical disadvantage for shorter term holding periods given the tremendously high starting valuations of P/E in the 70s, but no additional market value beyond the equity capital employed in the business at 1x P/book. This makes sense — it hasn’t beaten the hurdle rate on its own business investments.
- Sales and earnings growth is constructive over the next 1–3 years, which is a balancing Factor. Adjusted for earnings growth assumptions, there may be scope to own TROX for those with higher risk appetite, and the tolerance for greater portfolio variance.
- The company produces a low rate of earnings on the capital invested into the business. More over the incremental capital invested into the business has not yielded additional growth in earnings as a result of its placement.
By all measures, we anticipate these trends to continue moving forward, resulting in TROX creating no additional value for its shareholders. In this so we rate TROX a hold.

 Q2 2024 Earnings Call Transcript")

