richcano
Investment Thesis
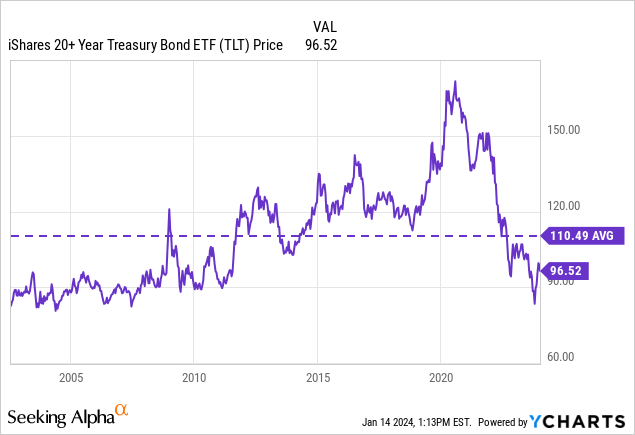
The iShares 20+ Year Treasury Bond ETF (NASDAQ:TLT) has had a tumultuous few years, plunging 50% in less than two years from $160 to $80 before rebounding to $96.52. And while the recent rally has already given investors some decent gains, we believe there is still plenty of upside, particularly relative to the S&P 500 (SPY), which is closing in on all-time highs.
We also believe that although bonds have moved from a secular bull market to a secular bear market, there may soon be room for a final rally. This article discusses the drivers of a recession that we believe will drive this final rally in long-term bonds, which is bullish for TLT in the short to medium term.
The 40-Year Paradigm Shift
Let’s start with the fact that in the credit-driven economy in which we find ourselves today, everything revolves around debt and at what interest rate that debt is currently floating. And over the past 40 years, many important investment decisions have been made based on the 40-year bull market in Treasury bonds that began in the 1980s.
Since the 1980s, interest rates have fallen across the board, steadily and perfectly within the confines of a trading channel if we look at 10- and 30-year rates, for example. During this period, most market participants enjoyed financing at lower rates, from households with mortgages to corporations for their business loans and the U.S. government with the national debt. It is plausible that this mechanism pushed asset prices, including equities, higher and drove investors out on the risk curve in search of higher yields. Since last year, however, this near-perfect bull market seems to have come to an end, as interest rates have soared and broken out of the trend channel.
So now that this 40-year bond bull market has broken out of its trend channel, the question investors may need to ask is whether interest rates will go up rather than down in the next secular cycle. People often expect interest rates to fall and stay low during a recession, as has been the case for the past 25 years. But as Mark Twain’s famous quote goes:
“It ain’t what you don’t know that gets you into trouble. It’s what you know for sure that just ain’t so. “ – Mark Twain
TradingView, Wright’s Research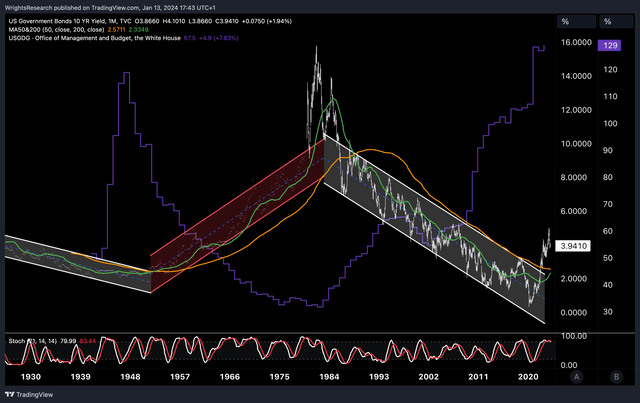
While many asset investors have expected interest rates to be lower in the long run, as they have been for decades, this mechanism that has lifted asset prices may be coming to an end as funding costs appear to be heading north. Therefore, the above chart of the 40-year bull market trend, which we believe is coming to an end, may be the most important chart of the year.
Ultimately, interest rates dictate the time value of money or discount rates. And because the U.S. Treasury market is the largest financial market in the world when it comes to bonds, it dictates everything from mortgage rates in the housing market to corporate spending, government spending, and the financing of personal spending. Like billionaire bond investor Jeffrey Gundlach would say:
When you’ve been around for 40 years you think you’ve learned stuff, right? You think that you understand relationships. You can tap into your experience and how things interrelate and act. But what if your experience is all informed by a secular Trend that isn’t in place anymore? (-Jeffrey Gundlach)
One thing to consider when looking at long-term interest rates is the amount of debt that is currently in the system. From a U.S. government debt perspective, the debt-to-GDP ratio is at an all-time high of about 120%, which is the highest it has been since 1946, right after World War II. And if we were to take into account other sources of debt, such as household and corporate debt, we would get to 350% of GDP.
So if we take into account the amount of debt in the system, both public and private debt, we really have a Volcker-like spike this time around. As you can see in the chart below, the 10-year rate also fell as the total debt to GDP ratio rose from 150% to 350%.
Real returns, or inflation-adjusted returns, have also fallen over the past 25 years, which we also think is reasonable given the rise to 350% debt to GDP. Only in recent months have real yields on the 10-year treasury closed above 2% for the first time since 2008, which we would consider extremely regressive.
An economy with very high debt and at the same time high real rates of return should mean that the amount of wealth transferred from borrowers to lenders is immense and, in our view, puts enormous pressure on the economy. This may not be a problem for large companies like those that make up the “Magnificent 7” because they have large cash reserves on their balance sheets to weather bad economic times.
But smaller companies that employ a large portion of the workforce are certainly starting to feel it. Some notorious companies that have already gone bankrupt in this high interest rate regime include WeWork (OTC:WEWKQ), Bed Bath & Beyond (OTCPK:BBBYQ), Rite Aid (OTC:RADCQ), and numerous SPACs. According to the NFIB, the average short-term interest rate for small businesses is about 9.8%, while on a relative scale, interest rates are at the most restrictive level they have been in decades.
National Federation of Independent Business (NFIB)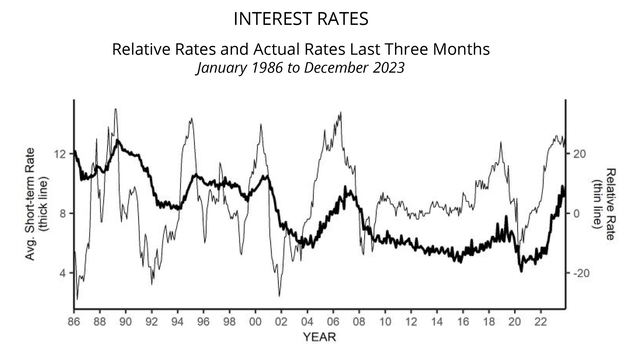
In July 2021, the yield on 30-year TIPS, or Treasury Inflation Protected Securities, hit a low of -1.67%. This is while investors can currently lock in a 30-year inflation-protected yield of nearly 2%, the highest yield in roughly two decades. Like the current yield on 30-year Treasuries, we believe TIPS is currently a bargain in a period of uncertainty about future growth and inflation.
From our perspective, we would like to believe that we could be in a secular bear market for Treasuries with rising rates. But even if that were the case, we think the current rise in long-term rates is far too steep. For context, the 50% drop in the bond market through last year was the worst in history or the worst year since 1871.
These are the same levels of extreme declines seen in stocks during a severe recession, even though bonds are supposed to provide protection in a traditional 60/40 portfolio. This type of portfolio, and especially a leveraged version of the portfolio, performed extremely poorly in 2022 and 2023, suffering losses similar to 2008 and 2000, largely due to losses in long-term bonds.
60/40 Bond Portfolio Drawdown (Highcharts)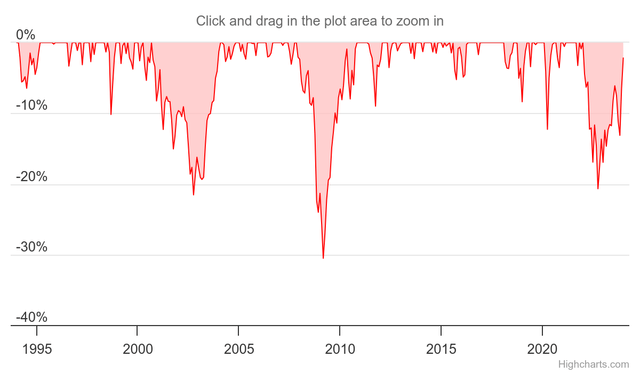
The notion of higher bond yields without a meaningful reduction in the level of debt in the economy is again problematic on a number of levels, particularly on the fiscal front. After all, the last time government debt was this high relative to GDP, starting after World War II and ending with Volcker in the early 1980s, the United States reduced its debt burden from 120% of GDP to just 30% at its low point in the 1970s.
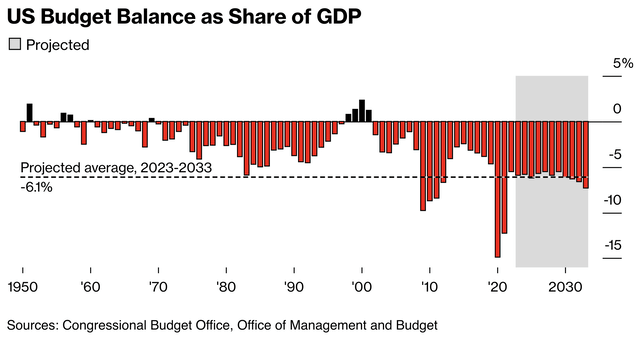
They did this initially by keeping interest rates low after World War II, even though there was rampant double-digit inflation for several years. In the decades that followed, the U.S. also showed fiscal restraint with budget surpluses or only very small deficits. This is very different from today, where we see high interest rates, and high debt, and are running budget deficits similar to the ones we saw during the 2008 financial crisis.
Higher For Longer?
Which brings us to the point that the mantra of “higher for longer” presents some serious underlying problems. First, interest expense on the federal government’s $32.3T worth of debt is currently $981.31BN, or just over 3%. Second, the average maturity of this debt is about 72 months or 6 years. Adding the debt on the Fed’s balance sheet, it is more like 53 months.
So in the next 36 months, about half of that $32.3T will have to be refinanced at higher interest rates, and since some of that debt was financed at extremely low interest rates in 2021, interest payments should continue to rise significantly. If interest rates really stay “higher” for longer, say at 5%, the US would pay nearly $1.62 billion in interest charges on that debt, on top of the current, already immense $981.31 billion in interest charges.
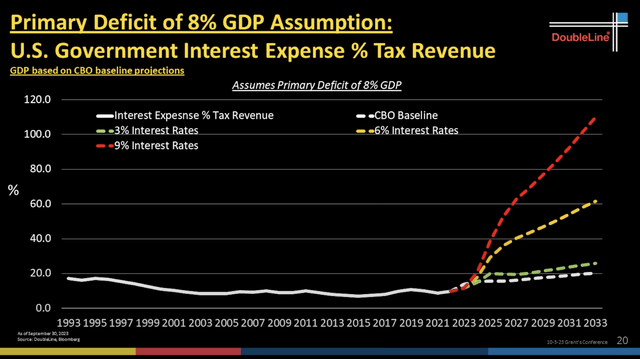
Billionaire bond investor Jeffrey Gundlach recently did the math and took the Congressional Budget Office (CBO) estimates, which include an assumption of a 4% deficit, and looked at what interest costs look like at a 6% interest rate. According to these estimates, in 10 years, more than 40% of tax revenues could go to interest costs alone. And since mandatory spending makes up 60-70% of the budget, this would mean that there would be virtually no budget left for discretionary spending like defense.
Since we also think a recession is likely, we would not be surprised if the deficit is actually larger and closer to 8%, at which point with an interest rate of 6%, about 60% of tax revenue would go to interest expenses, which would be a huge problem. After all, the deficit as a share of GDP was already 6.3% in 2023, when the US was not even in a recession.
Even the CBO itself acknowledges this fiscal doom loop and predicts that deficits are unlikely to decline over the next decade. When interest rates were near 0%, this fiscal spending was possible because interest costs did not yet seem to be a problem. It does appear that the market has recently slowed fiscal spending with a return of bond vigilantes after the inflationary surge in 2022.
Our biggest concern would be that during the next recession, the fiscal impulse would be so great that the resulting inflationary impulse would actually confirm the thesis that long-term bond yields are moving higher. And longer higher would mean that we would have a huge interest rate problem, as outlined earlier.
One Last Rally
Therefore, before bonds enter a bear market from their 40-year secular bull market, our view is that there will be a final rally in the next recession. Many indicators that we see popping up still point toward a recession, probably within the next few quarters.
One of them, for example, is the yield curve, which is turning away after being inverted for a long time, which previously always pointed to a recession. The 2-year 10-year spread has shrunk from -1.06% in June 2023 to -0.21% already. We only expect the Federal Reserve to be reactive rather than proactive if a recession is imminent, and to cut interest rates sharply if unemployment rises for reasons previously mentioned and while interest rate delays work through the system. On Friday, the 2-year 30-year treasury spread even un-inverted, which we believe is another signal that a recession is forthcoming in the coming quarters.
Consumption has held up so far, although consumer confidence is still low, and both the personal savings rate and total personal savings are also at very low levels, lower than the 2010-2020 baseline. Consumer revolving credit, such as credit cards, is at a record high and has actually risen above the previous trend line, despite all the fiscal stimulus in 2020 and 2021 and even while interest rates have risen to record levels. Hence, we are not so sure that consumer spending is on a healthy path because we think consumers have not yet run out of spending power due to being credit-driven and spending at the expense of personal savings.
Taking the above data into account, we think the long bond has the chance for a final rally, with TLT returning to at least $120 in the short to medium term. This would put the average yield to maturity on TLT around 3%. This is also consistent with a technical perspective, where we think the 30-year bond is still oversold. At a 3% yield on the 30-year bond, we would be back in the middle of the trading range and out of the oversold territory the bond is currently in. We think this is just the beginning of a pullback after the huge rise from 1.7% in January 2022 to 5.16% within 24 months. A rise from $96.52 to $120 still represents an upside of 24.33% from current prices.
TradingView, Wright’s Research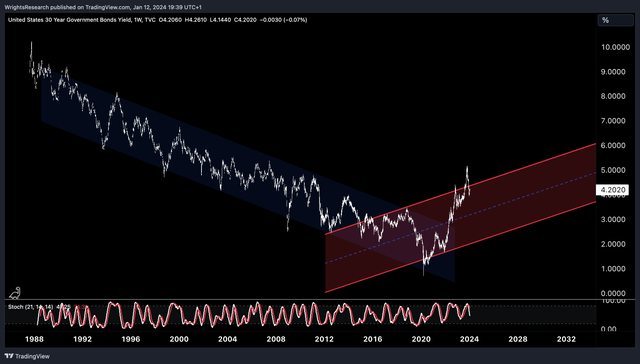
The Bottom Line
While bonds in the big picture may be going “higher for longer” as bond vigilantes look to control fiscal spending, we currently think a recession and lower interest rates are still the base case scenario for 2024. The sell-off in the long-bond, which has given investors a 50% loss from peak to trough over the past 2 years, is still demonstrably overextended and should continue to rally, in our view.
With a 40% drop from all-time highs, we would much rather buy long-bonds than the S&P 500, which we believe is currently seriously overvalued in the wake of a recession with a Shiller P/E ratio of 32.21 and a normal P/E ratio of 25.97 for the 12 months ahead. In our opinion, any pullback from here should be seen as an opportunity to increase exposure to long bonds.
