I’m not an “I told you so” guy, but I told you so!
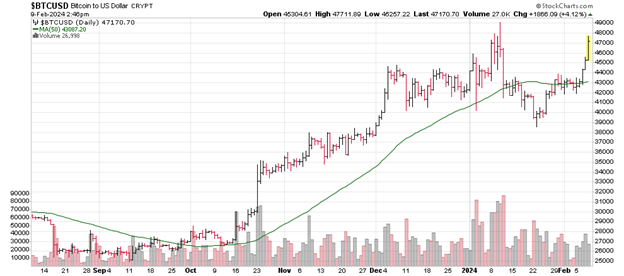
Check your Bitcoin charts. The cryptocurrency is rallying more than 5% this morning, and it all comes down to the chart we’ve been talking about over the past two weeks.
OK, if you want to dig into the internet, some are pointing to the Chinese Zodiac Calendar as the reason that Bitcoin is taking off this morning. FALSE!
It sounds cool, so here it is. Over the next few days, the Chinese Zodiac switches to the “Year of the Dragon.” The Dragon is seen as one of the most prosperous animals of the calendar… so everyone is front-running the Dragon.
Here’s a better and more reliable explanation.
We expected to see a “sell the news” move after the recent approval of the Bitcoin ETFs. That price action resulted in a perfect test of the cryptocurrencies 50-day moving average.
Remember, the 50-day moving average is the best technical trendline in terms of representing the simple rule of trading… “the trend is your friend.” After taking a rest, supported by the friendly trend, Bitcoin is now ready to continue its ascent higher.
How high?
$49,000 is the next hurdle for Bitcoin as this is the high that we saw right before that “sell the news” move. A break above that level will next target $55,000, 21.72% higher than its closing price last night.
Bottom Line
This is just the beginning of the rally. I got the opportunity to speak with James Altucher this week and his forecast for Bitcoin and a handful of AI stocks makes 21% look like chump change. We’re working to get that interview to you early next week.
Until then, I’m maintaining the Grayscale Bitcoin Trust (GBTC) and Cathie Wood’s Ark Fund Bitcoin ETF (ARKB) as position to benefit from the short- and long-term rally in Bitcoin.
By submitting your email address, you will receive a free subscription to Money Morning and occasional special offers from us and our affiliates. You can unsubscribe at any time and we encourage you to read more about our Privacy Policy.
About the Author
Chris Johnson (“CJ”), a seasoned equity and options analyst with nearly 30 years of experience, is celebrated for his quantitative expertise in quantifying investors’ sentiment to navigate Wall Street with a deeply rooted technical and contrarian trading style.


