metamorworks
Most companies generate the vast majority of their revenue from providing goods and services to either other businesses or consumers. There are plenty of companies that do some of both. But those aren’t the only two customer groups out there. One major customer would be government agencies. And there are plenty of businesses, most of which are involved in defense, research, or other types of technology, that cater to these types of customers. Few of the players in this market are as large or as well-known as Science Applications International Corporation (NASDAQ:SAIC).
In recent years, financial performance achieved by Science Applications International has been a bit mixed. Revenue has been a bit lumpy, while profits have risen nicely. But when you look at other profitability metrics, all you see is weakness. Despite this, shares can only become so cheap before they make sense to consider buying into. And after seeing its share price drop 9.3% on March 18th after news broke regarding fourth quarter earnings and guidance for 2025, now might be just the time for investors to consider taking a stake in the business.
A look into Science Applications International
I was first made aware of the existence of Science Applications International a couple of years ago when a book titled The SAIC Solution: How We Built an $8 Billion Employee-Owned Technology Company was recommended to me. The author, John Robert Beyster, founded the company in 1969. From its humble origins, the company has grown into a behemoth in terms of sales. And while the firm that exists today is significantly different from what its founder imagined, it has undeniably been a success. Operationally, the firm serves customers through the roughly 1,900 active contracts and task orders that it has available, and it does so with an army of roughly 25,000 employees.
Over the years, management has positioned the company as a provider of “technical, engineering, and enterprise information technology solutions” and it provides these offerings to all branches and agencies of the Department of Defense. It also services NASA, the US Department of State, the Department of Justice, the Department of Homeland Security, And multiple unnamed intelligence community agencies. Specific offerings provided center around engineering, technology integration, IT modernization, maintenance of ground and maritime systems, logistics, training, and more.
A complicated picture
Author – SEC EDGAR Data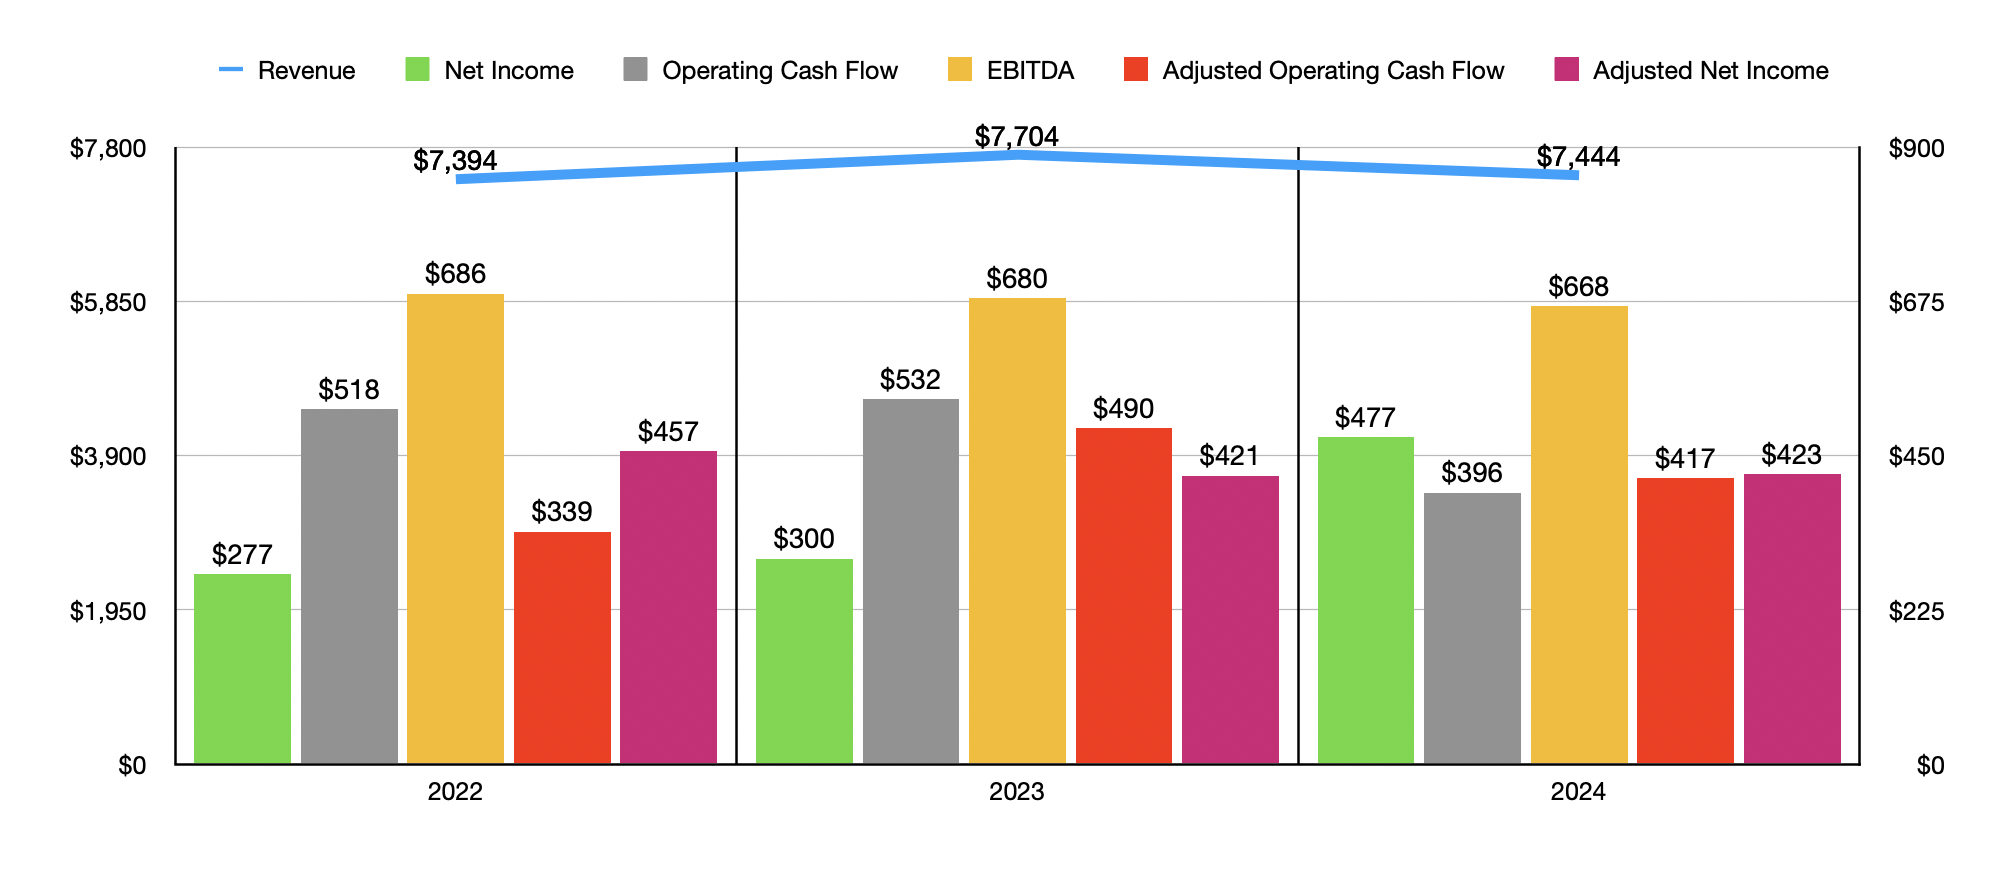
Over the past three years, the financial performance achieved by Science Applications International has been rather mixed. Revenue, for instance, went from $7.39 billion in 2022 to $7.70 billion in 2023.
Management just announced financial results for the final quarter of the 2024 fiscal year. And for the year as a whole, revenue came in at $7.44 billion. It is worth noting, however, that we should take into consideration various moves made by the company. As an example, during the 2023 fiscal year, the company saw a decline in revenue totaling $637 million as a result of divestiture activities. It also had other adjustments totaling $135 million. If we adjust for this, organic revenue for the firm would have risen consistently over this three-year window of time.
Science Applications International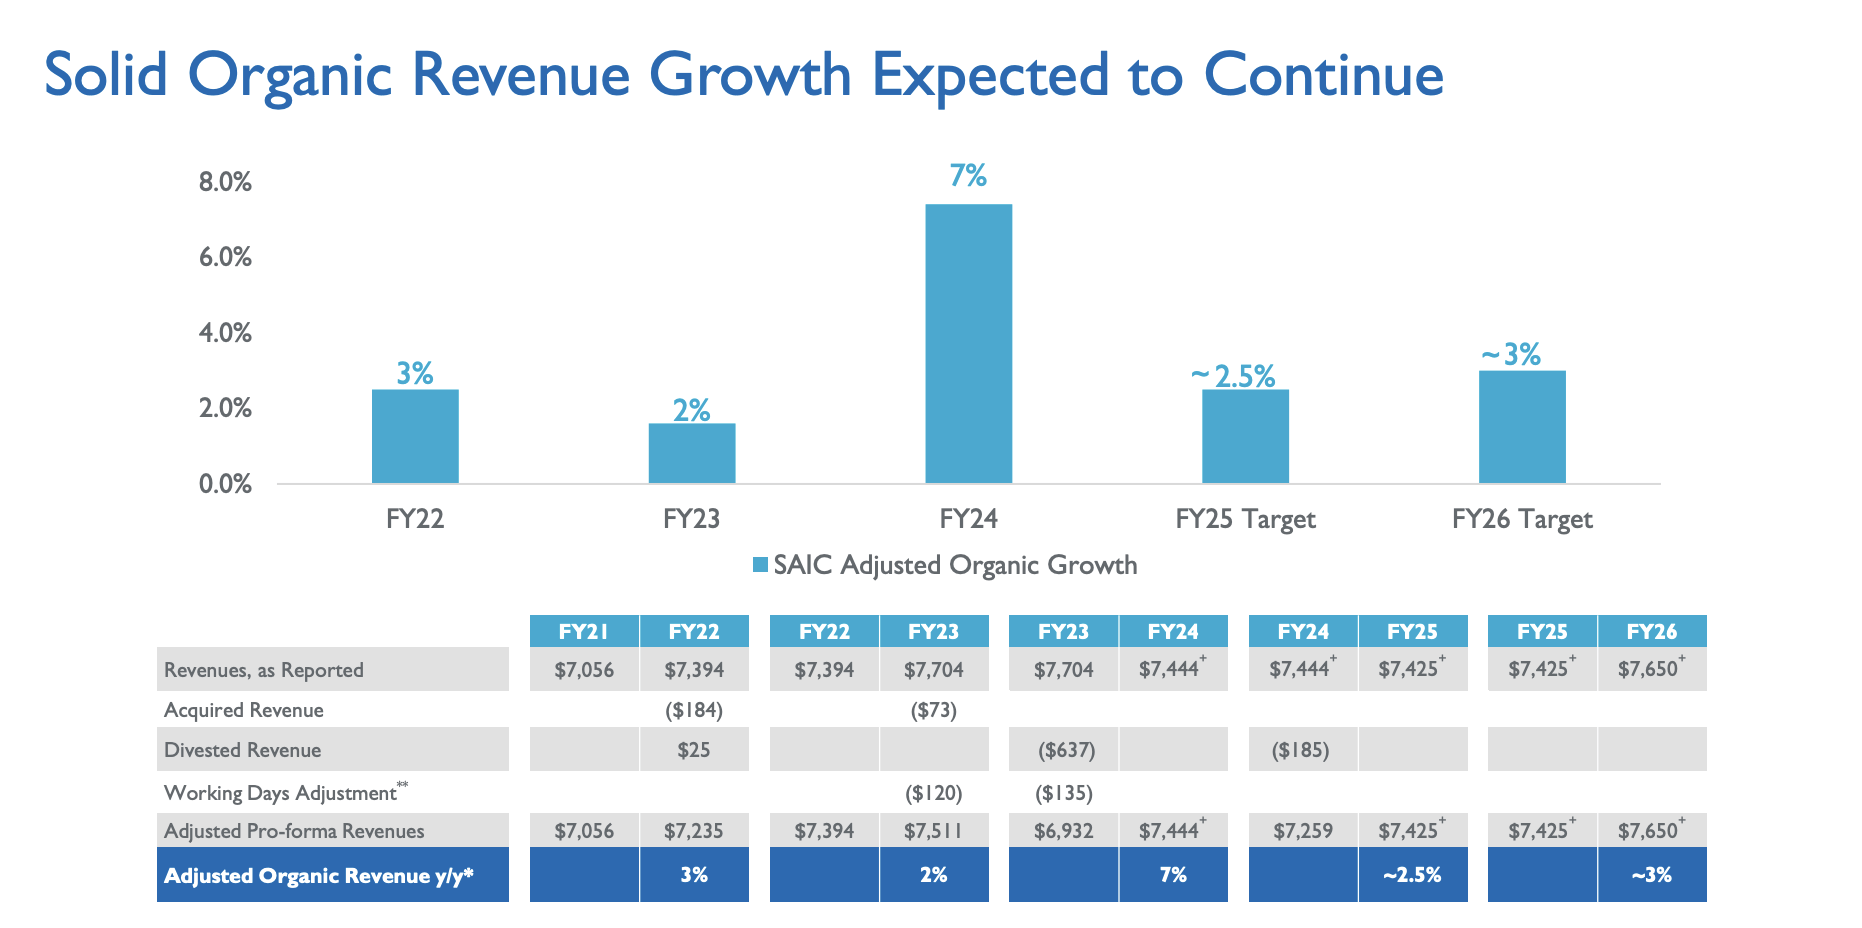
On the bottom line, the picture gets far more complicated. Net income actually rose nicely from $277 million in 2022 to $477 million in 2024. But a lot of this is a mirage. To be clear, the company did benefit from some major improvements. Cost of sales, for instance, dropped from 88.5% of revenue to 88.3%. Although this may not sound like much, when applied to the revenue generated in 2024, this would translate to an extra $22 million on the bottom line. However, the single biggest contributor to its bottom line expansion from 2023 to 2024 was a $240 million gain on divestitures. This involved the sale of the company’s Supply Chain Business in exchange for $356 million in cash.
Once we make certain adjustments to bottom line results, we see a very different story. On an adjusted basis, net profits dropped from $457 million back in 2022 to $423 million in 2024. Fortunately, the 2024 numbers were slightly higher than what was seen in 2023, so there is some evidence of stability developing. Other profitability metrics, however, have also seen downward pressure. Although operating cash flow has been all over the map, it has dropped from $518 million to $396 million. But once we adjust for changes in working capital, we get a consistent year-over-year decline from $539 million to $417 million. Meanwhile, EBITDA for the business fell from $686 million to $668 million.
Author – SEC EDGAR Data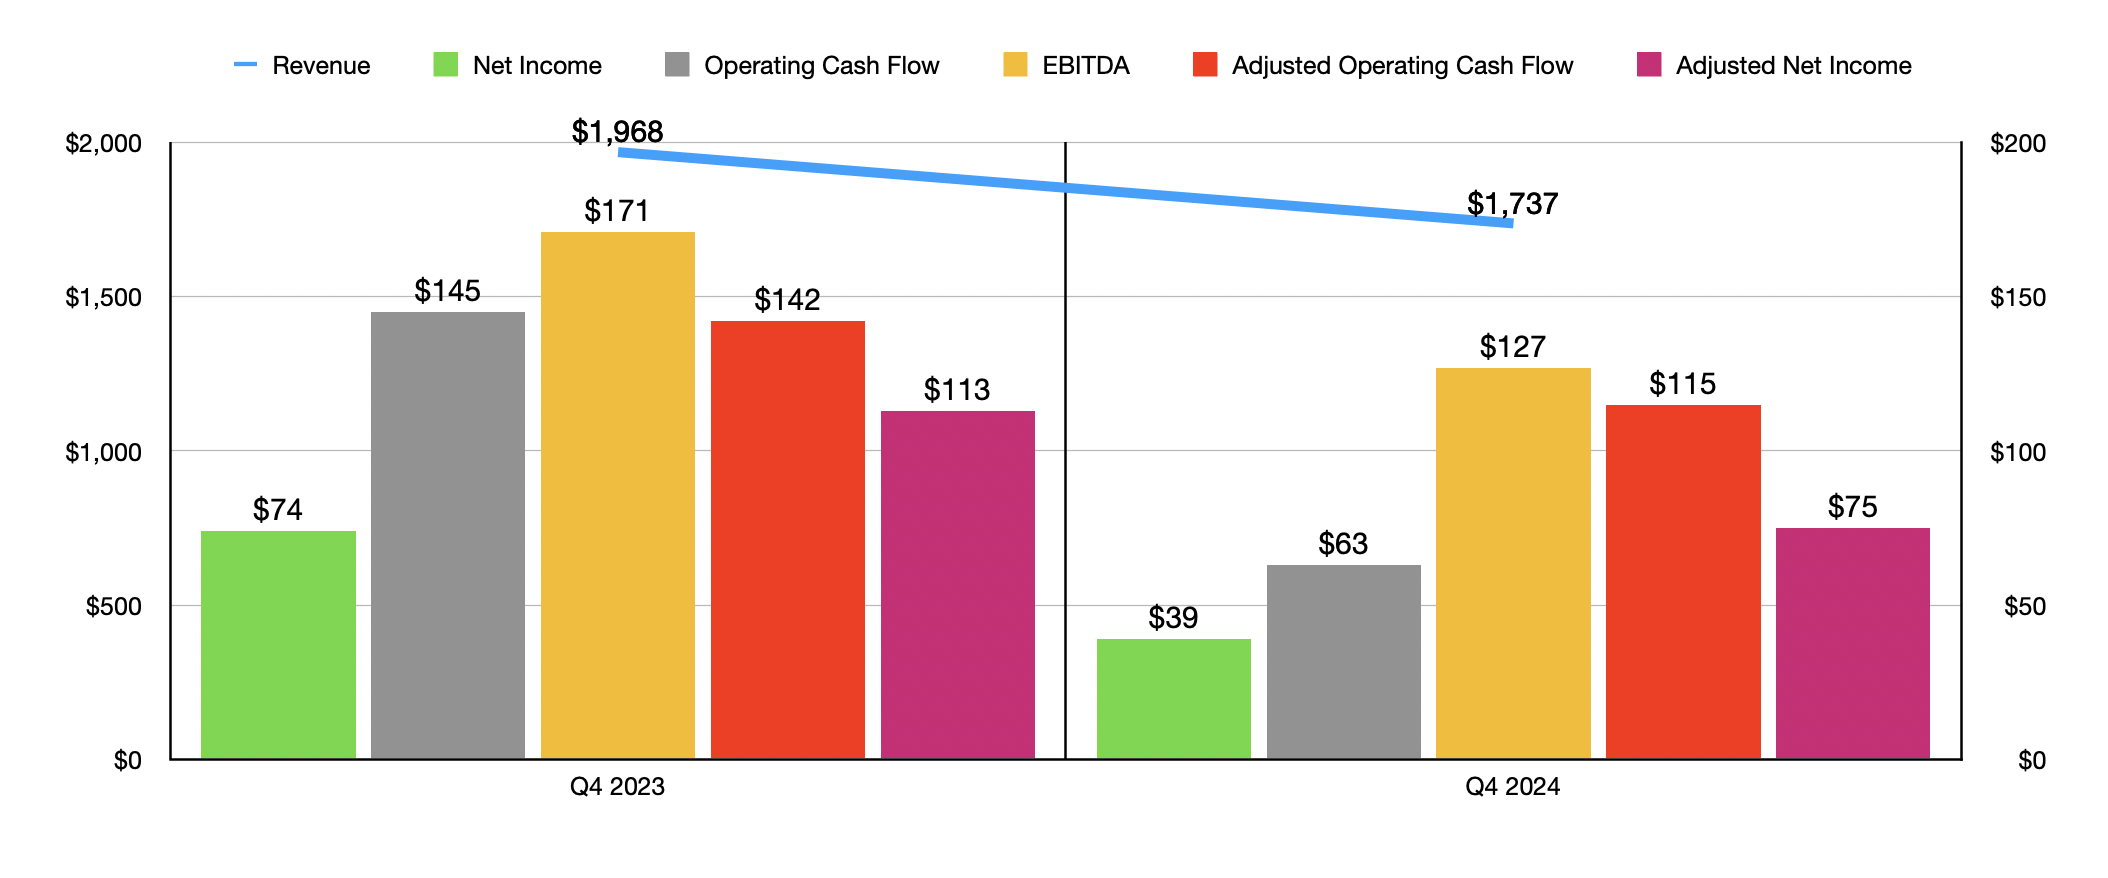
Unfortunately for those who hold the stock, but perhaps fortunately for those who do not yet own it but want to, SAIC shares plunged on March 18th, trading down around 9.3% as of this writing. This move lower was in response to the results that management reported for the final quarter of 2024. Revenue, for instance, came in at $1.74 billion. This represents a decline of 11.7% from the $1.97 billion reported one year earlier. However, it did manage to come in about $100 million above what analysts had forecasted.
Despite the decline, the firm actually reported an increase in sales of about 7.7% on an organic basis. The aforementioned asset sale, combined with some other adjustments such as five additional working days in the prior year and the deconsolidation of a joint venture that it had, all need to be stripped from the equation to get organic revenue.
On the bottom line, the picture was painful. Management reported profits per share of $0.74. This was down materially from the $1.34 reported one year earlier and it fell short of analysts’ expectations by $0.42 per share. Even if we make certain adjustments, the company reported profits of $1.43. That was materially lower than the $2.04 per share reported the same time one year earlier, and it fell short of analysts’ expectations by $0.01 per share. This translated to net profits declining, on an adjusted basis, from $113 million to $75 million. The decline in adjusted profits was driven by higher expenses associated with selling, general, and administrative activities, as well as by a reserve on a customer receivable that was associated with the program that was completed prior to the 2022 fiscal year. Increased stock compensation came about because of an acceleration of stock grants because of some reorganization activities the company engaged in, as well as because of some reshuffling of the top brass at the enterprise.
Other profitability metrics followed suit. Operating cash flow dropped from $145 million to $63 million. On an adjusted basis, it fell from $142 million to $115 million. And lastly, EBITDA for the business declined from $171 million to $127 million.
Author – SEC EDGAR Data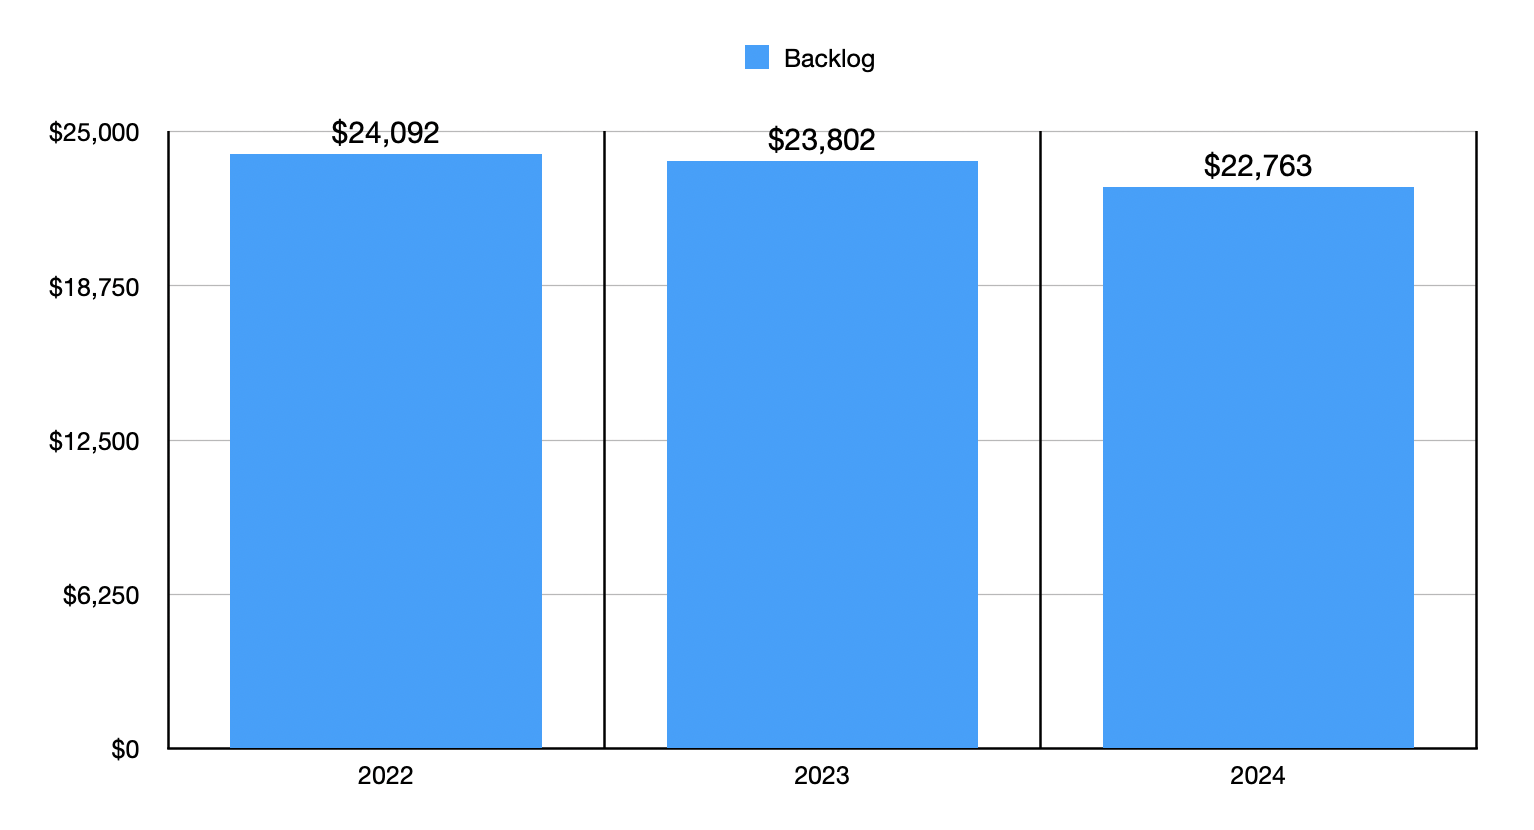
After looking at all of these financial results, I was tempted to take a more cautious approach to the enterprise. This is because, in addition to these pain points, the business has also reported a decline in backlog over the past few years. Backlog has gone from $24.09 billion in 2022 to $22.76 billion in 2024. However, I am feeling a bit more optimistic because management is working hard on making bottom line improvements.
Consider, for instance, current guidance for the 2025 fiscal year. Management expects revenue to come in at between $7.35 billion and $7.50 billion. At the midpoint, that would be lower than the $7.44 billion reported for 2024. On the other hand, the firm is expecting adjusted earnings per share of between $8 and $8.20. That would translate to adjusted profits of $427 million at the midpoint. That’s $10 million above with the company generated in 2024.
Science Applications International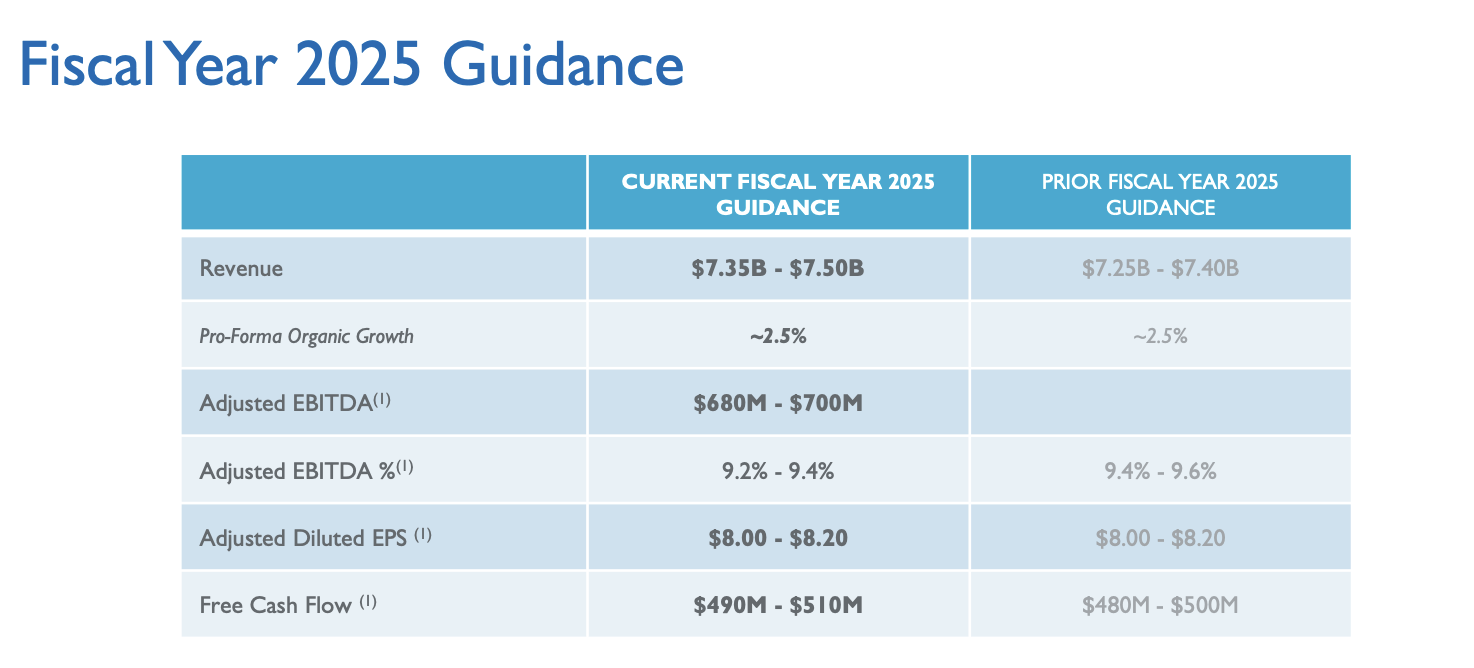
This isn’t the only improvement anticipated for the bottom line. Operating cash flow is forecasted to be between $520 million and $540 million. If it comes in at the high end of that range, it would be the highest that the business has seen in at least four years. Meanwhile, EBITDA is expected to total between $680 million and $700 million. At the midpoint, that would be slightly higher than what the company achieved in any of the past three years.
Author – SEC EDGAR Data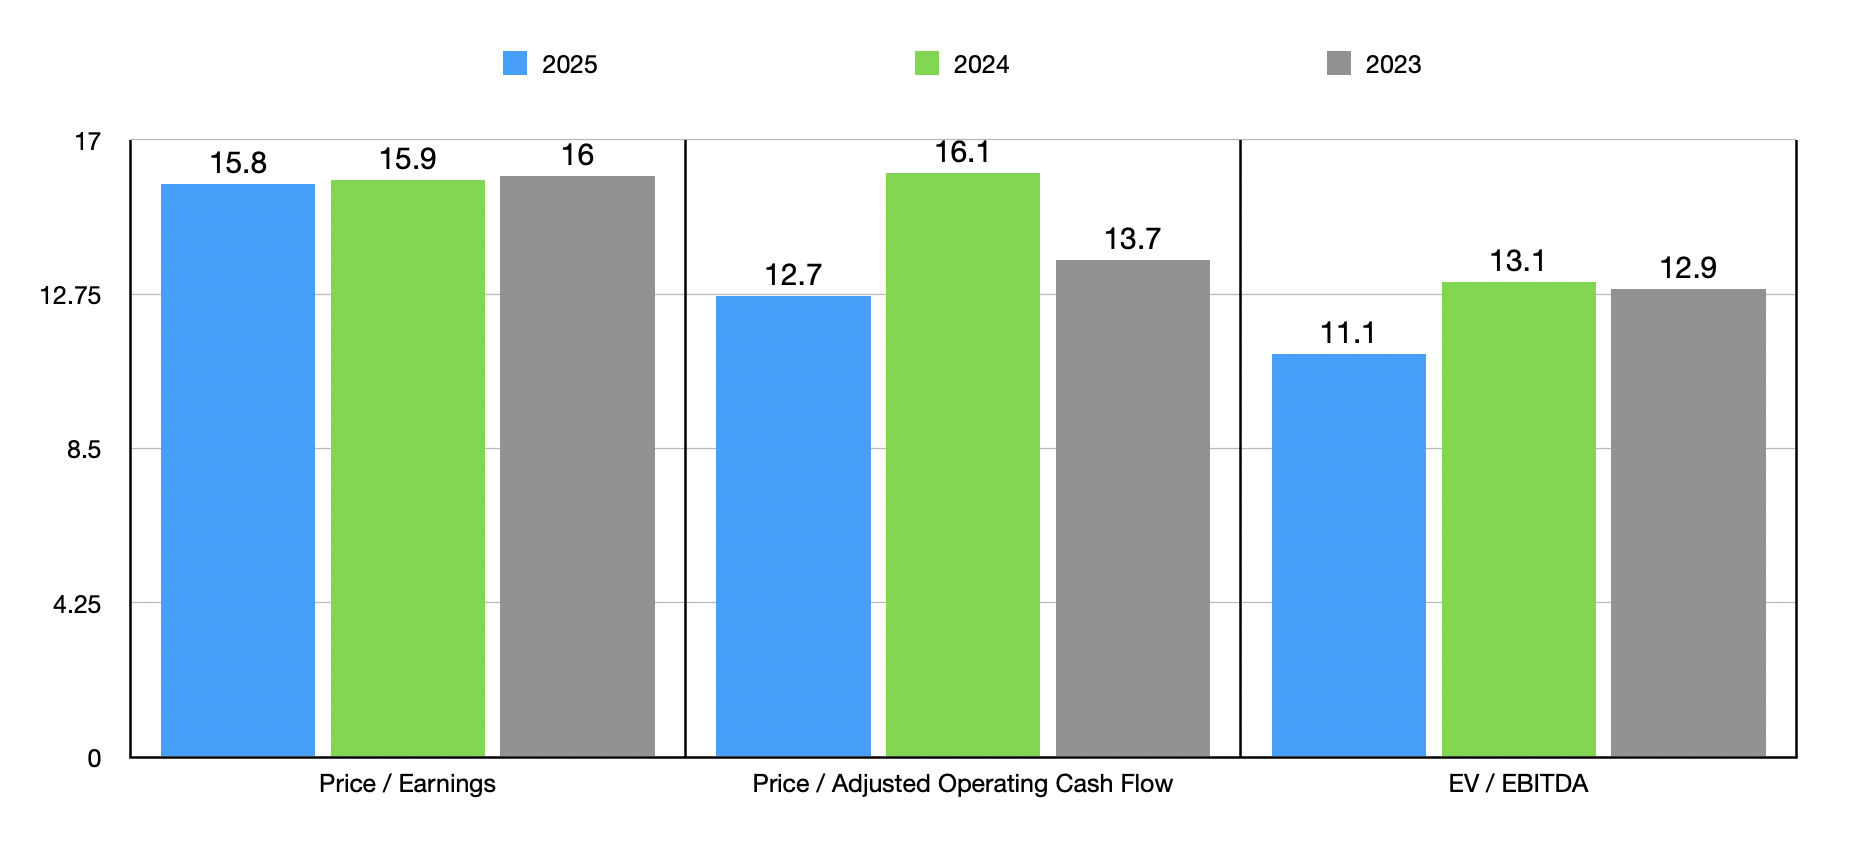
Using these figures, we can easily value the company as shown in the chart above. This is not exactly the realm of what I would consider to be incredibly cheap. But it is getting pretty close to being objectively attractively priced. In the table below, meanwhile, we can see that shares are incredibly cheap compared to the five companies I decided to compare it to. On both a price to earnings basis and on an EV to EBITDA basis, Science Applications International ended up being the cheapest of the group. And when it comes to the price to operating cash flow approach, we end up with only one of the five players being cheaper than it.
| Company | Price / Earnings | Price / Operating Cash Flow | EV / EBITDA |
| Science Applications International | 15.9 | 16.1 | 13.1 |
| Leidos Holdings (LDOS) | 89.2 | 15.1 | 20.6 |
| KBR (KBR) | 28.2 | 25.3 | 107.5 |
| CACI International (CACI) | 22.4 | 26.3 | 13.9 |
| Parsons (PSN) | 57.5 | 23.0 | 22.1 |
| Booz Allen Hamilton (BAH) | 46.7 | 54.2 | 24.1 |
Given the company’s track record, this alone is not enough to make me bullish on the business. Even after looking at the relative valuation, I was leaning toward rating it a “hold.” However, when digging deeper, I found that management has a plan for improving operations further. Management is making a concerted effort, for instance, when it comes to making investments aimed at boosting operational efficiencies. The goal is to grow the adjusted EBITDA margin of the business from 9% in 2024 to 9.4% in 2026. When applied to the kind of revenue anticipated for this year, that would translate to an extra $29.7 million in profitability on the bottom line. On top of this, management is aiming for revenue of between $7.55 billion and $7.76 billion in 2026. Assuming the company hits its profitability target, this would instead increase EBITDA by $30.6 million.
But even if we ignore that, the chart in this article that shows how shares are priced on an absolute basis show that, looking forward for 2025, the stock is already more attractive than what we get using the 2024 data. So even just achieving guidance for this current fiscal year would go a long way for shareholders.
Science Applications International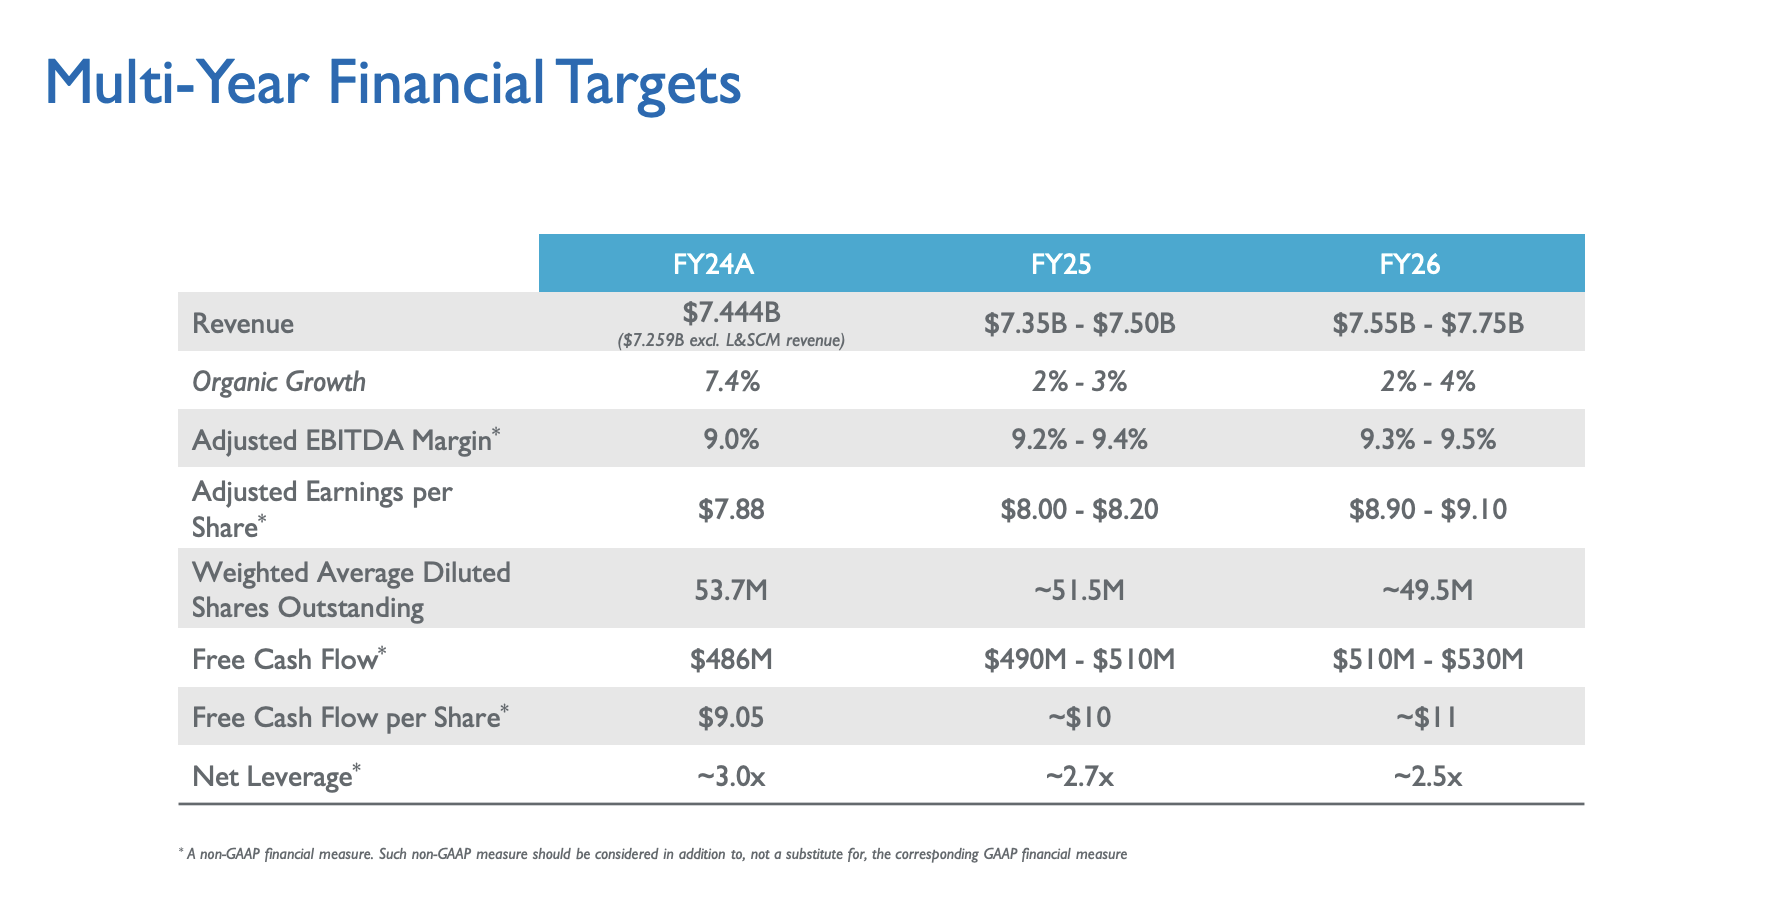
In addition to forecasting higher revenue and profits, management is also working to buying back stock. The firm has a long history of doing this. Over the past three fiscal years, management repurchased $826 million worth of shares. This has taken its share count down by 9.3% from 58.1 million to 52.7 million by the end of 2025, management is forecasting 51.5 million shares. And by the end of 2026, they expect this to fall further to 49.5 million.
Along the way, the firm also seems intent on buying back stock. If they achieve the midpoint of their EBITDA guidance and achieve their net leverage target, we would be looking at and that leverage ratio of 2.5 compared to the 3 that we have today. That would imply around $207 million in net debt reduction from the end of the 2024 fiscal year through the end of 2026.
Takeaway
Based on the data provided, I understand why the market was unhappy with Science Applications International Corporation stock. In many respects, the company has just been a mediocre player for the last few years. Admittedly, some of the figures that we have looked at required adjustments that, once made, made the enterprise look better. But it’s never great to see cash flows fall and shares are not exactly in the bargain bin.
The good news is that, relative to similar firms, the stock does look cheap and management is working hard to improve operations. Assuming this comes to fruition, I would say that the worst is now behind us and that this decline in price seen could represent a decent buying opportunity for those who believe in the business moving forward. Because of this, I’ve decided to assign the company a soft “buy.”

 Q2 2024 Earnings Call Transcript")

