Torsten Asmus
February represented a fantastic month for income generation, with growth of 15.52% for the month of February (compared to income generated February 2023). Income growth is looking strong, but I have some concerns as the DJIA, S&P500, and Nasdaq all continue to push record highs. When I see situations like this, I put on my cautious hat and look to trim back certain positions, especially if I can sell the high-cost portion of the position and then redeploy that capital into an investment that looks undervalued. During the month of February we did not sell any shares but added to existing positions a total of six times during the month. 5 out of the 6 positions have seen a lot of success in the short term with only WPC in the red as at the time of writing this article.
Compounding the concerns with all-time market highs was the recent unemployment numbers that ticked up from 3.7% to 3.9%. While I really don’t find this shocking (my job as an underwriter that specializes in working with low income borrowers, I have seen a clear pattern of things continuing to get more difficult on the job front).
In the link cited, I found the following comment to be the most interesting.
Interactive Broker’s senior economist, José Torres, observed “We are seeing that laid-off workers are taking longer to replace their old jobs.
One thing this quote reminds me of is that the way we measure unemployment about as bad as it gets and there are a number of exclusions (for example, people who have just given up altogether are not included in the number) but also like the quote above suggests that if a borrower loses their job it is taking them longer to find a new one and with the average American having nothing in savings this is likely to contribute to more vehicle repossessions and other adverse situations that will eventually hurt all of us. Now, factor in the explosion of AI and that companies of all sizes are utilizing AI in ways that will allow them to reduce their headcount and make their operations more efficient.
As far as I’m concerned, we are headed towards uncharted territory and the only thing I can truly say I believe in is that I expect change will happen at a pace that is faster than most of us (myself included) will be able to comprehend.
February Trades
We added to several existing positions in February, with a total of six trades across a total of four companies.
2024-2 – Taxable Account Trades (Charles Schwab)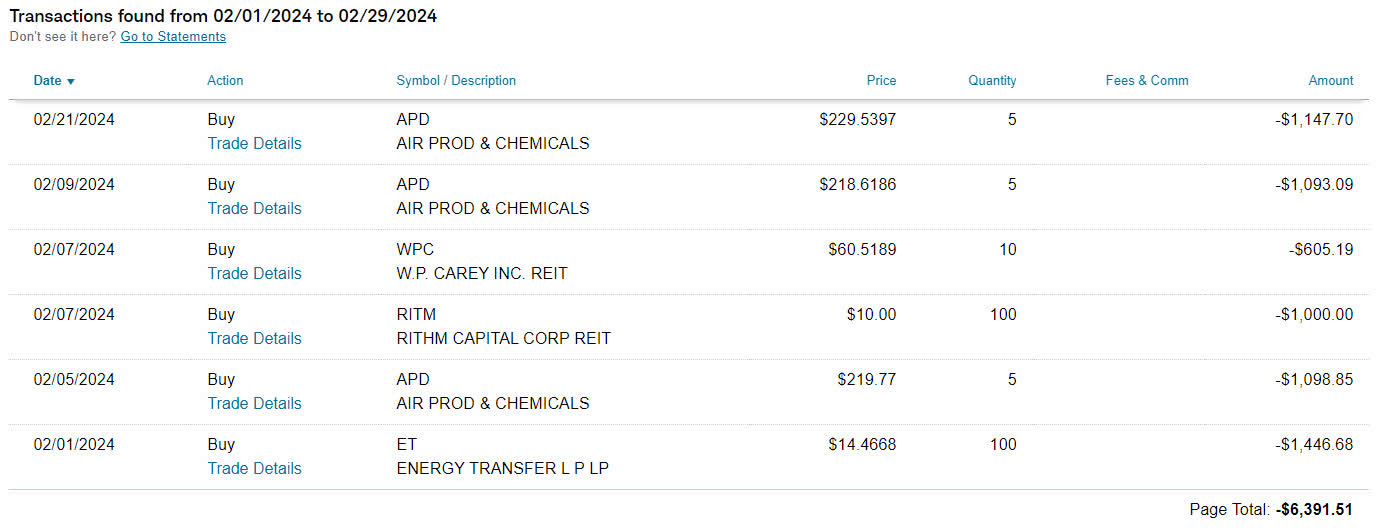
Air Products and Chemicals (APD) – We added shares of APD in January prior to the considerable drop of the stock price, and we used this opportunity to add shares three times during the month of February. All of this has already paid off as the stock price is already back up to $245/share. We have already set a limit trade to cut back our highest cost shares at $265/share and may adjust this selling price down depending on what we see over the next few months.
W. P. Carey (WPC) – We have added shares a few times across John and Jane’s portfolios, and we are doing so in small quantities. We already have a fairly low-cost basis and would definitely like to trim back some small tranches of shares at a higher cost basis.
Rithm Capital (RITM) – We have added yet again and this was executed as a limit purchase at $10.00/share. This seems to be the new downside resistance point, and the stock price has since moved higher after its Q4-2023 earnings beat and the announcement of its share repurchase program for both common and preferred stock. We still have some higher cost basis shares from several years ago when the stock price was in the $15/share range, and we would consider trimming those back at around $14/share (so we are a long way off before that happens).
Energy Transfer (ET) – ET has been on a tear, with the stock price now reaching a level where all of the shares held are now at a break-even or in the positive. Over the last year, ET is up 15.7% and the stock price has reached nearly the same price as what was seen five years ago. ET has also continued to offer compelling distribution increases and has achieved a quarterly payout that is higher than it was prior to the 50% distribution cut seen in November 2020. John and Jane plan to continue holding all shares of ET at this time.
Portfolio Composition
For the full review of the article, please check my YouTube videos (link in my profile). These videos delve into previous account balances and other data points collected over seven years of documenting John and Jane’s portfolios. So if you are looking for what has driven the numbers you see below, my videos address this in substantially more detail.
The images below are focused on what is happening now and moving forward.
The first image shows what has happened year-over-year with the portfolio in terms of what holdings are generating income.
2024 – February – Taxable Dividend Breakdown (CDI)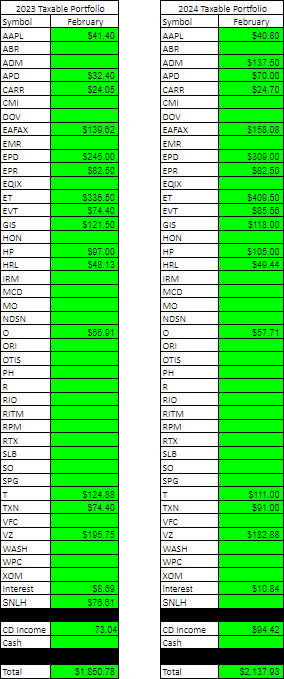
Here is an updated table of the extremely conservative forecast that suggests income would be down -5.6% in 2024, but this assumes that we see no dividend growth, and we do not capitalize on the additional income from CD’s and Money Markets.
2024-2 – Taxable Forecasted Income (CDI)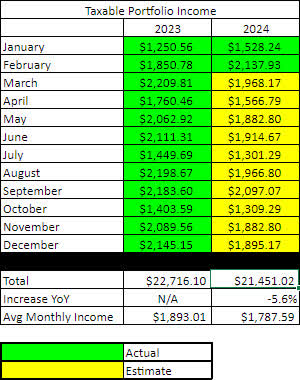
The next image has been updated from my forecasting articles to look at how much the income has grown on a monthly basis and separates out what income is from dividends and what comes from CDs/Money Markets, etc.
2024 – February – Monthly Income Growth Tracker (CDI)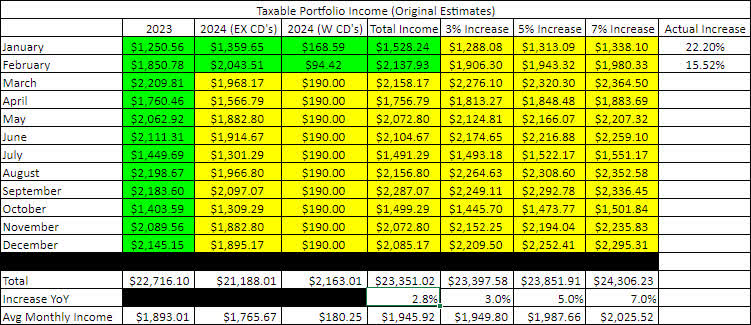
Since the last article, I went in and updated the table above and caught a few calculation errors (the major one was that I had a manual number added to the equation that was inflating the “Total Income – Increase YoY”. With that updated, the income growth seems much more realistic.
Here is a basic understanding of what each of the columns/fields mean:
- 2023 – Income results for 2023
- 2024 (Ex CDs) – Estimated income 2024 (yellow) and actual income 2024 (green) but excludes all income earned from money markets, CD’s, etc.
- 2024 (W CDs) – Estimated CD & money market income 2024 (yellow) and actual income 2024 (green). Separated because we want to differentiate between dividend income and growth compared to CD’s/money market that are not subject to increases.
- Total Income – Combined total income from dividends, CDs, Money market, etc.
- 3%/5%/7% Increase – These columns serve as a marker so you can see how much income would need to be hit that month to achieve a specific increase. I will likely change these numbers to be more account specific in the future (some accounts are growing more rapidly than others.
So what are the big takeaways here:
Income generated grew by 22.2% in January and 15.52% in February. Even with these increases, the portfolio is projected to grow a total of 2.8% based on the current numbers we know (like share count, dividend payout, etc.).
It’s important to remember there are a few variables that aren’t baked into these numbers and that would include dividend increases that haven’t been announced yet, and sometimes I miss updating the future increases in income when John and Jane increase their exposure to an existing position (at least until the month when it is received).
Another major component is when certificates of deposit expired and the funds returned back to John and Jane as cash. When you look at February compared to January you may notice that the amount of income from CDs and SWVXX is down considerably and that’s because we had two CDs expire and the last interest payment was in January. At the same time, we added to SWVXX and increased how much income it generates (January was $32.28 compared with February income of $94.42). This is why I used $190/month as a placeholder for CD income. (I got $190/month by saying what if all cash, CDs, and Money Markets were paying a 4% yield, and we were fully invested).
Upcoming Trades & Portfolio Changes
As we begin the month of March, we are looking extremely limited when it comes to opportunities to purchase additional shares of any companies that are currently held in the Taxable Portfolio. The companies that are attractively priced are ones that we already have full exposure to (or at least as much as we are willing to have exposure to). Some examples of the companies that arguably have an attractive price point where we currently have a full position include:
Since we have taken some small losses off the table, it is also time to consider taking some gains off the table as well because many of the positions in the taxable account are currently pushing record-highs or 52-week-highs. Now would be a good time for us to consider trimming or eliminating some positions where the investment thesis has played out and the potential for upside is limited and the likelihood of downside is becoming much more likely.
There are two positions in particular that we are looking to trim or eliminate in the next month.
Neither of these positions are core holdings in the Taxable Portfolio.
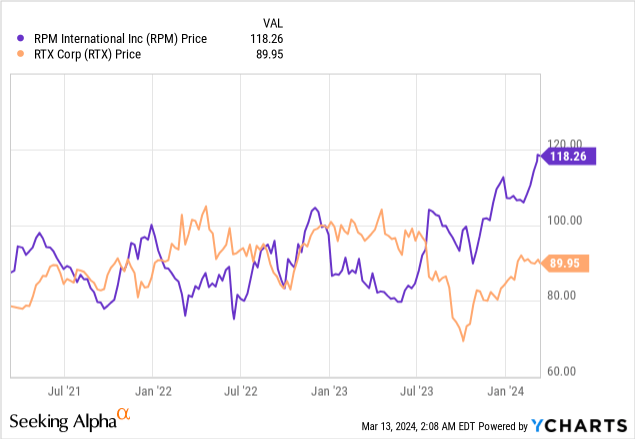
RPM has reached a price point that is no longer justifiable, which means we either need to reduce the size of the holding down to a few shares or eliminate it altogether. With the stock price at an all-time high, I am in favor of eliminating this position.
RTX, on the other hand, is a position that has been recovering since July of 2023, and we were lucky enough to have trimmed back the holding prior to when it fell off a cliff with the stock price falling 30% over the span of a few months. This is a position we decided to hold on to because it was attractively priced after it cratered, but now the argument for further upside seems very weak. I am also in favor of exiting this position because there are better aerospace and defense contractors to have exposure to if we really wanted it, like Lockheed Martin (LMT).
Some potential replacement investments include that have been on my radar include:
The portfolio has almost no exposure to companies that engage in the production of Gold or other precious metals (I don’t even include Rio Tinto (RIO) in this category since their primary focus is iron ore).
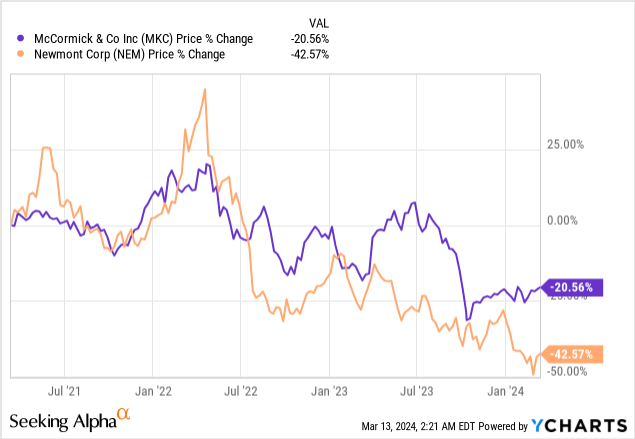
From a consistency standpoint, we think that MKC is the most promising option and that the stock price has a strong floor in.
NEM, on the other hand, recently announced a -37.5% dividend cut, so the bad news has already baked into the stock price.
Conclusion
If we begin to cut back on equities, this also has the potential to shift the income more dramatically (especially if we don’t have a good place to deploy the capital). We are also able to look at treasuries and other fixed income investments, but you should always be aware of the potential tax consequences (which is something that has come up a few times in the comments on prior articles).
Based on the tables above, we are estimating an income increase of 2.8% even though our extremely conservative model is sitting at -5.6% as of the end of February. This difference might not seem like a lot, but when you consider that January and February grew by double digits, it now leaves only 10 months of income to make up the difference of 8.4%.
One of the benefits for John and Jane’s retirement portfolio is that they live in a state that has no income tax, even though it has a higher sales tax and property taxes. With this in mind there is less emphasis on the importance of investments like T-Bills since one of the major selling points is that they are subject to Federal Income tax but exempt from state or local taxes.
February was another busy month for purchases and with the exception of WPC, all of the share prices have climbed higher since the trades were made. We do have a total of seven limit trades set with three sells and four buys.
2024 – February – Open Limit Trades (CDI)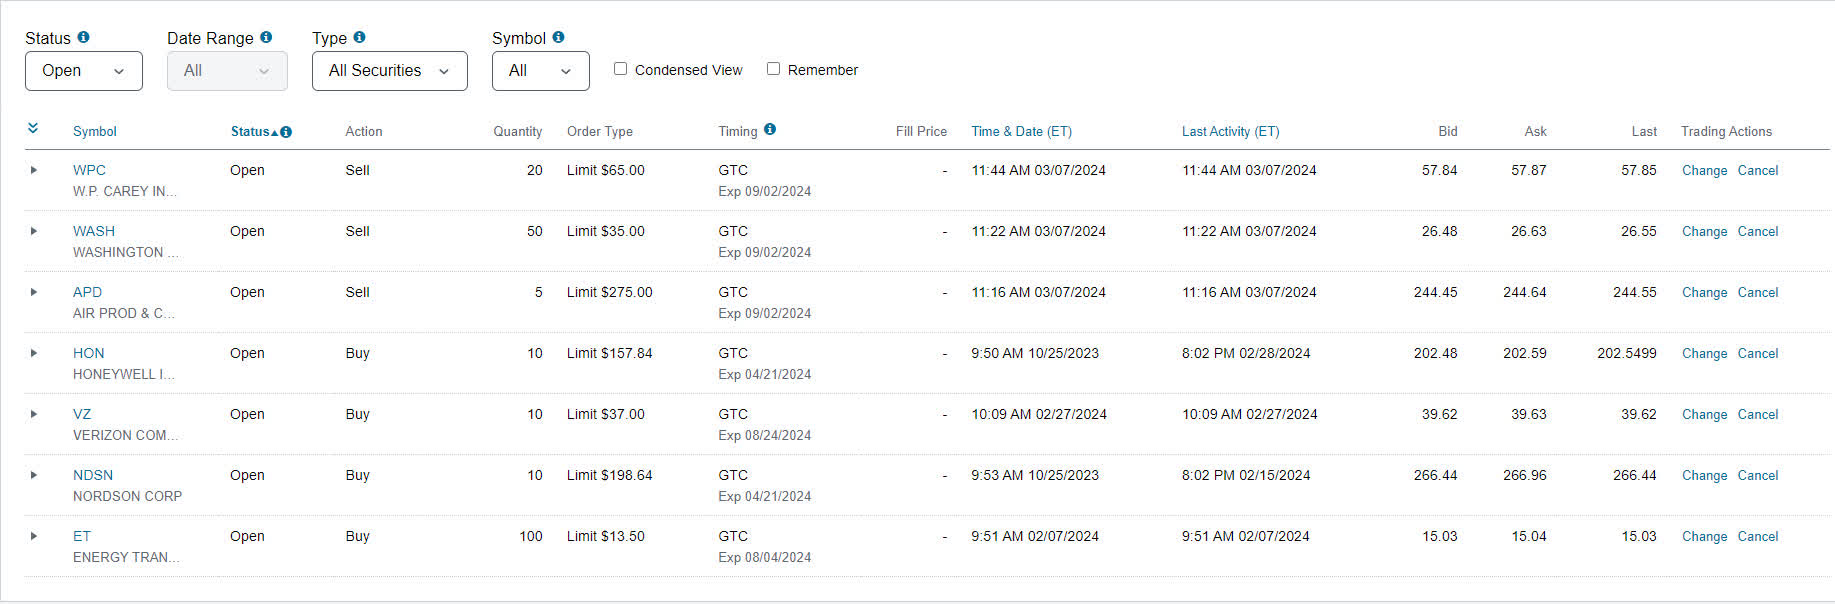
Several of these are likely not going to come to fruition (for example, NDSN dropping below $200/share is extremely unlikely) but it’s a company we would gladly add to if it did.
At this point, the most likely trades to actually execute include:
- WPC – Sell 20 @ $65/share
- APD – Sell 5 @ $275/share
- VZ – Buy 10 @ $37/share
What stocks are you seeing that aren’t on my list? Another SA member provided me with an extensive list of his portfolio and holdings, and I have to say it has opened my eyes to some additional opportunities I was otherwise not seeing. I will be getting caught up with my articles over the next few weeks and hopefully able to write about some of the interesting investments I had not considered in the past.
If you found this article interesting and are interested in even more in-depth reviews of John and Jane’s portfolio, please consider following me on my YouTube Channel.
John and Jane are long all holdings mentioned in this article.

 Q2 2024 Earnings Call Transcript")

