Alistair Berg
“Quality” Closed-End Fund Report
Quantitative screens help to rapidly narrow down attractive candidates from the database of 500-plus closed-end funds for further due diligence and investigation.
Author
Based on feedback, it is evident that many investors place significant importance on distribution coverage and the return of capital. While I won’t delve into the entire argument regarding return of capital here (as it is a complex issue beyond a simple “ROC = bad” conclusion), some investors find a fund with over 100% coverage appealing because they know that the distributions are being supported by earnings. Such a fund is perceived to have a lower risk of a distribution cut, which can have a devastating impact on the fund’s market price. Therefore, the “Quality” report focuses exclusively on funds with coverage exceeding 100%.
However, it is important to note certain caveats: Firstly, it is recommended to independently verify the coverage ratios using the latest fund documents before making any buying or selling decisions. Secondly, having a coverage ratio greater than 100% does not guarantee the absolute security of a fund’s distribution. Many funds adjust their distributions periodically in line with market conditions to ensure sufficient coverage. Thirdly, the decision to set the coverage cutoff at 100% is ultimately arbitrary. A fund with 99.9% coverage would be excluded from the rankings, while funds with 100.1% coverage would be considered, even though there is only a marginal difference between the two.
How is coverage calculated?
For the following fund houses, the latest trailing coverage numbers from the fund’s latest unaudited monthly estimates are used:
- PIMCO: trailing 6-month coverage
- BlackRock: trailing 3-month coverage
- Nuveen: trailing 3-month coverage
- Eaton Vance: trailing 3-month coverage
For the remaining funds, the coverage ratios are calculated using earnings data from their most recent annual/semi-annual reports. As these reports are released only twice a year, the coverage ratios will show more of a lag (of up to 6 months) compared to those fund families that release monthly earnings estimates.
I hope that these rankings of “Quality” CEFs will provide fertile grounds for further exploration and due diligence. As a reminder, these top lists are meant to be preliminary shortlists for further research, and are not meant to be the final analysis for a buy or sell decision.
Key to table headings:
P/D = premium/discount
Z = 1-year z-score
Lev = leverage
BE = baseline expense
Cov = coverage
Data were taken from the close of May 28th, 2024.
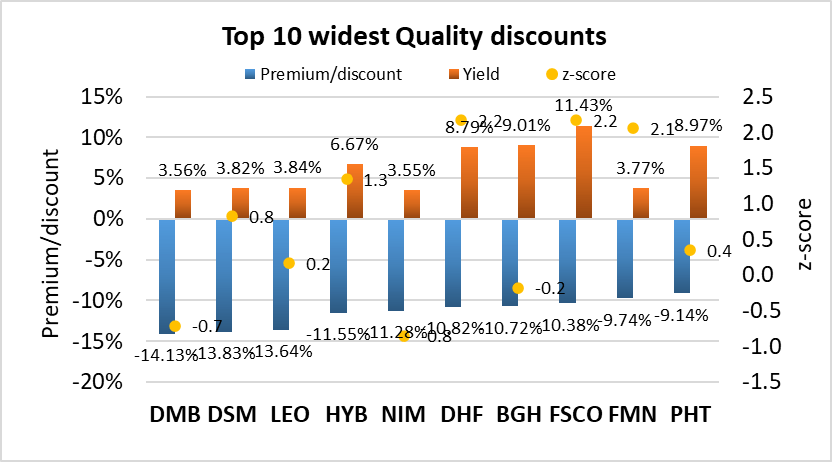
1. Top 10 widest quality discounts
The following data show the 10 CEFs with the highest discounts and coverage >100%. Yields, z-scores and leverage are shown for comparison.
| Fund | Ticker | Category | P/D | Yield | Z | Cov | 1Y NAV | Lev | BE |
| BNY Mellon Muni Bond Infrastructure Fund | (DMB) | National Munis | -14.13% | 3.56% | -0.7 | 116% | 2.6% | 31% | 1.15% |
| BNY Mellon Strategic Muni Bond | (DSM) | National Munis | -13.83% | 3.82% | 0.8 | 101% | 1.7% | 33% | 0.88% |
| BNY Mellon Strategic Municipals | (LEO) | National Munis | -13.64% | 3.84% | 0.2 | 116% | 2.7% | 34% | 0.90% |
| New America High-Income | (HYB) | High Yield | -11.55% | 6.67% | 1.3 | 101% | 8.7% | 31% | 1.48% |
| Nuveen Select Maturity Muni | (NIM) | National Munis | -11.28% | 3.55% | -0.8 | 102% | 2.8% | 0% | 0.57% |
| BNY Mellon High Yield Strategies Fund | (DHF) | High Yield | -10.82% | 8.79% | 2.2 | 100% | 11.2% | 29% | 1.31% |
| Barings Global Short Duration High Yield | (BGH) | High Yield | -10.72% | 9.01% | -0.2 | 111% | 16.1% | 26% | 1.50% |
| FS Credit Opportunities Corp. | (FSCO) | Multisector Income | -10.38% | 11.43% | 2.2 | 101% | 20.7% | 17% | 4.43% |
| Federated Premier Municipal Income | (FMN) | National Munis | -9.74% | 3.77% | 2.1 | 100% | 2.3% | 38% | 0.99% |
| Pioneer High Income | (PHT) | High Yield | -9.14% | 8.97% | 0.4 | 100% | 15.6% | 31% | 1.00% |
Income Lab
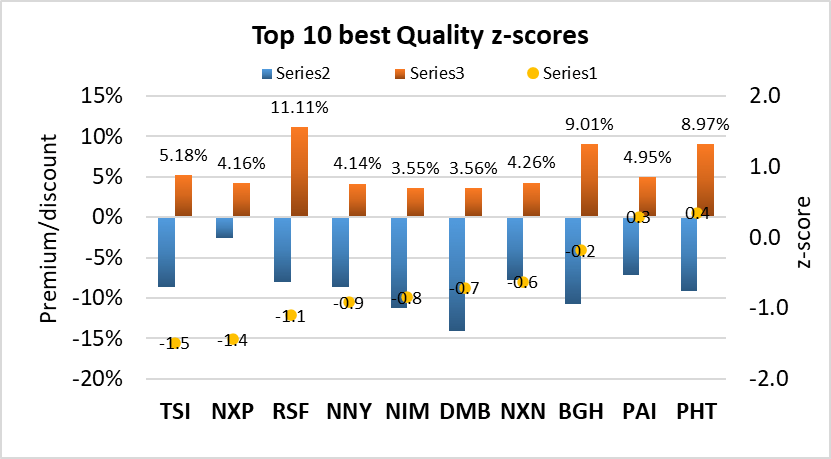
2. Top 10 best quality z-scores
CEFs with the best (most negative) z-scores are potential buy candidates. The following data show the 10 CEFs with the lowest z-scores. Premium/discount, yields and leverage are shown for comparison. Only funds with coverage >100% are considered.
| Fund | Ticker | Category | Z | P/D | Yield | Cov | 1Y NAV | Lev | BE |
| TCW Strategic Income | (TSI) | Multisector Income | -1.5 | -8.68% | 5.18% | 132% | 5.3% | 0% | 0.85% |
| Nuveen Select Tax Free Inc | (NXP) | National Munis | -1.4 | -2.57% | 4.16% | 103% | 3.3% | 0% | 0.24% |
| RiverNorth Capital and Inc Fund | (RSF) | High Yield | -1.1 | -8.09% | 11.11% | 138% | 8.4% | 57% | 8.84% |
| Nuveen NY Municipal Value | (NNY) | New York Munis | -0.9 | -8.70% | 4.14% | 102% | 2.8% | 0% | 0.55% |
| Nuveen Select Maturity Muni | (NIM) | National Munis | -0.8 | -11.28% | 3.55% | 102% | 2.8% | 0% | 0.57% |
| BNY Mellon Muni Bond Infrastructure Fund | (DMB) | National Munis | -0.7 | -14.13% | 3.56% | 116% | 2.6% | 31% | 1.15% |
| Nuveen NY Select Tax Free Income | (NXN) | New York Munis | -0.6 | -7.80% | 4.26% | 102% | 3.0% | 0% | 0.42% |
| Barings Global Short Duration High Yield | (BGH) | High Yield | -0.2 | -10.72% | 9.01% | 111% | 16.1% | 26% | 1.50% |
| Western Asset Income | (PAI) | Investment Grade | 0.3 | -7.19% | 4.95% | 109% | 3.2% | 9% | 0.80% |
| Pioneer High Income | (PHT) | High Yield | 0.4 | -9.14% | 8.97% | 100% | 15.6% | 31% | 1.00% |
Income Lab
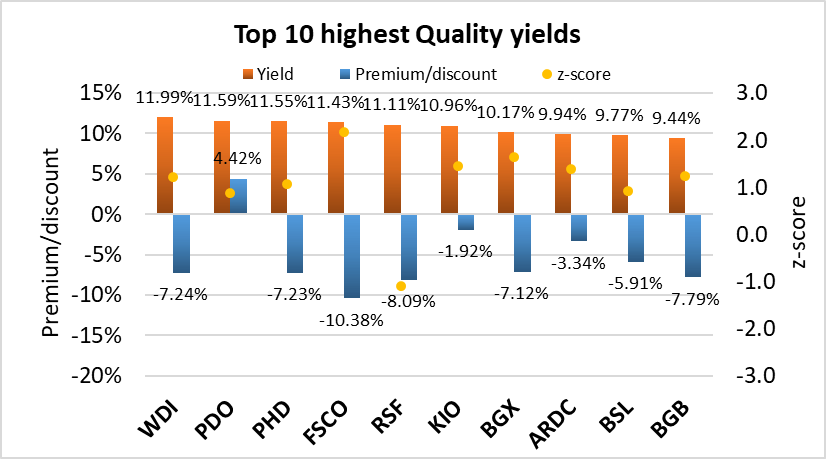
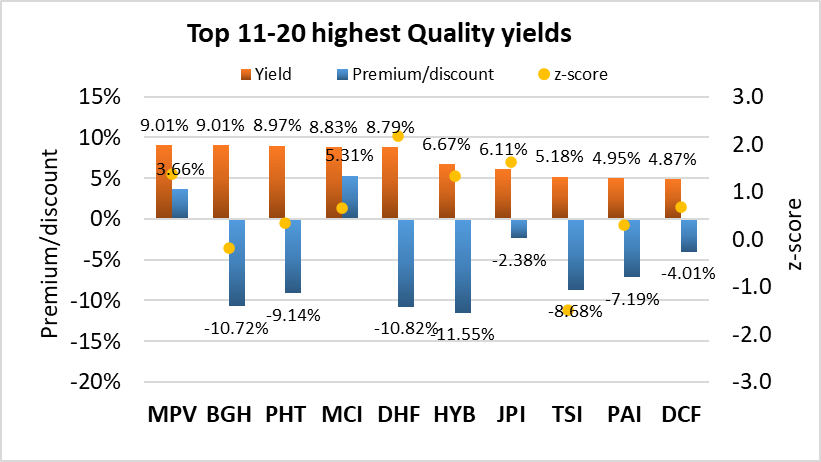
3. Top 20 highest quality yields
The following data show the 20 CEFs with the highest yields. However, it is important to note that higher yields generally indicate higher risk (such as through leverage or investment in risky assets). Additionally, considering the premium/discount valuation of these funds is crucial as it tells you whether you’re paying more or less for the fund than what its underlying assets are worth. Only funds with coverage >100% are considered.
| Fund | Ticker | Category | Yield | P/D | Z | Cov | 1Y NAV | Lev | BE |
| Western Asset Diversified Inc Fund | (WDI) | Multisector Income | 11.99% | -7.24% | 1.2 | 102% | 12.4% | 32% | 1.81% |
| PIMCO Dynamic Income Opportunities Fund | (PDO) | Global Income | 11.59% | 4.42% | 0.9 | 114% | 10.4% | 41% | 2.20% |
| Pioneer Floating Rate Fund | (PHD) | Senior Loans | 11.55% | -7.23% | 1.1 | 107% | 15.8% | 32% | 1.40% |
| FS Credit Opportunities Corp. | (FSCO) | Multisector Income | 11.43% | -10.38% | 2.2 | 101% | 20.7% | 17% | 4.43% |
| RiverNorth Capital and Inc Fund | (RSF) | High Yield | 11.11% | -8.09% | -1.1 | 138% | 8.4% | 57% | 8.84% |
| KKR Income Opportunities Fund | (KIO) | High Yield | 10.96% | -1.92% | 1.5 | 106% | 20.3% | 36% | 2.14% |
| Blackstone Long-Short Credit Income | (BGX) | Senior Loans | 10.17% | -7.12% | 1.6 | 105% | 14.0% | 31% | 2.20% |
| Ares Dynamic Credit Allocation Fund | (ARDC) | Senior Loans | 9.94% | -3.34% | 1.4 | 112% | 16.5% | 33% | 2.58% |
| Blackstone Senior Floating Rt 2027 term | (BSL) | Senior Loans | 9.77% | -5.91% | 0.9 | 101% | 14.2% | 32% | 1.93% |
| Blackstone Strategic Credit 2027 term | (BGB) | Senior Loans | 9.44% | -7.79% | 1.3 | 107% | 13.3% | 36% | 2.58% |
| Barings Participation Invs | (MPV) | High Yield | 9.01% | 3.66% | 1.4 | 109% | 11.8% | 12% | 1.00% |
| Barings Global Short Duration High Yield | (BGH) | High Yield | 9.01% | -10.72% | -0.2 | 111% | 16.1% | 26% | 1.50% |
| Pioneer High Income | (PHT) | High Yield | 8.97% | -9.14% | 0.4 | 100% | 15.6% | 31% | 1.00% |
| Barings Corporate Investors | (MCI) | High Yield | 8.83% | 5.31% | 0.7 | 109% | 11.5% | 11% | 1.46% |
| BNY Mellon High Yield Strategies Fund | (DHF) | High Yield | 8.79% | -10.82% | 2.2 | 100% | 11.2% | 29% | 1.31% |
| New America High-Income | (HYB) | High Yield | 6.67% | -11.55% | 1.3 | 101% | 8.7% | 31% | 1.48% |
| Nuveen Preferred & Income Term Fund | (JPI) | Preferreds | 6.11% | -2.38% | 1.6 | 102% | 15.4% | 36% | 1.44% |
| TCW Strategic Income | (TSI) | Multisector Income | 5.18% | -8.68% | -1.5 | 132% | 5.3% | 0% | 0.85% |
| Western Asset Income | (PAI) | Investment Grade | 4.95% | -7.19% | 0.3 | 109% | 3.2% | 9% | 0.80% |
| BNY Mellon Alcentra Gl Crd Inc 2024 Tgt | (DCF) | Multisector Income | 4.87% | -4.01% | 0.7 | 178% | 18.0% | 27% | 1.63% |
Income Lab
Income Lab
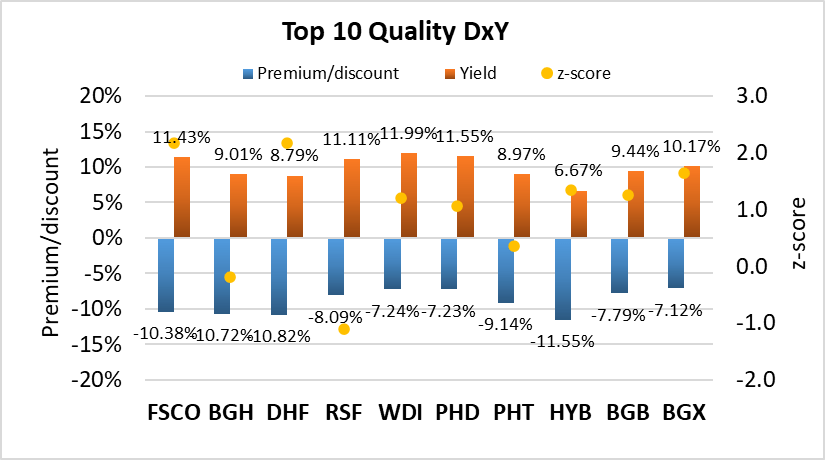
4. Top 10 best combination of quality yield and discount
Buying a CEF with both a high yield and discount not only gives you the opportunity to capitalize from discount contraction, but you also get “free” alpha every time the distribution is paid out. This is because paying out a distribution is effectively the same as liquidating the fund at NAV and returning the capital to the unitholders. Only funds with >100% coverage and <0% premium/discount are considered.
| Fund | Ticker | Category | P/D | Yield | Z | DxY | Cov | 1Y NAV | Lev | BE |
| FS Credit Opportunities Corp. | (FSCO) | Multisector Income | -10.38% | 11.43% | 2.2 | -1.2 | 101% | 20.7% | 17% | 4.43% |
| Barings Global Short Duration High Yield | (BGH) | High Yield | -10.72% | 9.01% | -0.2 | -1.0 | 111% | 16.1% | 26% | 1.50% |
| BNY Mellon High Yield Strategies Fund | (DHF) | High Yield | -10.82% | 8.79% | 2.2 | -1.0 | 100% | 11.2% | 29% | 1.31% |
| RiverNorth Capital and Inc Fund | (RSF) | High Yield | -8.09% | 11.11% | -1.1 | -0.9 | 138% | 8.4% | 57% | 8.84% |
| Western Asset Diversified Inc Fund | (WDI) | Multisector Income | -7.24% | 11.99% | 1.2 | -0.9 | 102% | 12.4% | 32% | 1.81% |
| Pioneer Floating Rate Fund | (PHD) | Senior Loans | -7.23% | 11.55% | 1.1 | -0.8 | 107% | 15.8% | 32% | 1.40% |
| Pioneer High Income | (PHT) | High Yield | -9.14% | 8.97% | 0.4 | -0.8 | 100% | 15.6% | 31% | 1.00% |
| New America High-Income | (HYB) | High Yield | -11.55% | 6.67% | 1.3 | -0.8 | 101% | 8.7% | 31% | 1.48% |
| Blackstone Strategic Credit 2027 term | (BGB) | Senior Loans | -7.79% | 9.44% | 1.3 | -0.7 | 107% | 13.3% | 36% | 2.58% |
| Blackstone Long-Short Credit Income | (BGX) | Senior Loans | -7.12% | 10.17% | 1.6 | -0.7 | 105% | 14.0% | 31% | 2.20% |
Income Lab
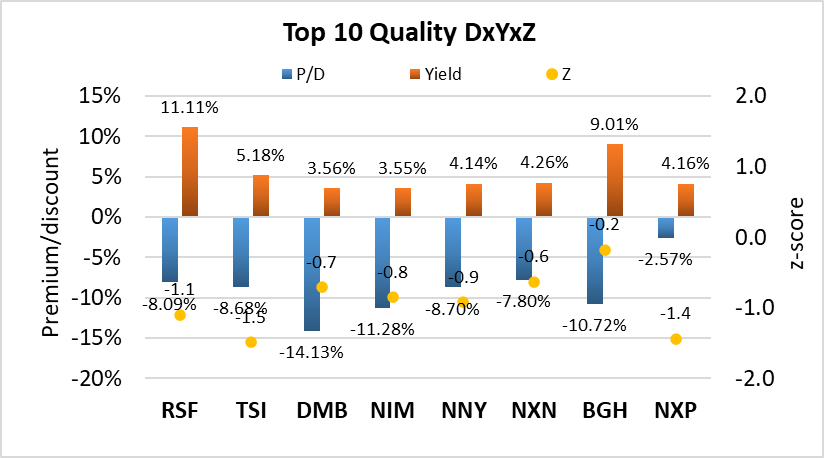
5. Top 10 best combination of quality yield, discount and z-score
This metric takes into account all three factors of yield, discount and z-score. The composite metric simply multiplies the three quantities together, which reveals funds that are undervalued on both an absolute and relative basis. A screen is applied to only include CEFs with a negative one-year z-score. Only funds with 100% coverage, <0% premium/discount and <0 z-score are considered. (Note that only 8 funds fit these criteria this month).
| Fund | CEF | Category | P/D | Yield | Z | DxYxZ | Cov | 1Y NAV | Lev | BE |
| RiverNorth Capital and Inc Fund | (RSF) | High Yield | -8.09% | 11.11% | -1.1 | 1.0 | 138% | 8.4% | 57% | 8.84% |
| TCW Strategic Income | (TSI) | Multisector Income | -8.68% | 5.18% | -1.5 | 0.7 | 132% | 5.3% | 0% | 0.85% |
| BNY Mellon Muni Bond Infrastructure Fund | (DMB) | National Munis | -14.13% | 3.56% | -0.7 | 0.4 | 116% | 2.6% | 31% | 1.15% |
| Nuveen Select Maturity Muni | (NIM) | National Munis | -11.28% | 3.55% | -0.8 | 0.3 | 102% | 2.8% | 0% | 0.57% |
| Nuveen NY Municipal Value | (NNY) | New York Munis | -8.70% | 4.14% | -0.9 | 0.3 | 102% | 2.8% | 0% | 0.55% |
| Nuveen NY Select Tax Free Income | (NXN) | New York Munis | -7.80% | 4.26% | -0.6 | 0.2 | 102% | 3.0% | 0% | 0.42% |
| Barings Global Short Duration High Yield | (BGH) | High Yield | -10.72% | 9.01% | -0.2 | 0.2 | 111% | 16.1% | 26% | 1.50% |
| Nuveen Select Tax Free Inc | (NXP) | National Munis | -2.57% | 4.16% | -1.4 | 0.2 | 103% | 3.3% | 0% | 0.24% |
Income Lab
Strategy Statement
Our goal aims to provide consistent income with enhanced total returns. Our CEF rotation strategy includes trading between CEFs to exploit fluctuations in valuations. This is because CEF prices are inefficient, with investors often overreacting to both the upside or downside, or being unaware of upcoming corporate actions. This could help capture alpha from CEFs for the nimble investor.
Remember, it’s really easy to put together a high-yielding CEF portfolio, but to do so profitably is another matter! Our experience has been that it is very possible to earn profitable returns in CEFs. While there are numerous opportunities in the closed-end fund sector, it is essential to remain vigilant of the associated risks. Blindly chasing yield is not a prudent strategy.
Editor’s Note: This article covers one or more microcap stocks. Please be aware of the risks associated with these stocks.

 Q2 2024 Earnings Call Transcript")

