Yesterday’s selling had a few people in the financial media exclaiming that “this is what we’ve been waiting for.”
True, we’ve been looking for a “healthy correction” for the last few weeks, but one day selling is an event, more than three starts to turn into a trend.
Don’t react to the event just yet. There are a few lines in the sand that will determine whether Tuesday was a one-off event or the beginning of the correction.
The Nasdaq 100 (QQQ) 20-day Moving Average
This is what I refer to as the “Trader’s Trendline.” It moves fast with the market, which is why traders take their cues from it.
The market found support at this trendline yesterday, and so far, we’re seeing strength as traders try to buy the dip. I expect that Jerome Powell’s testimony to Congress today will dictate whether this support holds, but two closes below the QQQ’s $434 price will increase selling as traders take their cue from that technical break.
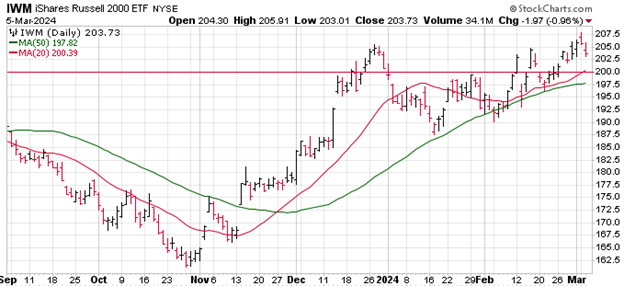
The Russell 2000 (IWM) 20-day Moving Average
Same trendline, different index.
The Russell 2000 Index represents the market’s appetite for risk. Markets are driven by speculation, so a breakdown in the Russell means that the speculators are taking money out of stocks.
We saw some strength in the IWM yesterday as the regional banks – the largest sector in the IWM – saw buyers step in. The retail sector – the second largest in the IWM – has been on a tear in response to retail earnings, which has helped buoy the “Risk-On” Index.
Watch the IWM’s $200 level, which is where its 20-day sits. A break below that price will dramatically increase volatility and selling.
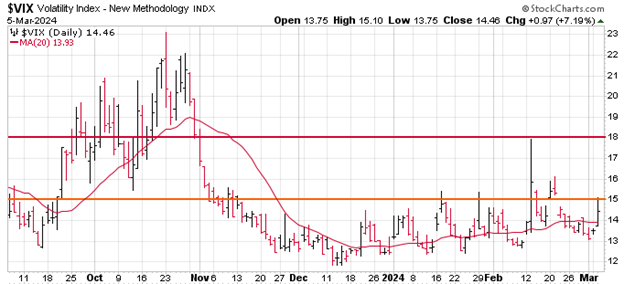
CBOE Volatility Index (VIX)
This is the market’s “Fear Index.” It goes higher as investors get more fearful and lower when they are optimistic.
In December, The VIX hit its lowest levels since the beginning of the pandemic. It makes sense that the index did that given the fact that stocks were hitting all-time highs.
Now, we’re seeing a trend of higher readings of the VIX, which tells me that we’re building towards a “correction” event in the broader market.
Two “lines” in the sand to watch on the VIX…
- 15 – We tested this level yesterday, and the market responded with buying. A break ABOVE 15 will draw a bearish reaction from short-term traders as they look to protect gains by selling near highs.
- 18 – We haven’t seen a VIX above 18 since September and October of 2023, and you remember how those two months went (they sucked). A break above 18 will tell us that the market is now in a “volatility selloff,” which will lead to another 5-10% pullback in the S&P 500 and Nasdaq 100.
Bottom Line
As mentioned, Jerome Powell’s testimony and Friday’s Jobs Report will have some heavy bearings on the market’s moves, but for now, these lines maintain the short- and intermediate-term outlook for stocks.
By submitting your email address, you will receive a free subscription to Money Morning and occasional special offers from us and our affiliates. You can unsubscribe at any time and we encourage you to read more about our Privacy Policy.
About the Author
Chris Johnson (“CJ”), a seasoned equity and options analyst with nearly 30 years of experience, is celebrated for his quantitative expertise in quantifying investors’ sentiment to navigate Wall Street with a deeply rooted technical and contrarian trading style.


