Lemon_tm
I’ve had intermittent success shorting gold for years, particularly year-end 2018, March 2020, and H1 2022, though the long gold crowd remains one of the most stubborn groups of investors and also one of the hardest to break. This article will be comprehensively covering the entire global macroeconomic picture and factors that affect gold prices.
First, I will touch on the general portfolio theory of using a short gold position as an ideal market tail risk hedge protecting against a persistent rise in real yields that places downward pressure on equities, bonds, and inflation hedge assets such as commodities and TIPS, thereby denting traditional 401K and risk parity portfolios. The mechanism for this tail risk is, in short, a bond hedge that works in reverse.
Most theory used to protect portfolios in drawdowns now is simply a diversification into a combination of equities, bonds, and inflation hedge assets such as commodities. The problem with that is higher real rates can place downward pressures on all three of the above asset classes so it is not foolproof in certain events.
I propose something entirely different. I advocate for holding a small portion of a portfolio in tail risk hedges that outperform massively in catastrophic global economic events, which have continuously occurred throughout history. I think of it as an insurance policy that should be held all the time and renewed. This could be in the form of deep out-of-the-money options contracts that pay off in the thousands of percent during extremely adverse global economic and financial market scenarios.
I feel it is much more effective than a diversified portfolio because it allows a portfolio to reach for concentrated risk in equities, for example, during good times, knowing the insurance policy of tail-risk hedging options will outperform if the risk-on majority part of the portfolio goes south. Obviously, many of these tail-risk hedges will expire if markets do well, but in adverse scenarios such as financial crises, which many economists view as unpredictable, it protects much better than traditional forms of portfolio diversifications and doesn’t whittle returns from over-diversifying. For many passive investors, what I propose should be a very small part of a larger portfolio that is again, held all the time, rather than diversifying risk (and return) down will still not fully protecting using traditional portfolio theory such as a 60/40 stock/bond portfolio.
Portfolio insurance hedges only pay off a small percentage of times. John Paulson’s housing short in ‘08 was one of the largest returns in financial history. Many compared it to buying flood insurance in a desert- or more aptly what was perceived to be a desert. Consensus perceptions don’t always reflect reality and identifying those small windows is where alpha is generated. This is the logic I’ve played with my entire investment career.
The best forward indicator of gold prices is using inflation-adjusted US T-bond yields as an inverse proxy for gold prices. When inflation-adjusted or real yields go up (inflation/inflation expectations down, interest rates up) gold therefore falls. This intuitively makes sense as gold is an inflation hedge asset that pays no interest, so it struggles to compete when rates rise and inflation falls or stays flat.
We have seen recently the inverse correlation breakdown with real yields rising over 200 basis points (shown below) and gold breaching all-time highs. As for how long this can last, I do not know but it inevitably cannot continue forever. Either real UST yields and the USD fall or gold does as all the above have pushed to elevated levels.
Expected Real 10Y UST Yields (St. Louis Fed)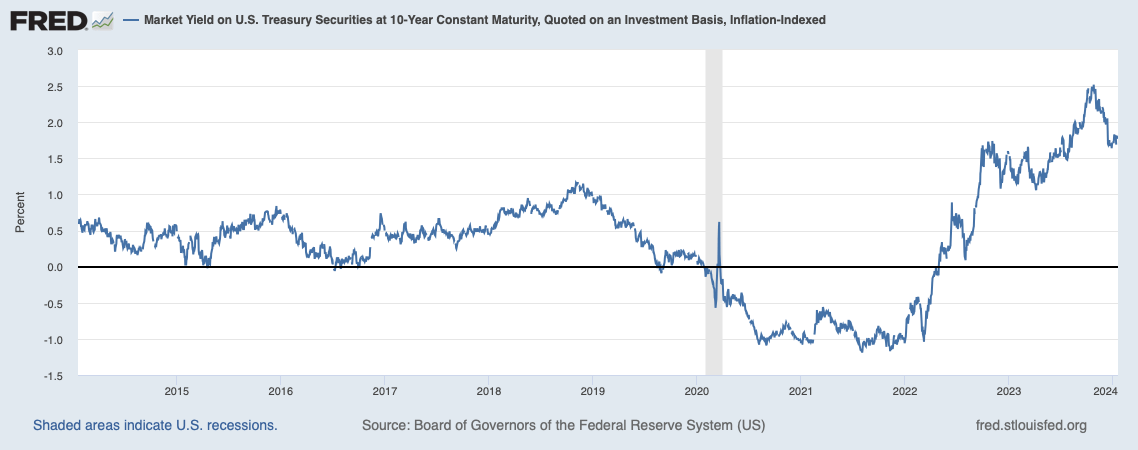
I maintain a 2015 low around $1100 gold price target given the extensive rise we’ve seen in real yields without a corresponding decline in gold. The way gold prices have been able to defy the rise in real yields and a persistently torrid USD is pricing in the transiency of higher expected real yields and tight monetary policy – essentially saying real yields will come down as the Federal Reserve eases an expected (market-implied) 100 to 150 basis points in Fed Fund rate cuts this year.
As shown below, there is 95.4% market implied chance of 100bp of rate cuts or more this year, a 78.8% chance of 125bp of cuts, and a 45.2% chance of 150bp or more cuts. The current target Fed Funds rate is 5.25%-5.50%.
Target Fed Fund Rate Probabilities (CME Group)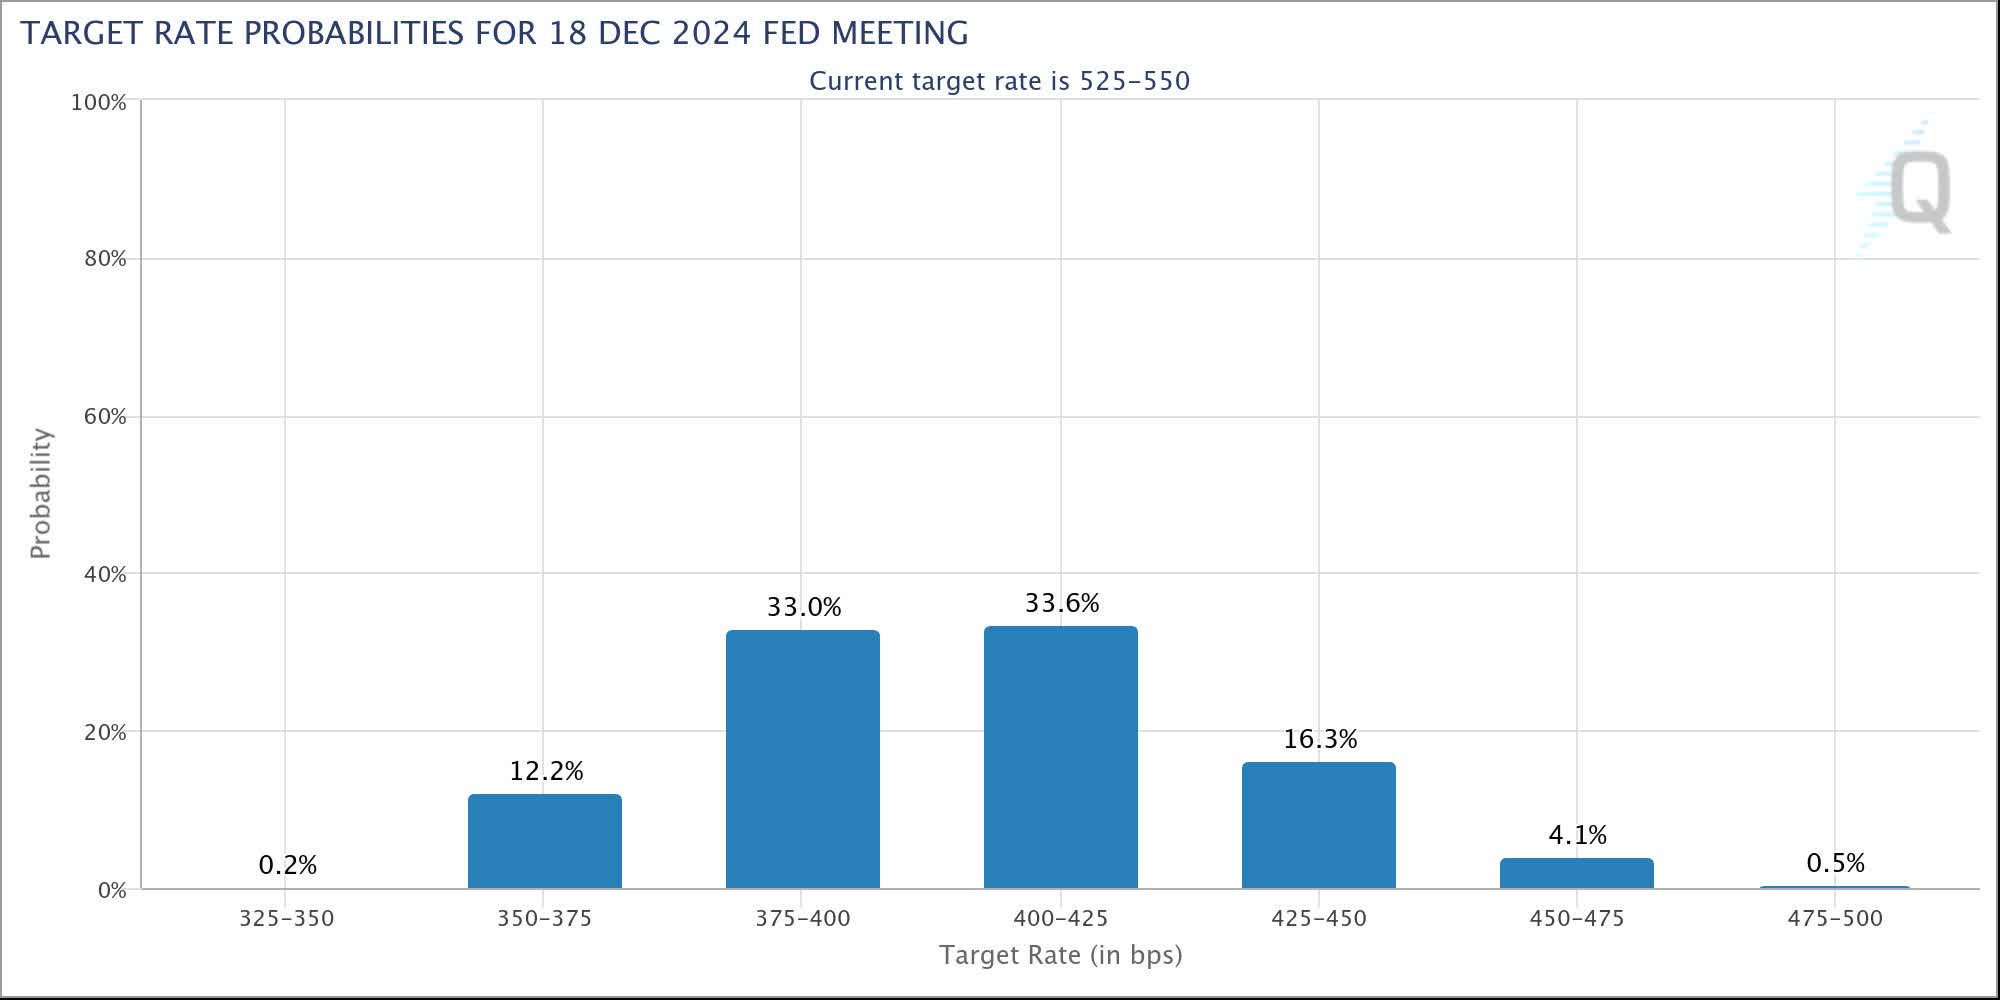
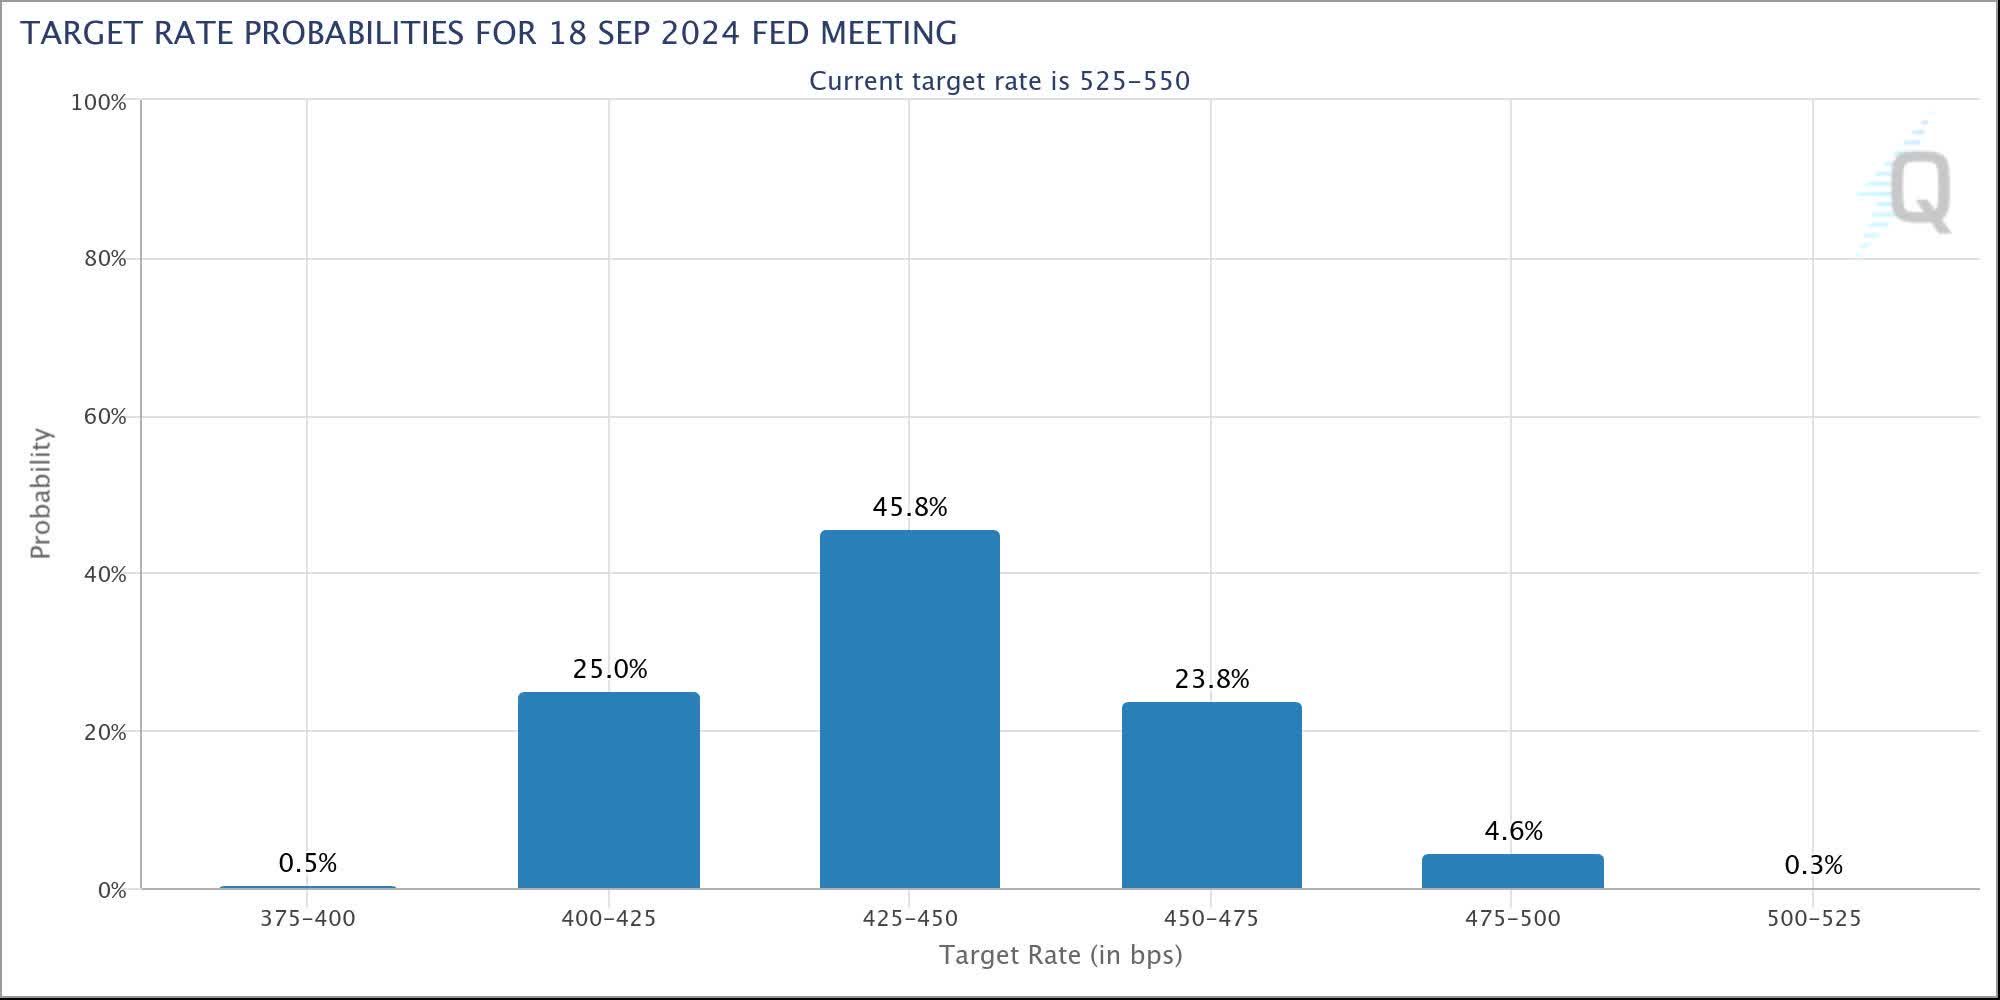
At least one 25-basis point cut is entirely discounted by the June FOMC meeting at 99.4% market expected probability and two cuts by September are priced at a 99.7% probability. The March outcome regarding a 25bp cut is split roughly 50/50. These are pictured below.
June Fed Fund expectations (CME Group) Sept. Fed Fund expectations (CME Group) March Fed Fund Expectations (CME Group)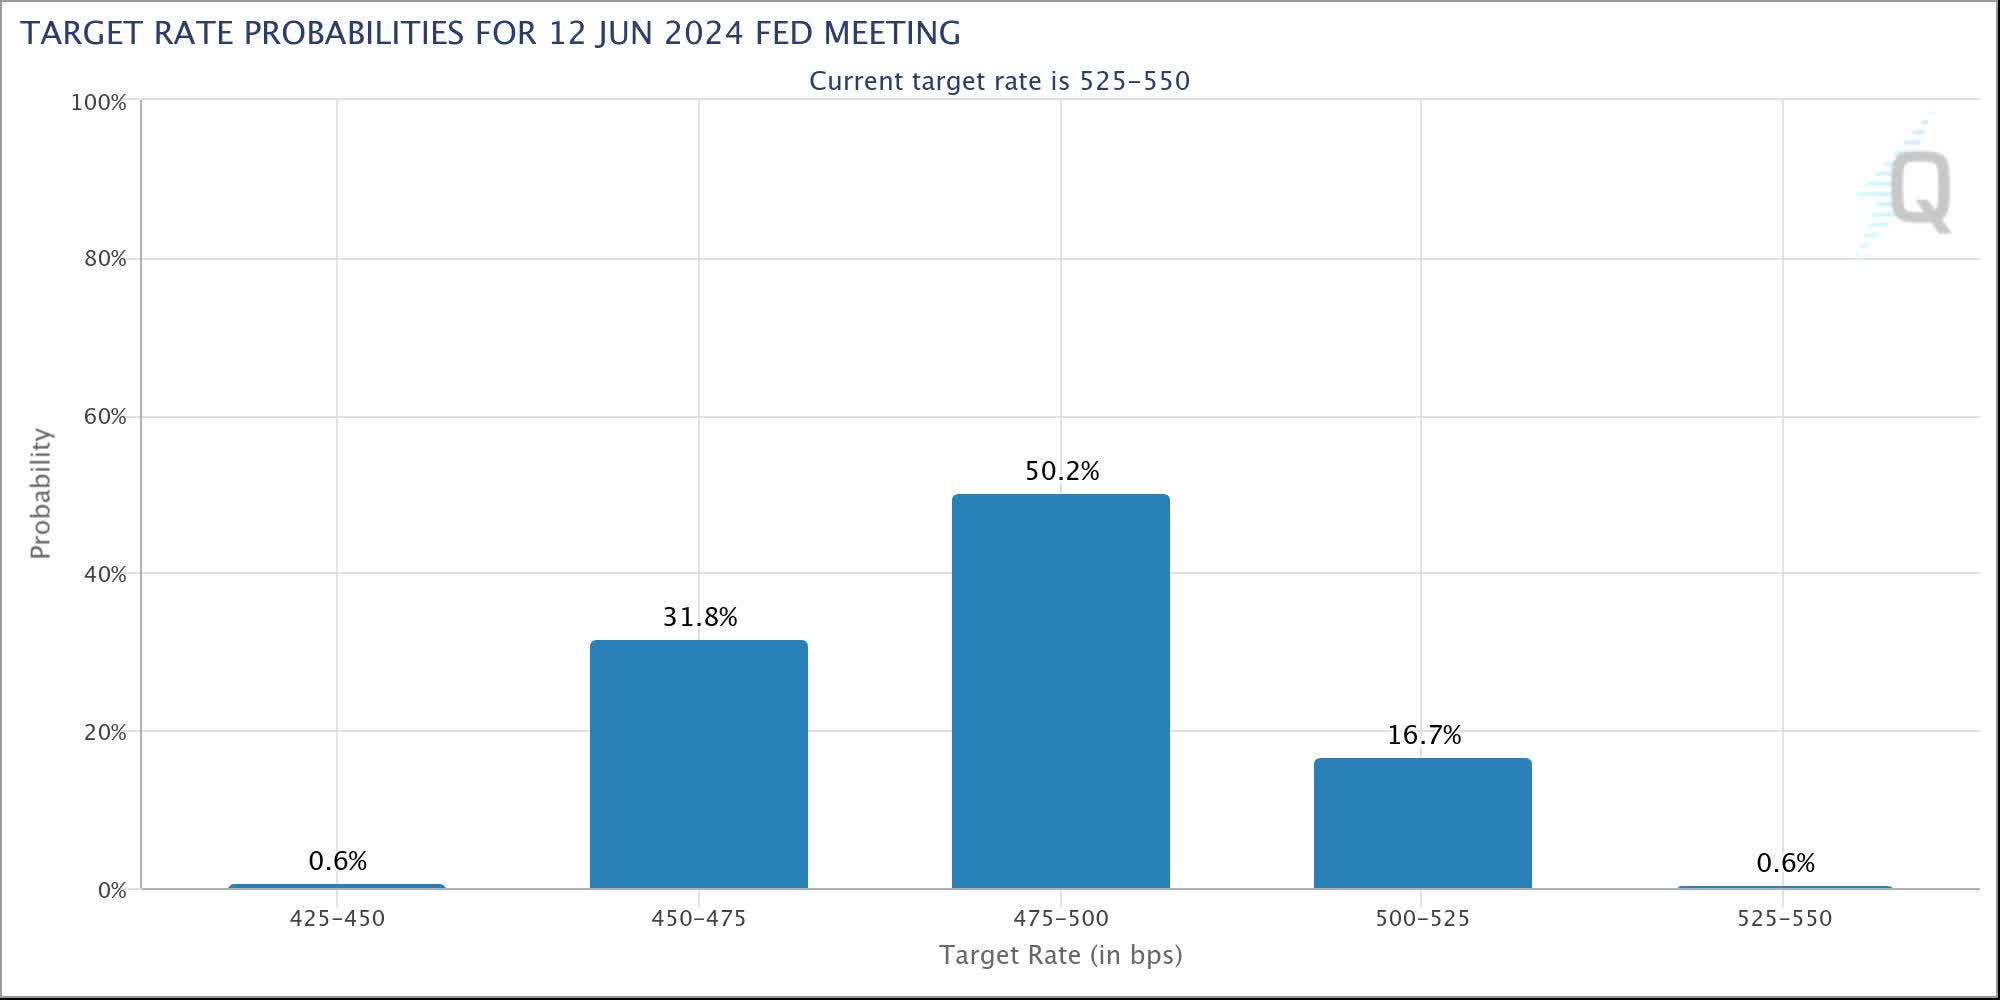

Are these extravagant expectations? The market clearly thinks not. I am more skeptical. I think core inflation in the United States will not cooperate, meaning it will not decelerate below two percent annually, which would allow the Fed to embark on a significant policy easing cycle.
I don’t anticipate a surge in inflation, though I think closing the gap from 3.9% to 2% Core CPI will be the toughest mile. A core CPI above 3.00% is not going to allow over 100 basis points of easing from the Federal Reserve this year. My base case forecast for the US economy is 1%-2% real GDP growth and a core CPI of around 3%-3.5%.
Economist, Larry Summers seems to agree. He said:
I think there’s still a risk that the market is probably underestimating: that we’re not going to quite make as much progress on inflation as people hope, and there’s not going to be quite as much room for Fed easing as people hope.
Famed bond investor Bill Gross has recently called the 10Y UST overvalued at a 4% yield.
I believe the post-pandemic inflation environment in the US is structurally more dynamic, responsive, and higher than the years coming out of the 2008 global recession, and effective lower bound 0% Fed Fund rate era. Many forecasters repeatedly make the case for the death of the Phillips Curve or inverse correlation between unemployment and inflation. I argue that Phillips Curve is always alive. It just chooses to hibernate at times, though given enough time, it will always rear its head.
I will now make the case for a bear-steepening of the yield curve. This is when yields rise across the curve though the back end rises at a faster pace than the front-end. This can be measured by 10Y UST yield minus 2Y UST yields shown below.
10s minus 2s (St. Louis Fed)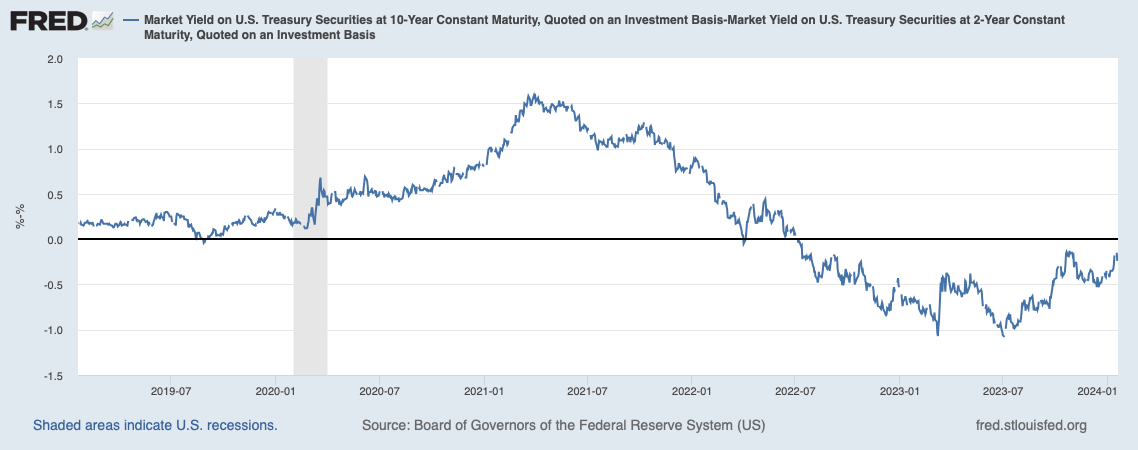
I called for the steepening and eventual un-inversion of the US yield curve in a post in March 2023. Recently, I have reaffirmed the thesis in a separate article that has proved correct and I continue to maintain the view. I wrote:
It looks like the inversion on 10’s – 2’s bottomed in March of this year around a 107 basis point spread. I called this steepening or closing of the inversion since then nearly perfectly. At that point back in March I anticipated a shift upward of the whole curve with the back end rising faster than the front thereby steepening the curve.
The reasoning was front end yield to maturities had become enticing and T-bill yields had already or were reaching escape velocity, meaning yields were high enough to offset duration risk especially compared to the back end and bond investors would reposition to the front end versus the back. I continued to believe markets were underpricing Fed tightening and commitment to holding and not cutting so front end yields would rise albeit less so than the 10Y+ UST yield.
Quantitative tightening meaning less Fed demand for treasuries combined with increased government issuance due to rebuilding the Treasury General Account or TGA after the debt ceiling standoff would create a supply and demand mismatch or gap for treasuries pushing prices lower and yields higher. I also continued to predict a no recession scenario for the US which the data has backed up.
A steeper yield curve goes right along with the idea of a resilient US economy and no recession. Inverted yield curves are often a tool used to predict recessions as a 2Y yield above a 10Y yield can signal monetary policy being too tight and inflation expectations, corporate pricing power, aggregate demand, and economic growth coming down. We aren’t necessarily seeing that in the data.
The US labor market remains healthy. Jobs are continuously being added and although the pace has slowed from unusually high pandemic-induced job-loss recoveries, the trend line has stabilized above previous norms.
US jobs added (St. Louis Fed)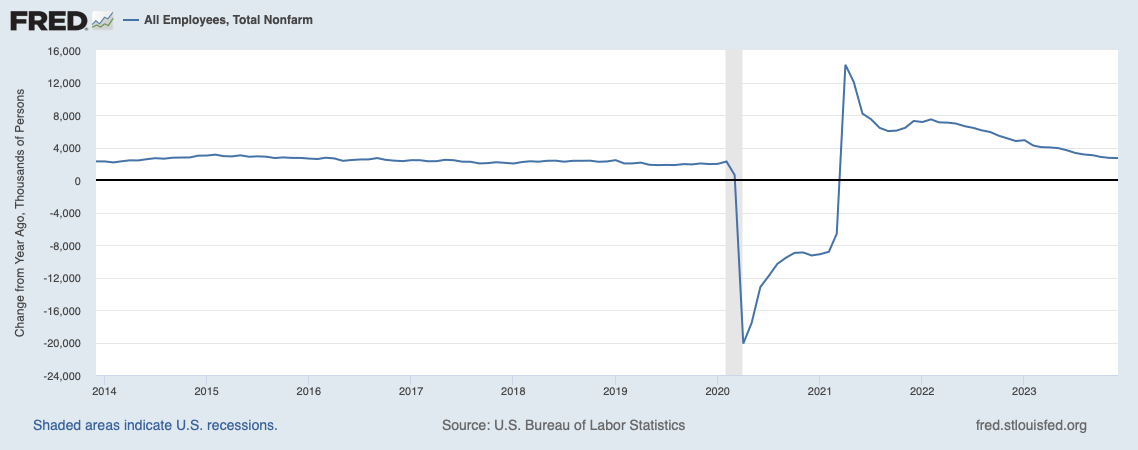
There is also much talk about the US consumer depleting personal savings and how this will weigh on GDP growth. Bank of America CEO, Brian Moynihan, has recently dispelled this and said the US consumer is “in very good shape” in a Bloomberg interview. He also said:
A cohort of consumers that had between $2,000 and $5,000 in their accounts pre-pandemic…..they’re still sitting with about $13,000 in their accounts. It has come down from about $13,400 to $12,800…but it’s still much higher than it was before.
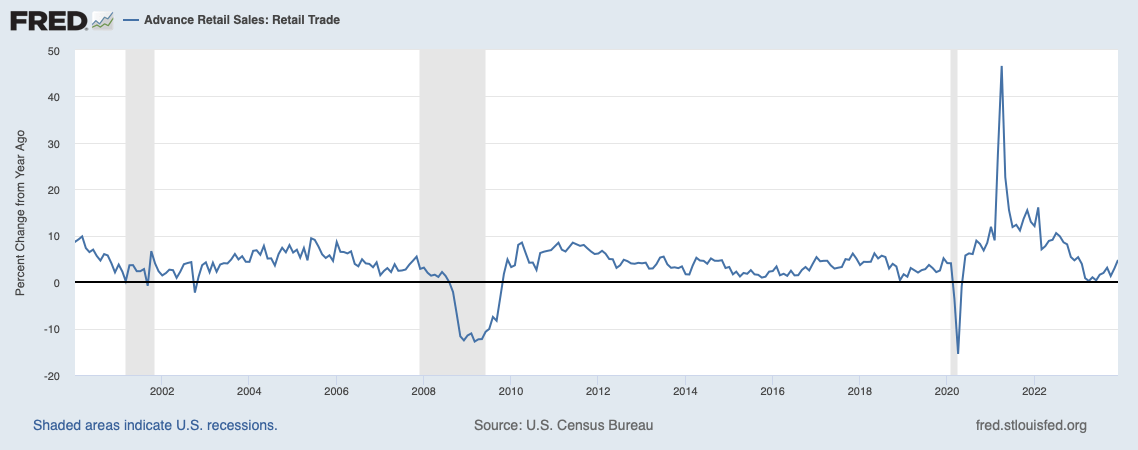
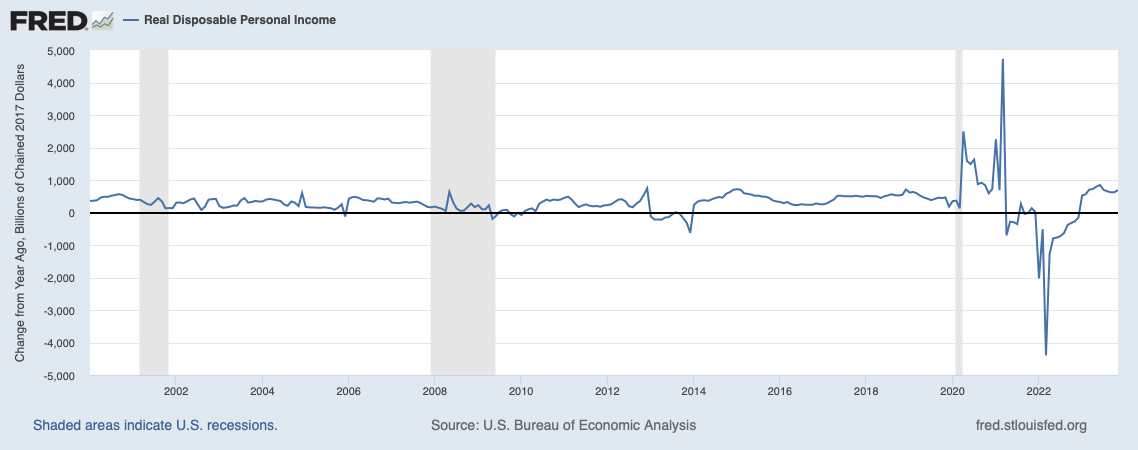
US personal savings, retail sales growth, and disposable income growth are shown below, which support the idea of a healthy US consumer and no recession for the consumption-driven economy of the United States.
Personal Savings (St. Louis Fed) Retail Sales (St. Louis Fed) Real personal disposable income (St. Louis Fed)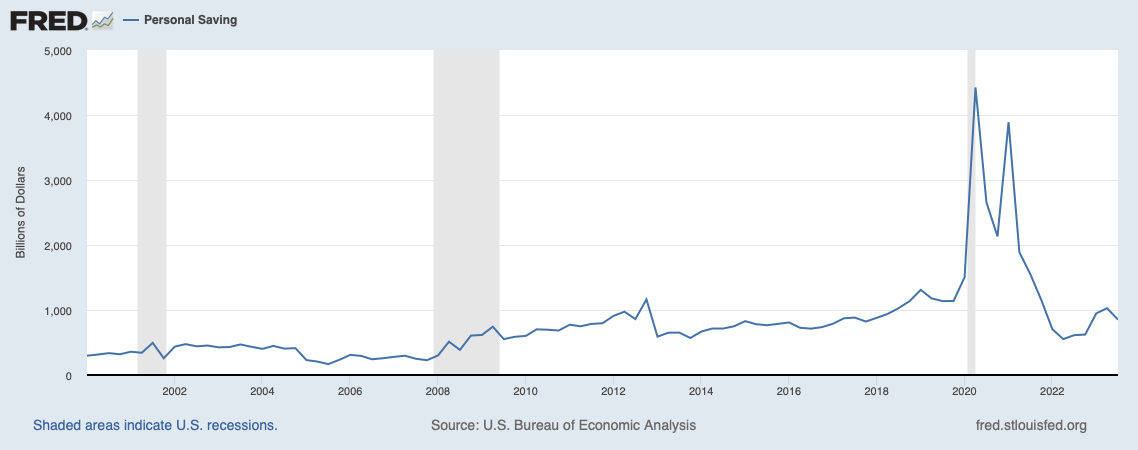
Recently, Christopher Waller of the Federal Reserve advocated moving “carefully” with rate cuts. He stated:
I see no reason to move as quickly or cut as rapidly as in the past.
Raphael Bostic of the Atlanta Fed expects rate cuts to happen in Q3 while Loretta Mester has said March is “probably” too early.
Because the expectations for the 4-6 cuts priced in are so exaggerated in my view, even if the Fed cuts twice or even three times in H2 2024, it won’t have the effect on financial market conditions (real yields, credit spreads, USD value, equity multiples) due to relative expectations of the market not being met.
Gold longs and financial markets generally have gotten away with being very optimistic through preemptive pricing in these large cuts. With the Fed giving in only slightly, the question arises where does the long gold crowd go from here? They could price in seven cuts but the need for such cuts is reduced by the Fed cutting once or twice and thereby averting recession. So I think the road is up for the procrastination of realizing the effect of tightening that has taken place and this reinforces my bearish gold view.
Another way of putting this is the neutral rate of interest – that which doesn’t slow or speed the economy also known as R* has risen post-pandemic. I am in the camp for a soft landing for the US economy though the issue is a soft landing for the economy is not soft for risk assets, financial markets, and emerging market economies/FX, which greatly affects inflation expectations, metals prices, and commodity demand. I will cover this further later in this article.
The problem is financial markets front-running rate cuts make those exact cuts being anticipated even more unlikely. Accelerating core inflation because of easing financial market conditions and a decelerating headline CPI (weak emerging markets and stronger USD) is a deadly combination for risk assets and stocks.
As mentioned above, securities prices across asset classes are priced in 100-150bp of Fed fund cuts this year. This doesn’t only affect bonds. It reverberates through equities, FX rates, corporate credit, and emerging markets. With the USD remaining bid (DXY above 100.00) despite this expectation for cuts, I feel it shows strong fundamental demand for USD.
Next, I will cover emerging market economies and currencies namely China due to the world’s second-largest economy’s effect on inflation expectations and metals demand as well as more generally the shortage of USDs internationally.
China’s explosive growth since around 2000 has provided a tailwind to global inflation expectations (which is beneficial to gold as expected real UST yields are the nominal yield minus the expected rate of inflation with lower or negative real yields being gold price positive) and demand for commodities and metals overall. This explosive Chinese growth has downshifted since around 2018 with the first signs of a slowdown emerging in 2015 in my view. There are deflationary impulses in China. The 10Y Chinese government bond yield has been hovering near a record low, signaling investor concern over the economic strength of China and the ability of PBOC to hold Chinese interest rates steady.
The PBOC (People’s Bank of China) is in a bind. This is due to much of the corporate debt in China being denominated in US dollars with a slowing domestic Chinese economy and over-leveraged banking system.
The problem is that Chinese banking system assets (loans) have far exceeded economic growth. Fixed asset investment in real estate and other corporate capacity supply-side type investment is only creating overcapacity, not an equivalent rate of change in GDP. This can be seen in Fixed Asset Investment growth data outpacing GDP growth. China’s banks are leveraged about 200% of GDP compared to around 60% in the US according to the St. Louis Federal Reserve banking asset to GDP data.
Unless China’s consumer miracle rebalances beautifully, which looks unlikely with a negative wealth effect from housing and stock prices, retail sales under-pacing industrial production and fixed asset investment growth, negative sentiment, and growing unemployment and exports (due to slowing global growth), Chinese banks are going to face an NPL and capital shortfall problem in my opinion. Chinese interbank rates or the interest rate charged for lending RMB from one Chinese bank to another overnight or very short-term have spiked recently.
This means there is a domestic shortage of RMB in the banking system because of rising NPLs. This is symptomatic of the dilemma or bind facing the PBOC. The PBOC can’t print dollars but they can print RMB. Any devaluation in the RMB if they choose to ease or print, wrecks USD-denominated debt service capability. For example, a 10% depreciation in CNY/USD increases debt burdens of Chinese USD debtors by an equivalent 10%.
The PBOC can print RMB and lower PBOC rates to stimulate their economy and recapitalize their banking system, while watching the currency decline, accelerating capital outflows and USD debtor companies fail or let rising interbank rates and NPLs from RMB debtors spike – squeezing the economy into recession and financial system into an NPL crisis. I think the authorities in China will opt for the former, which will provide a significant tailwind to the USD versus the yuan and more generally bullish sentiment in the dollar across the emerging market complex.
I’ve been persistently bearish on China despite many calling for a reopening recovery in late 2022 into 2023. This much-anticipated surge in economic activity has not happened. Their housing market and construction/fixed asset investment-driven economy continue to falter as shown by the increasing incremental capital-output ratio, which measures how much RMB it takes of investment to produce a corresponding unit of output in growth. This is shown below.
Incremental Capital Output Ratio China (Noah Smith)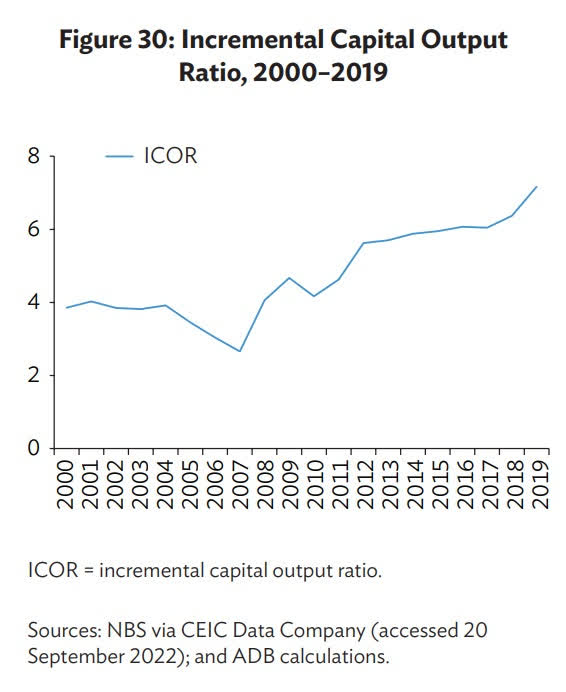
Higher relative US yields such as UST yield premiums over Chinese government bonds (positive spread) are acting as a magnet for global capital, pulling funds out of emerging market currencies into the USD. Emerging market currencies are weakening while USD funding and refinancing are drying up as emerging market economies are hitting a wall of debt maturities according to Bloomberg.
What happens when EM corporates and emerging market central banks such as the PBOC need US dollars? I’ve covered this before and I will quote it below.
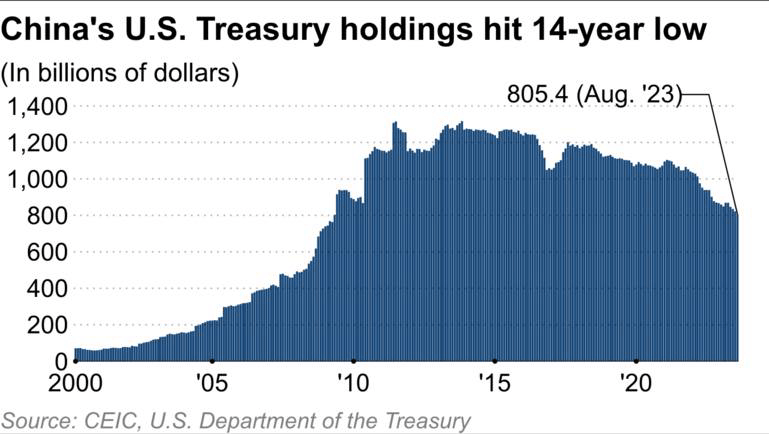
Another issue of EM is the large amount of USD denominated debt where an appreciating USD or acute dollar shortage results in higher debt burdens, forced selling of UST Treasuries to acquire US dollars, higher relative US yields as a result of the en-masse selling of US Treasury bonds held internationally (sold for much needed USDs), and a worsening of the starting USD shortage in a cycle.
According to the Bank of International Settlements, foreign credit in US dollars stood at $13.1T while foreign euro and yen credit are at $4T and $0.3T respectively.
SWIFT payments by currency (Macrobond) China UST holdings (Nikkei Asia Review)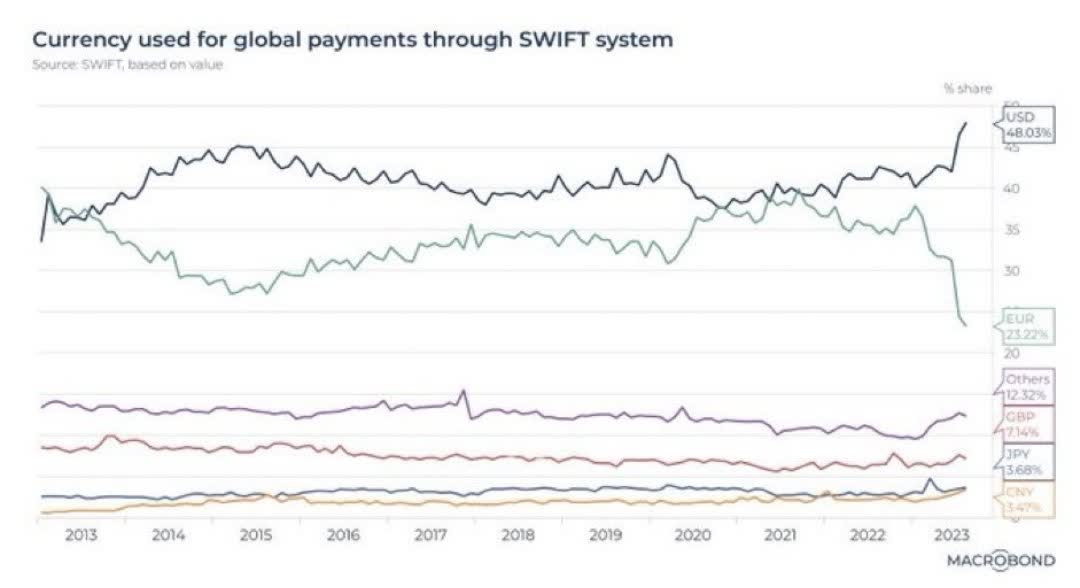
Regarding Europe and EUR/USD, I will very briefly state and I could go into a lot further depth, though recessionary calls in Germany are quickly becoming reality in the data, while that same recession calls in the US remain merely speculative forecasts. This should place downward pressure on EUR/USD and gold as the euro is traditionally a risk-on pro-cyclical global growth currency. I believe it is wise for the ECB to reverse course sooner rather than later. It very much makes sense from their perspective to lower quicker and greater than the Fed.
In other words, why not send the DXY to 120.00 without derailing nominal Euro area GDP growth by cutting rates before the Fed? Thereby sending commodity and input price inflation lower, providing a tailwind to net export competitiveness with a weaker euro, and boosting domestic aggregate demand with lower policy rates – all leading to stronger real Euro area GDP.
Lastly, I will cover the much talked about and often misunderstood Federal Reserve reverse-repurchase facility also known as the RRP market.
RRP (St. Louis Fed)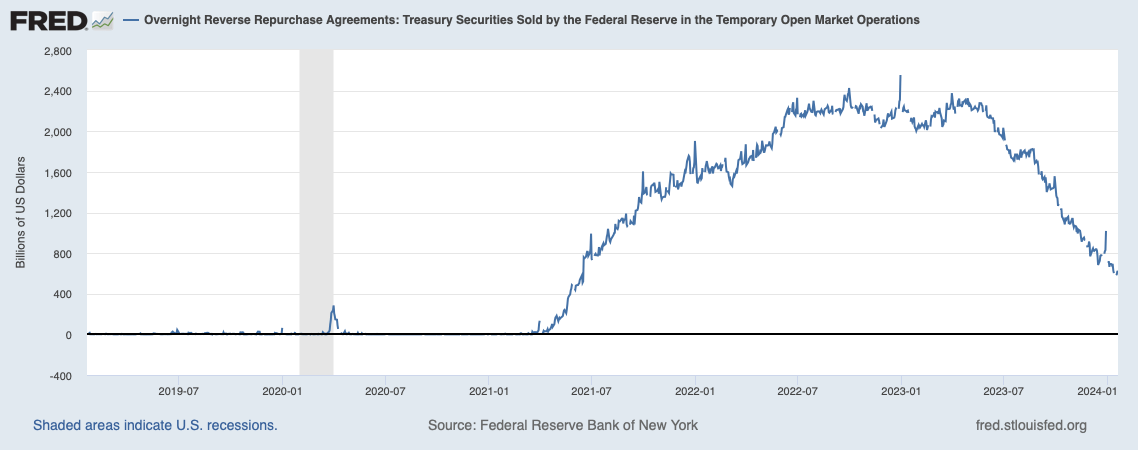
There are two reasons for the drawdown in RRP and neither is particularly bullish for gold. One – greater willingness to take duration risk as rate cuts have become consensus expectations.
USD reserves and UST bonds are essentially counter assets in the US banking system with RRP being the middle ground as dollars are lent on a temporary basis and duration risk is not endured. Reaching for yield in owning USTs did not work out well for banks last time around with the available for sale and held-to-maturity bond portfolios of banks taking hits.
Two – more scarce and greater demand for USD reserves in the US banking system as a result of QT and declining liquidity in the sense even a temporary “park” of reserves in RRP earning a small return is not preferable to owning and holding dollar reserve assets now.
I lean towards scenario two, reserve scarcity being of greater importance and correct though shifting into duration is also a component of the decline in reverse repo balances.
Why does this matter? Because it has to do with when the Fed will taper its quantitative tightening program, which is reducing USD liquidity in the US banking system.
Overnight USD liquidity is tightening up significantly. It reminds me of year-end 2019. The Fed is draining bank reserves through the QT program (not replacing maturing UST bonds held on the balance sheet). A USD shortage seems to be materializing as RRP balances are being drawn down, showing greater demand for USD reserve assets.
The problem the Fed faces with a quantitative tightening taper timeline is nobody knows what level of reserves is the correct amount where they are ample but not too much – so the natural way to approach it is to look for stress in overnight bank funding markets as a tell.
In the previous scenario, at year-end 2019, the pandemic hit shortly after stress emerged in the US banking system (overnight interbank rates spiking) resulting in the Fed dropping rates to zero and resuming printing dollars, providing banks with reserves thereby absorbing bond issuance and oversupply – see balance sheet expansion. We’ll see what the playbook is this time around if USDs become scarce with inflation proving to be a bit higher and more responsive than in 2019 and before as well as no total economic shutdown.
And on that note, I will conclude with a final thought, that is, shorting gold is my personal favorite way to protect portfolios from consensus optimistic views that rely on real US rates falling and almost all subsequent positive effects of easy Federal Reserve policy.

 Q2 2024 Earnings Call Transcript")

