Nerthuz/iStock via Getty Images
What is the most commonsense and enjoyable way to structure your portfolio as a dividend growth investor?
Obviously, one’s investment portfolio should be structured in the optimal way to reach one’s financial goals. But how exactly to do that isn’t necessarily obvious.
For example, if you invest in individual stocks, how do you weight your holdings? Do you try to weight them equally? Do you simply buy more of the stocks that are your personal favorites? Do you end up buying more and more of the cheapest (and probably lowest quality) companies? Can a position size get “too big” or “too small” and need to be rebalanced?
Allow me to humbly proffer a portfolio structure and mental framework that I find optimal as a dividend growth investor. I think this model works well whether an investor is in the “working and accumulating” phase of life or the “retired and withdrawing” phase.
I call it the Galley Ship Portfolio.
imagine a Medieval galley ship that has both rows and sails. Perhaps the most famous example of this is the Viking longship. At some point near the end of the Medieval era, seafaring technology improved to the point where ships used only large sails, but prior to that, galley ships had two forms of propulsion: wind and raw manpower.
If you’re wondering what Medieval boat design has to do with dividend investing, read on.
But first: a little bit of timely commentary on the pursuit of financial freedom in today’s economy.
How Not To reach Financial Freedom
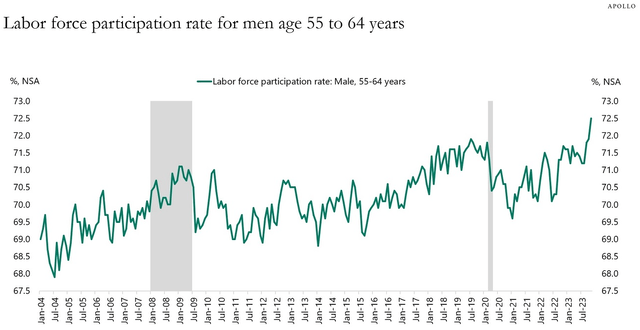
I recently came across a chart showing the labor force participation rate of men aged 55 to 64 and found a fascinating pattern over the last few years.
During the pandemic, as stimmy checks flowed and the stock market surged, many (male) workers in that pre-retirement decade of life decided to hang up the gloves early.
(By the way, the LFPR for women in the same age group did not show a statistically significant reject in 2020 and 2021 (adjusted for the broader drop in employment). Maybe this indicates that women are less attracted to the idea of early retirement? Or women earn less income on average and therefore cannot retire early?)
But then consumer prices began to rise and — for a while, at least — stock prices began to fall. Suddenly, retirement plans based solely on the ability to sell stock at higher and higher prices seemed shaky. As consumer prices rise, one needs more income. But what happens when you need more income exactly as your portfolio value is shrinking?
This nightmare scenario is exactly why:
- I think it is a good idea to evaluate retirement readiness by portfolio income, not portfolio value.
- One should ideally build an additional income buffer above one’s living expenses before retiring, as I explained in “How To Live Off Dividends Forever.”
- One should seek out income streams that are not only as large and safe as possible but also growing at a rate that keeps up with inflation.
If your retirement strategy is simply to withdraw a set amount of your portfolio value over time, or if your portfolio is heavily concentrated in investments with flat income streams (e.g. bonds, preferred stocks, CDs), then you are vulnerable to inflation in one way or another.
I think this explains many of the failed early retirements we seem to see in the LFPR data among 55-64 year old men.
A Suggestion of What Not To Do Today
Keep in mind that the following is just my opinion, not advice.
In my opinion, one of the worst things an investor could do today (dividend seeker or not) is to chase momentum with the 7 red-hot mega-cap stocks that everyone on Wall Street seems to consider “must-own” stocks.
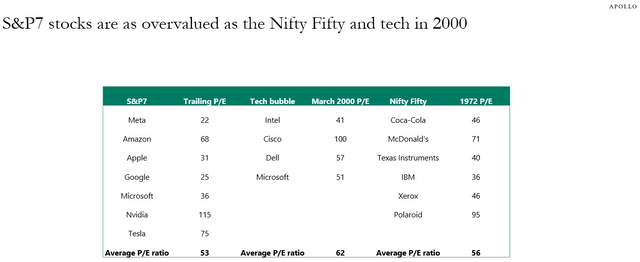
These Magnificent 7, as they have come to be called, may very well be magnificent companies. But that doesn’t mean their valuations are magnificent. Some sport quite rich valuations.
Google/Alphabet (GOOGL) is the cheapest, currently sporting a ~23x P/E multiple as of this writing, followed by Facebook/Meta (META) with a slightly over 23x P/E multiple.
Apple (AAPL) and Microsoft (MSFT) are both in the low 30s in terms of P/E ratios, with the former a tick above 30x and the latter around 33x.
Meanwhile, Amazon (AMZN) and Tesla (TSLA) are in the next league of valuations at 55x and 78x P/E ratios, respectively. When you get into this territory for companies this big, you are dealing with world-changing and almost mythic types of businesses. They’ve accomplished great feats to earn these valuations, but there are so many years of strong future growth built in that they become fragile. Unexpected drops in future growth or their ability to reach their growth potential make them vulnerable to big swings as valuations are adjusted.
Finally, at the peak of Mount Olympus, we find Nvidia (NVDA). NVDA truly is a legendary company. Just since the time the table above was put out about a month ago, its trailing twelve month P/E ratio has plunged from 115x to about 65x even while its stock price has been flat.
How? From incredible growth. In the latest quarter, NVDA grew revenue by over 200% YoY while expanding EPS by nearly 600%.
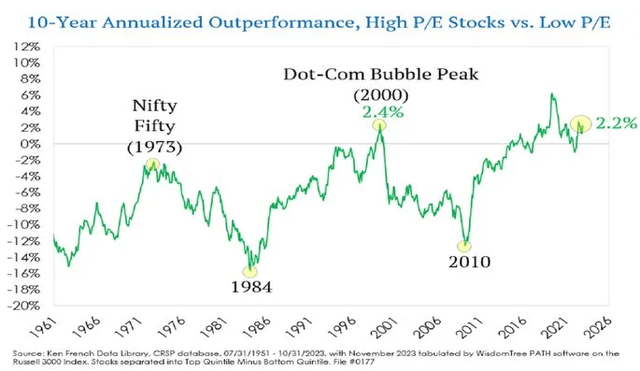
The incredible level of growth put out by the Magnificent 7 indicates that this period in the stock market won’t simply be a repeat of the late 1990s / early 2000s Dot Com bubble… but there may be some similarities.
Even if the Magnificent 7 don’t crash appreciate the (frequently unprofitable) Internet companies of the Dot Com bubble era, their long streak of outperformance could end as the market pauses to give them time to absorb and grow into their rich valuations.
Again, I want to caveat that, for the most part, the mega-cap stocks with high valuations are great companies and deserve above-average valuations.
But it is possible to have too much of a good thing, and to pay too much for a good company.
After all, epic levels of growth don’t tend to be sustainable over a long period of time. NVDA, for example, is expected to turn in EPS this year more than 3.5x higher than the previous year. But next year, analysts expect EPS growth of “only” 60%.
Using the consensus 2024 EPS calculate, NVDA is valued at about a 25x P/E ratio. Not bad, but the point is that the stock’s incredible streak of outperformance recently (189% in the last year compared to 20.5% for the S&P 500) may not repeat.
Maybe… just maybe… these expensive tech stocks will take a breather and allow other types of stocks to take the guide.
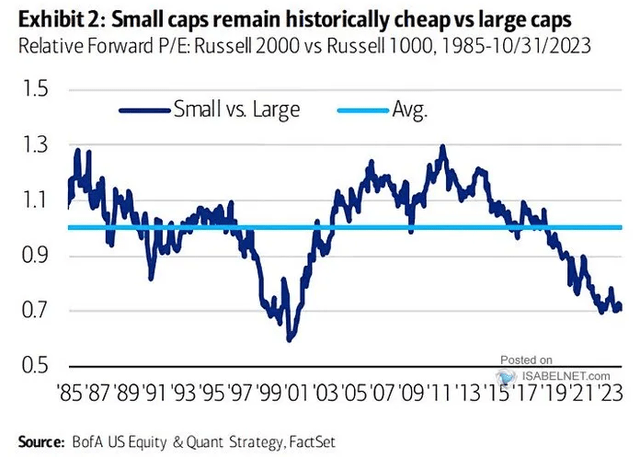
Small cap stocks in the Russell 2000 (IWM), for example, are around Dot Com bubble levels of underperformance against large cap growth stocks.
Large-cap growth is always more expensive than small-cap value, but relative valuations do fluctuate over time. Sometimes small caps outperform large caps. They certainly did from 2000 through 2006.
Let’s drill down to some specific stock sectors that typically harbor dividend stocks.
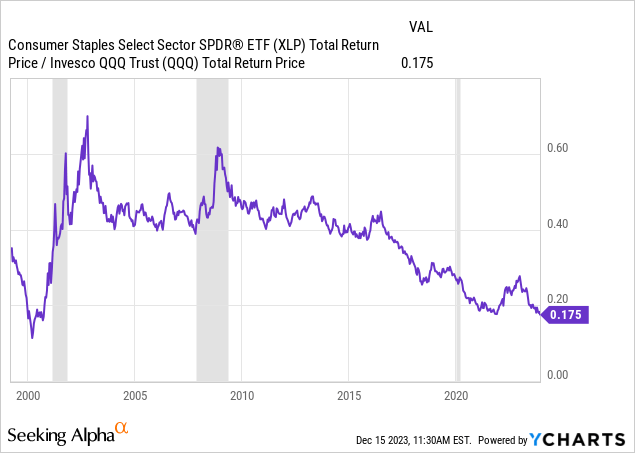
As recently as December 15th, the total return performance of the consumer staples sector (XLP) remains almost as low compared to growthy tech stocks (QQQ) as it was at the peak of the Dot Com bubble in 2000:
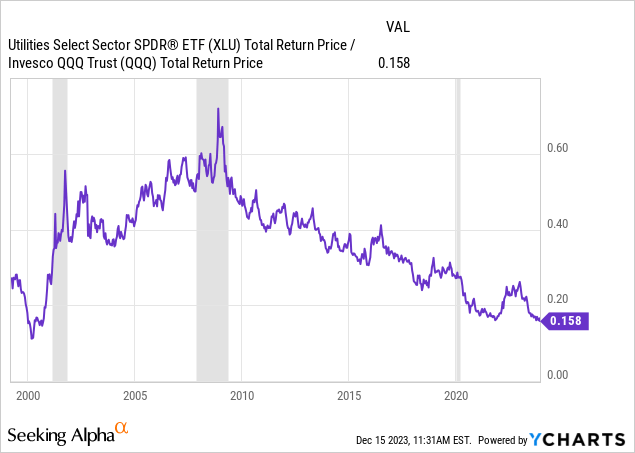
Looking at the utilities sector (XLU), same story:
Finally, we find almost the exact same pattern of relative performance with the real estate sector (VGSIX, VNQ):
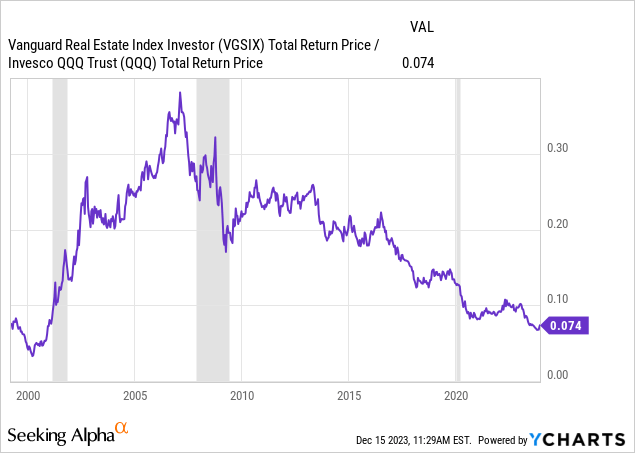
Big Tech’s outperformance over these humble dividend-paying sectors has lasted over a decade. But notice Big Tech doesn’t always outperform!
From the beginning of 2000 (just before the peak in the Dot Com bubble) through the end of 2003, real estate, consumer staples, and utilities all greatly outperformed the Nasdaq’s tech stocks.
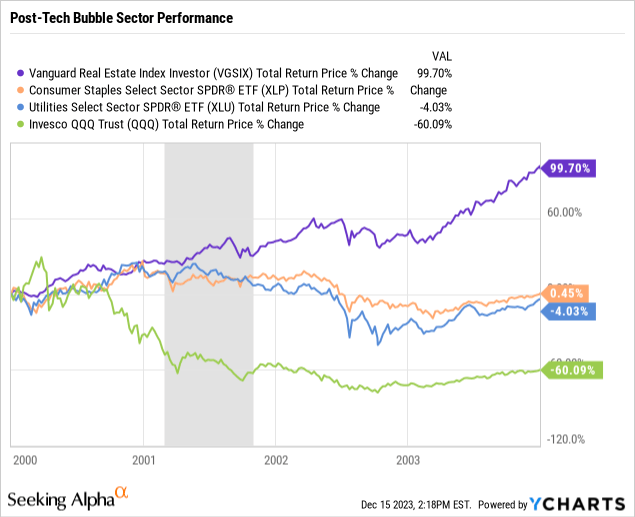
Real estate massively outperformed tech by 160% in total during this period. And while consumer staples and utilities were relatively flat, keep in mind that this was through a recession. In fact, these sectors were slightly rising through the recession and only began to slide a bit in mid-2002.
These three sectors are where I am hunting for that magical combination of quality, value, yield, and dividend growth.
Let’s go back to the original point and try to wrap these threads up in a bow. Retiring early (or at all, for that matter) requires one to have high confidence in their sources of retirement income. I personally wouldn’t want to stake my quality of life and income generation in retirement on richly valued mega-cap stocks continuing to rise in price.
The Galley Ship Portfolio
Financial freedom doesn’t just happen. You may have done very well in the stock market over the last year or so, but can you rely on doing that well every year?
That’s where the Galley Ship Portfolio comes in.
As explained in “How I’m Building A Monster Dividend Portfolio,” there are three basic components of this portfolio model that match to parts of a galley ship.
The ballast is something weighty (often simply rocks) placed in the hull of the boat to enhance its stability.
The rowers are the most basic method of propulsion for the ship. They are nowhere near as powerful as the sails when a tailwind is in place, but they do supply steady, reliable forward motion.
The sails propel the ship powerfully when the winds are favorable, but unlike the rowers, they don’t always work. Sometimes, there are headwinds in place, requiring the sailors to furl the sails.
You may be able to guess how these elements match to an income-oriented portfolio.
| Role | Examples | |
| Ballast | Low-Risk, Low-Beta Income Generation | Dividend ETFs, Treasuries, Investment Grade Bonds |
| Rowers | Steady Income Compounders | Blue-chip dividend growth stocks |
| Sails | Higher-Risk, Higher-Income Plays | 7%+ Yielding Dividend Stocks, Companies With Higher Risk Growth Models, Cyclicals |
This framework doesn’t tell you what stocks to buy. It’s a mental model of how to organize and think about your portfolio. It’s a way of helping you weight the various components of your portfolio based on your goals and risk tolerance.
The Ballast
This component varies based on one’s personal circumstances and preferences, but the fundamental point of it is to supply a foundation of safety and stability in the portfolio. The ballast is supposed to supply some level of reliable income while requiring little to no monitoring.
More conservative investors, or those in or closer to the “withdrawal” phase of their life, often opt for bonds.
The plus side of bonds is the reliability of their income streams. The downside is that their income streams are flat and therefore offer no inflation protection.
Younger investors might therefore consider foregoing bonds in exchange for diversified dividend ETFs with defensive tilts.
In theory, these ETFs should be able to maintain their dividends through most recessions while growing their payouts during economic expansions. This makes them superior to bonds for investors who do not need the income in the short-term.
For me, three dividend ETFs make up my ballast:
- Schwab U.S. Dividend Equity ETF (SCHD) — Offers a 3.5% dividend yield from a little over 100 large, stable, high-quality and mostly defensive companies heavy in sectors appreciate industrials (17.9%), healthcare (15.5%), and consumer staples (12.5%). The expense ratio of 0.06% is ultra-low.
- iShares Core High Dividend ETF (HDV) — Offers a 4.0% yield from about 80 above-average-yielding stocks mostly in energy (20.6%), healthcare (19.4%), staples (14.7%), and utilities (10.5%), all for a low expense ratio of 0.08%.
- WisdomTree U.S. Quality Dividend Growth ETF (DGRW) — Yielding only 1.8%, this ETF is overwhelmingly growth-focused, holding nearly 300 high-growth dividend payers heavily concentrated in technology (31.1%), staples (15.5%), and healthcare (13.3%). The 0.28% expense ratio is modest, and the ETF pays dividends monthly.
The Rowers
The rowers are strong, high-quality, defensive compounders that keep growing steadily regardless of macro conditions. Maybe they grow slower when headwinds are in place and faster with tailwinds in place, but they have solid business models capable of maintaining past growth and generating some new growth year after year.
My two largest individual stock holdings are, in my humble opinion, great examples of rowers.
Agree Realty Corporation (ADC) is my largest holding, as I discussed in “Why Agree Realty Is My Largest Holding.”
The REIT invests in single-tenant, net lease retail properties occupied by the nation’s largest and strongest retailers. These typically omnichannel retailers are among the most e-commerce-resistant and recession-resistant players in the retail space, mostly selling essential goods out of well-located and highly fungible buildings.
ADC December 2023 Presentation
ADC’s business model is basically to issue capital to buy real estate at yields higher than their cost of capital. The difference between their weighted average cost of capital and investment yields is their profit.
As their stock price has dropped and interest rates have risen this year, ADC has nearly run out of dry powder for acquisitions. The good news is that management believes ADC would produce at least 3% AFFO per share growth next year even with zero new acquisitions.
In other words, ADC is still capable of growing even when headwinds are at their worst.
But property yields are creeping up even as ADC’s cost of capital declines, so the REIT will most likely be able to accretive acquisitions next year anyway.
Enterprise Products Partners (EPD), a master limited partnership (read: produces a K-1 form for taxes), is my second largest holding.
It is a giant in the midstream energy space, appropriately headquartered in Houston, Texas. It owns an extraordinarily well located and valuable portfolio of pipelines, storage assets, processing plants, and export terminals.
EPD’s revenue streams are far more stable than the upstream and downstream parts of the energy space, as most of its income comes from take-or-pay contracts in which customers pay fixed amounts for use of EPD’s assets regardless of commodity price or volumetric usage. EPD mostly grows the same way ADC does: by developing new assets funded with relatively cheap capital (courtesy of its BBB+ credit rating) and retained cash.
They make it look easy, generating a gusher of cash with this relatively simple model.
EPD December 2023 Presentation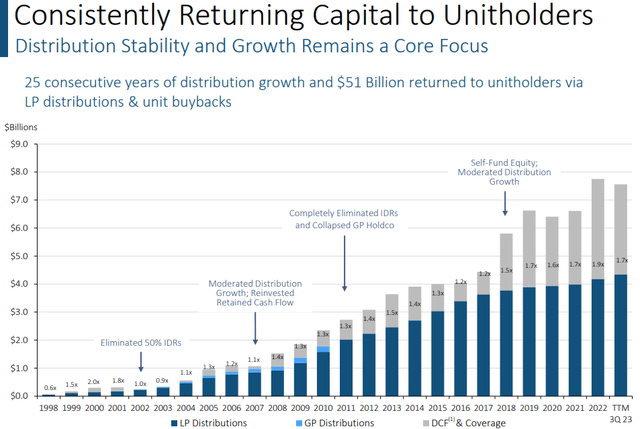
A characteristic trait of rowers, in my estimation, is the ability to consistently invest in assets at higher yields than their weighted average costs of capital.
The Sails
Sails are any stock that offer the promise of high income either today or in the future via strong dividend growth that is based on a higher risk growth model.
I would consider Arbor Realty (ABR), Innovative Industrial Properties (IIPR), Hercules Capital (HTGC), and Trinity Capital (TRIN) to be examples of “sails” from my portfolio. These are calculated risks that I believe will result in very nice payoffs as measured primarily by dividend income and secondarily by total returns.
As I summarized it in “How I’m Building A Monster Dividend Growth Portfolio”:
- NEP has historically relied on low interest rates and steady stock price appreciation to make its heavy use of convertible equity financing work. Management is now transitioning NEP away from this model toward what will hopefully become a more sustainable way of financing the rapid portfolio growth plans.
- ABR is a higher risk way to invest (leveraged lending) in a lower risk asset class (multifamily real estate). You have to trust in the skill of the practitioners for this one. Founder Ivan Kaufman really knows what he’s doing.
- IIPR is the first and only pure-play cannabis REIT traded on a major US exchange, which gives it major competitive advantages as a landlord-financier to the fledgling legal cannabis industry in the US. But it’s no secret that cannabis operators are struggling mightily with competition (both from legal and black market sources) and high costs of capital. Will federal legislation save the day? Who knows. It isn’t the first time cannabis investors have gotten their hopes up.
Another example of a sail that I recently sold at a loss was B. Riley Financial (RILY), a highly volatile small-cap financial services stock with lots of irons in various fires. One of those irons is an investment in The Franchise Group, which owns businesses such as Vitamin Shoppe and American Freight.
Difficulties with some of these businesses has led Franchise Group to look into selling them, which has created a lot of uncertainty around RILY’s nearly 20%-yielding dividend. This situation has made management reconsider the best use of their cash flow and whether that remains paying a dividend. As CEO Bryant Riley mused in a recent investor call:
There’s a change in the macro that I think we as a board, we have to think through and make sure what is the best use. Is the best use to front run some of that and buy a big chunk of stock? Is the best use to continue with our dividend? Is the best use to go buy some of our bonds?
A dividend cut at RILY looks highly likely at this point. But, while it does not offer the same yield, RILY’s baby bond maturing in 2026 (RILYN) has sold off to the point where it now yields 9.2%. This yield, while less than half of RILY’s dividend yield, actually looks safe. And it offers 43% upside to par.
I took the loss in RILY, but I reinvested in RILYN for what I believe to be a much safer income stream until its maturity.
Sometimes “sail” investments work out great. Sometimes they falter and result in a loss of both capital and income. That’s the nature of the beast.
Bottom Line
The Galley Ship Portfolio framework has helped me mentally organize my portfolio in order to deduce how to weight my holdings according to my personal risk tolerance and preferences.
I find it to be the most commonsense and enjoyable way for dividend investors to structure their portfolios for perpetual dividend growth.
Hopefully, it is helpful for you as well.
