marrio31
No recession, but most Americans remain pessimistic about the economy
A recent January 2024 YouGov poll showed that 41 percent of Americans believe we are in a recession, while another 40 percent believe the economy is “poor.” In addition, 40 percent of respondents feel that they are financially worse off than a year ago (read here).
In reality, the economy had steady growth in 2023. The Bureau of Economic Analysis (BEA), in its summary of the 2023 economy, states: “Real GDP increased 2.5 percent in 2023 (from the 2002 annual level to the 2023 annual level), compared to an increase of 1.9 percent in 2022” (read here).
However, if you look at the increase in real GDP from the fourth quarter of 2022 to the fourth quarter of 2023, the increase is 3.1 percent.
This steady growth has resulted in healthy gains in the stock market. The S&P 500 daily close was 3,824 on January 3, the first day of trading in 2023, and closed at 4,770 on December 29, the last day of trading in 2023, a 24.7 percent increase.
One reason for the lack of consumer enthusiasm is that most people fail to see benefits from the drivers of growth. Referring to the articles cited above, the BEA attributes the increase in 2023 growth primarily to:
- “… consumer spending … increases in services (led by health care) and goods (led by recreational goods and vehicles).”
- “… nonresidential fixed investment (led) by increases in structures and intellectual property products.”
- ” … state and local government spending (led) by in gross investment in structures and compensation of… employees.”
- “… exports (led) by increases in both goods and services.”
- “… federal spending (led) by increases in both nondefense and defense spending.”
People who are spending more for health care services probably don’t connect their ill health, or the increasing cost of health care services, to an increase in utility (although I’m sure the consumers who bought “recreational goods and vehicles” did). The other items on the list may have helped drive the economic growth in 2023, but for most people the benefits may have been indirect or limited and not easily recognized.
On the other hand, according to the BEA, the most significant negative factor was a “… decrease in residential fixed investment mainly [led by] a decrease in new single-family construction as well as brokers’ commissions.”
Now this is something that is front and center for most people, and whatever happens to make housing less affordable has ramifications for the rental market.
Getting into a home or apartment has become more expensive.
- Apartment rent is expected to lessen in 2024, but rents remain about $200 higher than two years ago (read here)
- Millennials and Gen Zers, who are at, or reaching, the prime age for home ownership, are struggling to buy homes (read here)
- Recent homeowners, due to higher mortgage rates, are paying more of their disposable income for mortgage, property tax, and insurance
Another cost that is front and center for consumers is the cost of automobiles. For example, although used car prices are also moderating, prices are much higher than two years ago. Cox Automotive reports that the average current list price for a used car in December 2023 was $26,091, compared to an average listed price of $20,000 in 2019.
Lastly, the lingering effects of inflation still impact a large number of products (i.e., groceries) and services (i.e., eating out).
These examples help explain why, as noted at the beginning of this article, 81 percent of Americans believe we are in a recession or believe the economy is “poor,” and 40 percent feel that they are financially worse off than a year ago.
The current business cycle
To better understand the complexities of current economic conditions I will be looking at the BaR Analysis Grid, which helps identify the good and bad features of our recent and current economy. If you are not familiar with the BaR, you can read more about it here.
The BaR tracks 18 economic indicators that include economic measures and sentiment indexes that track closely with the ups and downs of the business cycle (to see how each indicator rises and falls during a business cycle go here).
One of the key benefits of the BaR is that it illustrates the progress of a business cycle. A vital point on the BaR is the MoC (mean of coordinates), the average of all 18 indicators, which rises as a business cycle begins, eventually peaks, declines as the business cycle ages, and finally indicates when the economy is likely to fall into a recession. A list of all of the measures and their abbreviations is shown at the end of this article.
Grid 1 shows how the current business cycle has been plotted on the BaR Analysis Grid, beginning in the first quarter of 2020 and ending in the fourth quarter of 2023. On Grid 1, the MoC is tracked on a rolling three-month average.
The baseline – middle, horizontal line – shows where the MoC is likely to be when a normal business cycle recession is approaching. So, yes the MoC (green point) is in a position that shows the economy is vulnerable to a recession.
As seen in Grid 1, the MoC hit bottom in 2Q 2020 during the Covid shutdown. It recovered quickly in 3Q 2020, moving into the Expansion Quadrant. The MoC continued in the Expansion Quadrant until 4Q 2021 when it reached its peak. Notice the large leftward swings in the MoC in 1Q 2022 and 2Q 2022, which correspond to the negative GDP growth during those two quarters. Because the MoC is calculated with sentiment indicators, and some indirect economic measures (i.e., yield curve spread) it doesn’t always track perfectly with GDP, but for the most part the two move consistently together (in a month or so, I will be adding to the Econ P.I. website a MoC calculated solely on direct economic measures, which I hope will help in my research on the relationship between the economy and the stock market).
Grid 1
Source: www.econpi.com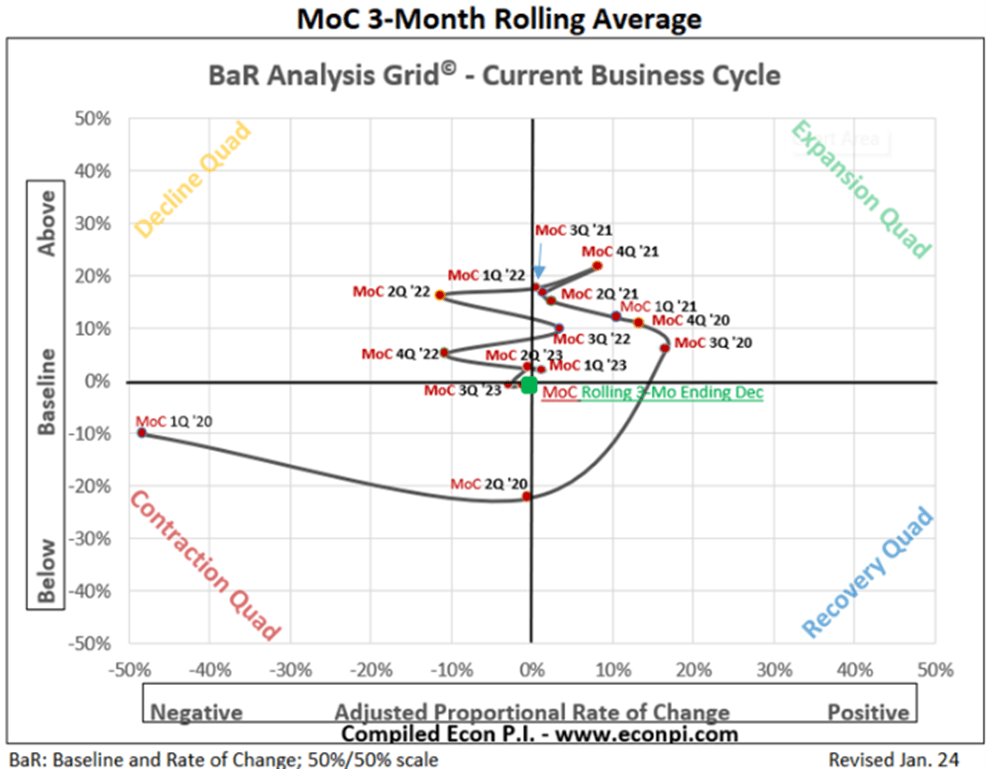
Since 4Q 2021, the MoC has been declining, and it is now at the baseline. However, as I will show shortly, not all economic indicators used on the BaR have declined to the baseline. The devil is in the detail. (To see how other business cycles have been displayed on the BaR, go here.)
The grid may seem to contradict the growth that we have seen in 2023, but the upcoming analysis will seek to explain this.
(Importantly, the Decline Quadrant is not negative growth. Instead, points plotted here have a positive, but slowing growth rate from one period to the next. Points plotted in the Expansion Quadrant have a growth rate that has increased from one period to the next.)
Current BaR Analysis Grid
To understand the strengths and weaknesses of the current economy, it helps to look at the separate economic indicators that are plotted on the BaR. Grid 2 shows the most recent BaR, with the positions of its 18 economic indicators, as well as the MoC and leading indicators (LD).
Grid 2
Source: www.econpi.com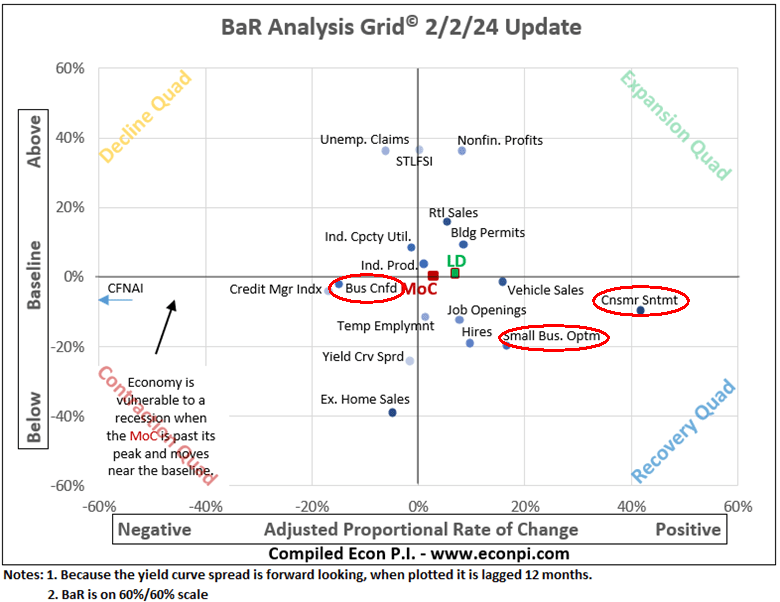
On Grid 2 I’ve circled the sentiment measures used on the BaR: OECD Business Confidence Index, NFIB Small Business Optimism Index, and University of Michigan Index of Consumer Sentiment. Not only is consumer sentiment at a level normally seen during a recession, but the outlook of business owners and managers is too (consumer sentiment has increased significantly over the past two months, which I will address later).
To better understand Grid 2, Table 1 shows the percentage that each indicator is above or below the baseline (approximate recession threshold). Eleven economic indicators are below the baseline and seven are above. This places the average of the plotted points, the MoC, at the baseline. The LD plot on the grid is the average of the leading indicators. The nine measures used as leading indicators are identified in the table.
Table 1
Source: www.econpi.com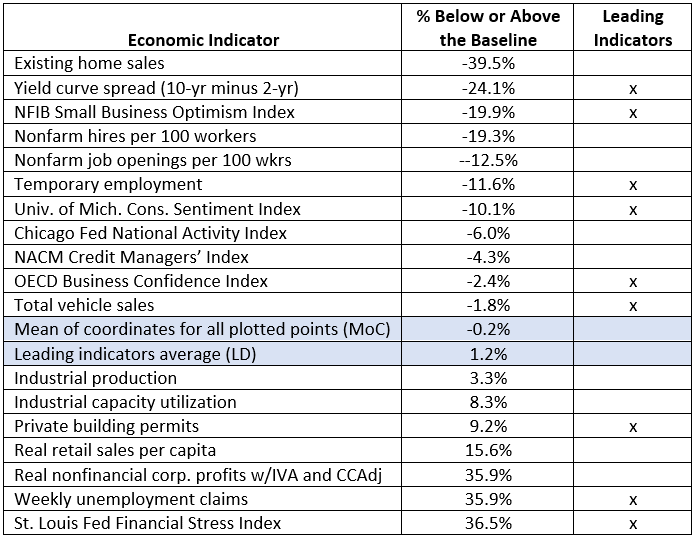
Grid 2, and the corresponding Table 1, shed light on why we haven’t fallen into a recession. The four measures farthest from the baseline – STLFSI, weekly unemployment claims, real nonfinancial corporate profits, and real retail sales (including food services) per capita – are usually near the baseline when a recession is imminent.
Economic conditions prior to past recessions as shown on the BaR
Looking at previous business cycle recessions (the Covid shutdown does not qualify as a business cycle recession), we can see the contrast between current economic conditions and those that have preceded recent recessions. However, one caution is needed. Although there are similar patterns when a recession starts, some economic measures that drop early prior to one recession may be more resilient in the next recession. Still, the four indicators identified in the last paragraph will generally show weakness just prior to a recession.
Grid 3 shows the BaR one month prior to the 2007 – 2009 recession. I’ve circled weekly unemployment claims, the STLFSI, nonfinancial corporate profits, and real retail sales per capita. Nonfinancial corporate profits are below the baseline and retail sales are approaching the baseline. The STLFSI and weekly unemployment claims are slightly higher, but well below where they are on the current BaR grid (Grid 2). Also, although not circled, notice that consumer sentiment and small business optimism are below the baseline in the Contraction Quadrant. They too are normally near or below the baseline when a recession is nearing.
Grid 3
Source: www.econpi.com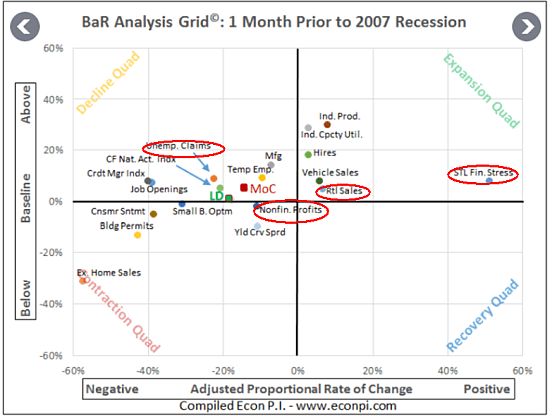
In Grid 4, which shows the BaR one month prior to the 2001 recession, we see a similar pattern, except in this case, the four indicators are at or below the baseline. Consumer sentiment and small business optimism are both approaching the baseline.
Grid 4
Source: www.econpi.com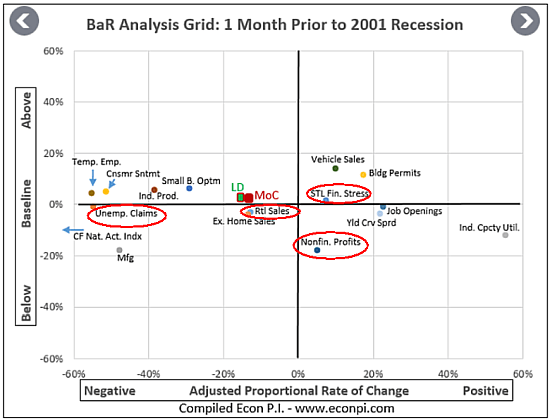
Next, Grid 5 shows the BaR one month prior to the 1990 – 1991 recession. Here we have a similar pattern. However, neither the STLFSI nor retail sales were being tracked in 1990. Retail sales weren’t tracked until 1992, and the STLFSI wasn’t created until 1993. Still, the two indicators that were tracked – nonfinancial corporate profits and weekly unemployment claims – are signaling recession, especially nonfinancial corporate profits, which are well below the baseline. Also, as expected, small business optimism and consumer sentiment are approaching the baseline.
Grid 5
Source: www.econpi.com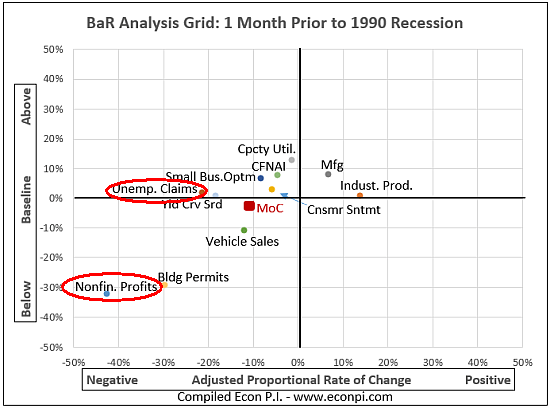
Lastly, Grid 6 shows the BaR one month prior to the 1980 recession (and things looked similar prior to the sister 1981 recession). Fewer economic indicators were tracked in 1980 than 1990, but weekly unemployment claims and nonfinancial profits were and both were definitely signally a recession was at hand. In addition, consumer sentiment was very negative, which is not surprising since inflation, measured by chained PCE, had been running above 10 percent and was beginning to approach 12 percent. Data for the NFIB Small Business Optimism Index only goes back to 1986, so it cannot be plotted on this grid.
Grid 6
Source: www.econpi.com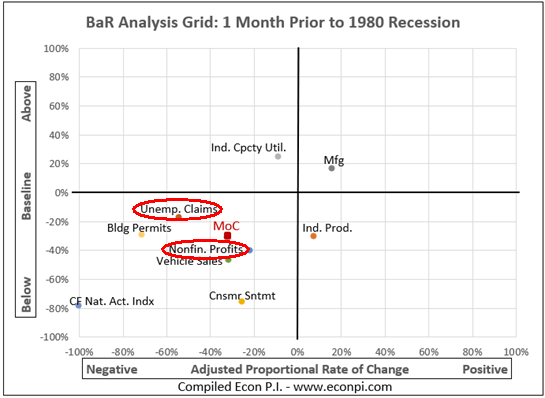
The contrast between Grid 2, in which weekly unemployment claims, the STLFSI, real nonfinancial corporate profits, and real retail sales per capita are well above the baseline, and Grids 3, 4, 5, and 6, where these indicators are generally near or below the baseline, clarifies why we haven’t yet seen a recession, and maybe will not.
For convenience, I’m showing Grid 2 again. As shown:
- Financially, corporations are relatively healthy
- The number of laid-off workers seeking unemployment benefits remains historically low
- Financial stress as measured by the STLFSI is low
- Retail and food services spending remains healthy
Other indicators above the baseline are private building permits, industrial capacity utilization, and industrial production.
Grid 2
Source: www.econpi.com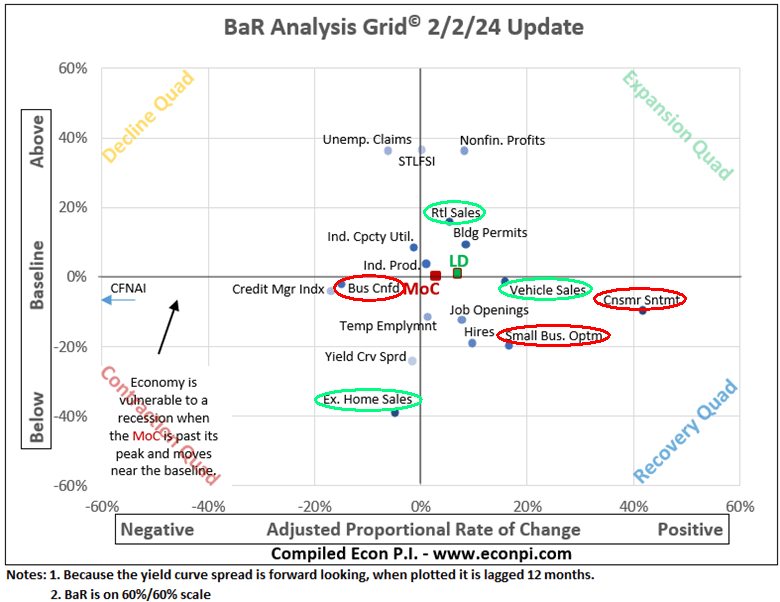
Regardless of these positive factors, the sentiment of consumers, business owners and managers is at levels normally seen during a recession (red circles). And, despite the health of retail sales, other consumer measures – vehicle sales and existing home sales – are languishing (see green circles). In addition, there are still a number of other measures below the baseline: nonfarm job openings, nonfarm hires, temporary employment, and the 10-yr/2-yr yield curve spread (more on the yield curve later).
If we remove the sentiment measures from Table 1, we can see how much influence the pessimism of consumers, business owners, and business managers has on the MoC. As shown in Table 2, the MoC does move to 3.4 percent above the baseline, but this is still recession territory, just a little less so. It isn’t just the pessimism of consumers, business owners, and business owners that is pulling down the MoC. There are weak sectors in the economy, the economy is in a vulnerable place.
Table 2
Source: www.econpi.com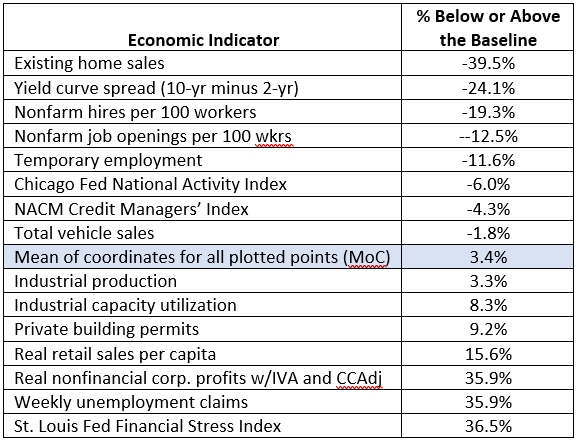
(I’m not showing the leading indicators in Table 2 because I’ve removed three of the nine leading indicators, which makes this measure less meaningful. Besides, it is ultimately the MoC that is used to determine when a recession is likely to occur.)
Recent trends
To understand recent trends, Table 3 shows the percentage of each economic indicator plotted on the BaR above or below the baseline, and the amount of change (by amount, not percentage) over the past three months and year.
Table 3
Source: www.econpi.com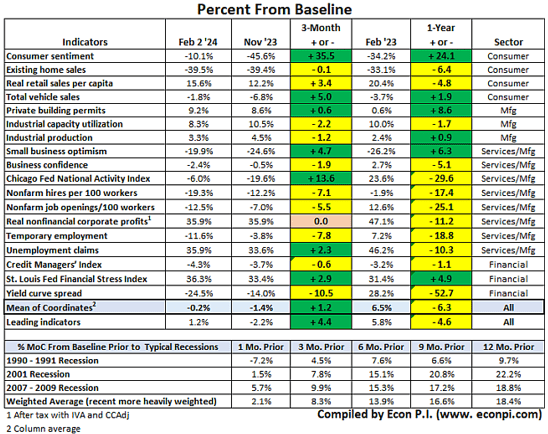
There have been four notable positive shifts among the economic indicators.
- Consumer sentiment jumped dramatically in the past three months, going from 40.6 percent below the baseline in November 2023 to 10.5 percent below the baseline at the end of February 2024.
- Total vehicle sales have improved over the past year, going from 24.3 percent below the baseline in February 2023 to 1.8 percent below the baseline in February 2024.
- Small business optimism has also shown some improvement, moving from 28.2 percent below the baseline in February 2023 to 19.9 percent below the baseline in February 2024.
- The Chicago Fed National Activity Index increased from 19.6 percent below the baseline in November 2023 to 6.0 percent in February 2024. However, the CFNAI has been rather erratic since the pandemic, and while still useful, I have assigned a lower weight to this measure.
However, all four of these indicators remain below the baseline.
In addition, both the MoC and leading indicators showed positive changes. In three months, the MoC improved from -1.4 percent to -0.2 percent, and the leading indicators increased from -2.2 percent to 1.2 percent.
Yet, overall, if we look at all of the economic indicators shown in Table 3, the trends over the past three months and years are mixed. Over the past three months, 10 of the indicators have had negative trends, seven have had positive trends, and one is unchanged. When compared to February 2023, only five of the measures had positive trends.
Will there be a recession?
The economy could weaken more and move towards recession, but as Table 3 shows, there have been some favorable trends in the past three months. If there is going to be a recession then corporate profits, the STLFSI, weekly unemployment claims, and retail sales will begin to move towards the baseline.
The Federal Home Loan Bank of New York has developed a helpful chart showing the causes of recessions (Table 3). Of the “primary drivers” shown in this table, at this point in time, only monetary policy would be a likely cause of a recession due to the Fed’s recent aggressive rate hikes.
Table 3
Source: Federal Home Loan Bank of New York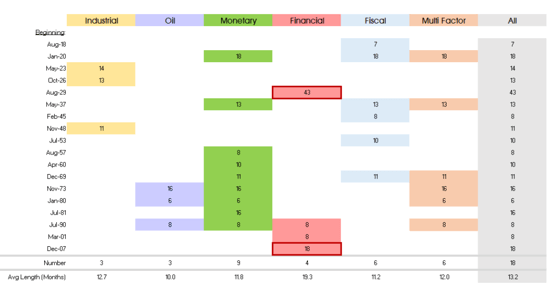
On the financial side, some concern has been expressed about the increase in consumer loan and credit card debt delinquencies, but though rising, the delinquency rates are below historical levels.
Oil could become a factor, but the current administration has quietly allowed U.S. oil production to reach new highs (see graphic here), drawn from the oil reserves, and is doing all it can to keep oil flowing from the Mid-East despite the area’s tensions (read here).
Monetary policy
Since early 2022, the Fed has raised interest rates to combat inflation, but prior to that time, there was a significant increase in the money supply.
Looking first at the Fed’s manipulation of interest rates since 2022, Chart 1 shows the Federal fund’s effective rate and the 10-year minus 2-year yield spread. As has been well documented since the 1960s, the 10-yr/3-mo spread inverts prior to a recession, as does 10-yr/2-yr spread. I wrote an earlier article that shows how the 10-yr/2-yr spread inverts prior to the 10-yr/3-mo, and stays inverted longer (read here). For this reason, and the fact that the 2-year rates are driven more by market forces, I favor the 10-yr/2-yr spread.
Chart 1 shows the well-established pattern of the federal funds rate being increased during the latter part of a business cycle, when inflationary pressures are more evident, which is a factor in the inversion of the yield curve spread (green rectangles; the Covid shutdown isn’t relevant to this analysis).
Chart 1
Source: Federal Reserve Bank of St. Louis, 10-Year Treasury Constant Maturity Minus 2-Year Treasury Constant Maturity [T10Y2Y], retrieved from FRED, Federal Reserve Bank of St. Louis; https://fred.stlouisfed.org/series/T10Y2Y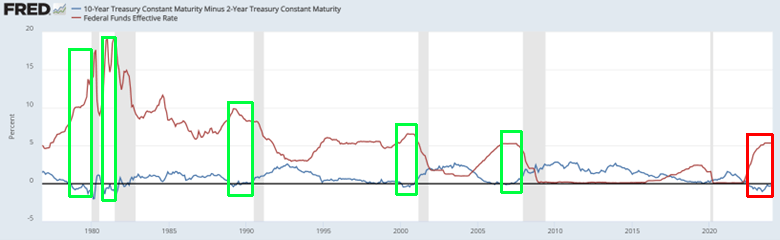
From the time that an extended inversion of the 10-yr/2-yr curve starts, recessions have generally begun about 16 to 18 months later (read here). However, the current 10-yr/2-yr inversion began in early July of 2022, 19 months ago. This inversion is already different than anything we have seen since two-year Treasuries were first sold.
Due to Fed actions over the past two years, within the red rectangle, there is a similar pattern to what we see in the green triangles. Perhaps this time is different and a recession won’t follow this extended yield curve inversion, but we won’t know until we know.
Monetary stimulus
A significant event during and after the pandemic was the increase in the money supply. A recent article by the St. Louis Fed illustrates how M2 grew at record rates from February 2020 through February 2021. During this time, the Fed was pulling out all stops to avoid a credit crunch. The growth rate for M2 declined in 2022 but was positive for most of the year (Chart 2 – be aware that the percent change on the left axis is much larger than the right axis; read the article here).
Chart 2
Source: Federal Reserve Bank of St. Louis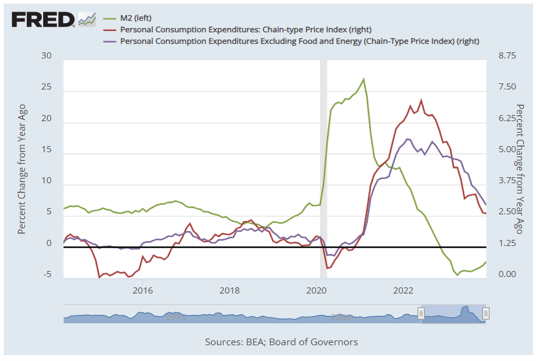
From a money demand standpoint, due to the uncertainty caused by the pandemic, it is well known that consumers were stockpiling money in 2020 and 2021. Money velocity dropped sharply during this time as consumers saved more and spent less (Chart 3).
Chart 3
Source: U.S. Bureau of Economic Analysis, Personal Saving Rate [PSAVERT], retrieved from FRED, Federal Reserve Bank of St. Louis; https://fred.stlouisfed.org/series/PSAVERT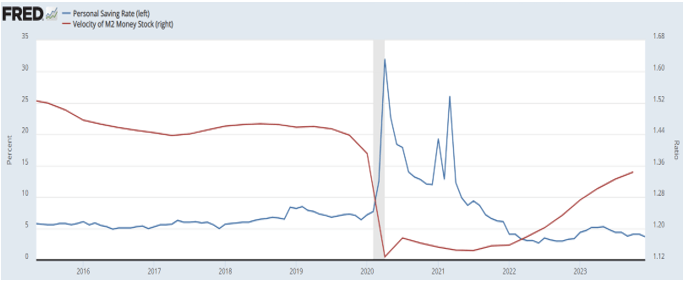
As pandemic restrictions on the economy eased, consumers began to spend their cash, pushing up prices. Supply chain problems added to the escalation of the prices for goods and services.
Going back to Chart 2, in 2023, M2 has had negative growth. The effect of the 2020-2021 monetary boost may have mostly run its course, which seems evident in the decrease in inflation.
However, the Fed still has a balancing act. The Fed didn’t cut rates recently because it remains uneasy about inflation (read Jerome Powell’s recent 60 Minutes interview here). But, keeping rates high may be more damaging now that the growth of M2 has slowed.
What does this mean for the stock market?
Nothing affects the health of the stock market more adversely than a recession (read here).
Due to the mix of positive and negative factors shown on the BaR, there seems to be little likelihood of a recession anytime soon. Before a recession happens, we need to see a significant decline in corporate profits, with a corresponding increase in weekly unemployment claims. In addition, financial stress would need to increase and retail spending would need to soften. All of this would take time to unfold.
However, I think we are at a critical point. The extreme monetary stimulus and low interest rates of 2022 and 2021 are over, as is the pandemic fiscal stimulus. Personal savings and money velocity are moving towards normal levels.
This normalization of the economy is making me think that the current inverted yield curve is sending a recession signal, just as it has reliably done in the past.
Of course, I could be wrong. Perhaps the yield curve spread is no longer the reliable recession predictor that it has been. Only time will tell.
Although it may be hard to see on Chart 1, generally recessions don’t start until sometime after the 10-yr/2yr spread becomes positive (see green rectangles).
Looking at the current 10-yr/2yr yield curve spread (Chart 4), we see that the spread is still negative (as is the 10-yr/3-mo if that is your preference – see here). If the curve inversion-to-recession timeframe of the past holds up, this suggests that a recession will not happen until sometime after the yield curve spread normalizes, which won’t occur until after the Fed begins to lower interest rates.
Chart 4
Source: Federal Reserve Bank of St. Louis, 10-Year Treasury Constant Maturity Minus 2-Year Treasury Constant Maturity [T10Y2Y], retrieved from FRED, Federal Reserve Bank of St. Louis; https://fred.stlouisfed.org/series/T10Y2Y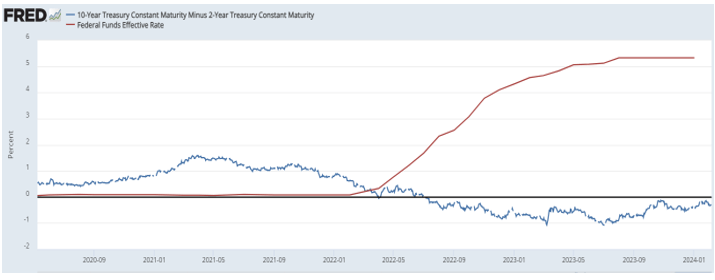
Of course, the Fed is trying to pilot a soft landing, but as the recessions that appear after the green triangles on Chart 1 remind us, the Fed hasn’t had much luck doing so.
Regardless of what happens to the yield curve spread, to see where the economy goes, and eventually the stock market, I will repeat my earlier recommendation: keep an eye on corporate profits, financial stress, weekly unemployment claims, and retail sales. If they decline on the BaR, and other indicators stay largely unchanged, there is trouble ahead. If they hold, and other indicators start to improve, then the elusive soft landing may be realized.
Economic indicators tracked on the BaR Analysis Grid
www.econpi.com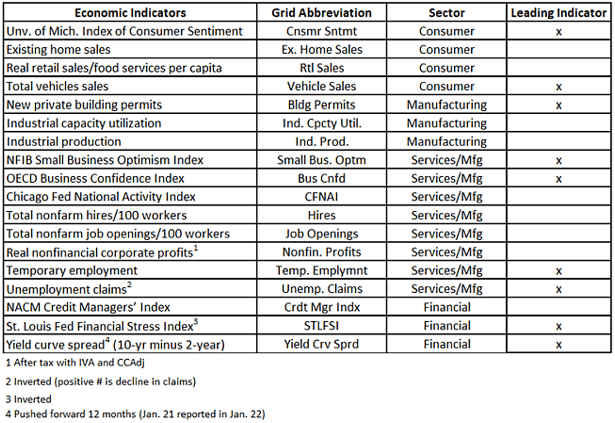

 Q2 2024 Earnings Call Transcript")

