
peterschreiber.media
Inflation came in hotter than expected in December, with the headline CPI rising by 3.4% vs. estimates for 3.2% and up from 3.1% in November. Also, core inflation rose by 3.9%, hotter than the estimates of 3.8% but below last month’s 4.0%.
The inflation report, while holding a few surprises, probably suggests that inflation has fallen to a point where the Fed could cut rates to ensure that policy doesn’t become too tight but that inflation is sticky enough to keep rates on the back of the yield curve elevated at or above current levels. This is likely to lead to further yield curve steepening.
Sticky Inflation Remains A Problem
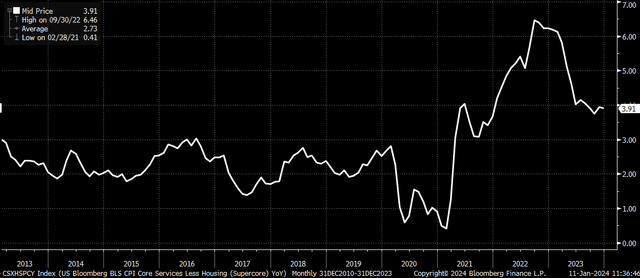
The big CPI surprise that suggests inflation is staying sticky is what’s taking place beneath the surface with super core inflation, which is actually showing signs of accelerating over the last three and six months. The super core CPI, which is CPI core services less housing, was 3.9% y/y in December, flat with November.
Bloomberg
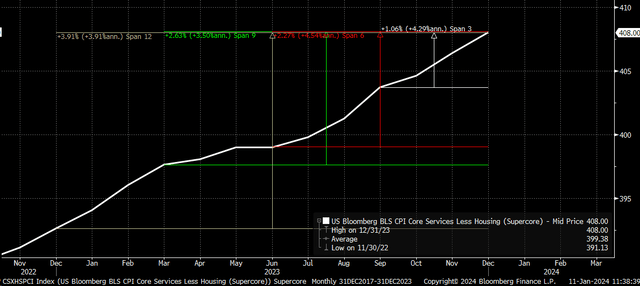
When digging into the index value, the data shows that over the last six months, super core inflation has risen at an annualized rate of 4.54% and 4.3% over the last three months, considerably faster than it has risen over the past year.
Bloomberg
This would be a setback, especially considering how much attention the Fed has paid to this subset of inflation data over the past two years. But it also could become a problem should goods inflation come back at some point over the next few months.
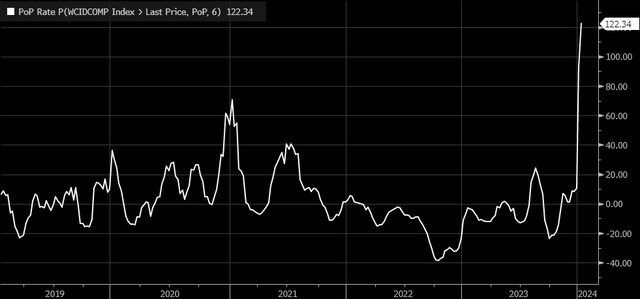
Recent data shows that shipping rates have been rising, as noted by the WCI Composite Container Freight Benchmark Rate, which has soared by 122% over the past six weeks.
Bloomberg
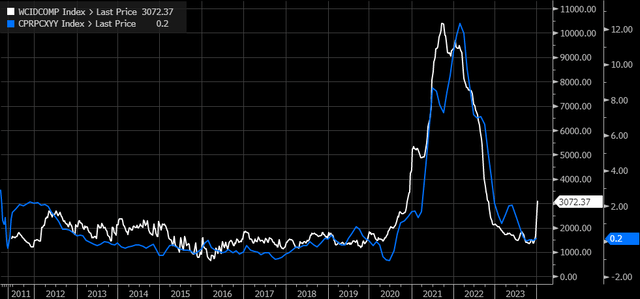
In the past, we have seen changes in the value of this benchmark rate directly tied to trends in the inflation of goods, which can be viewed through the CPI Commodities, excluding Food and Energy Commodities. Something that will need to be monitored closely should it persist.
Bloomberg
Still Pricing In Rate Cuts
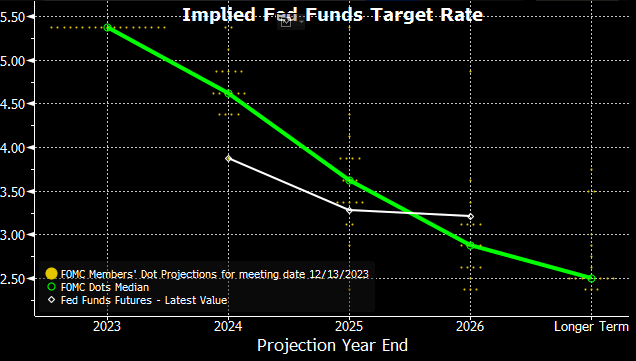
The bond market still sees something in the data that suggests the Fed will need to cut rates aggressively in 2024 by as much as six times and sees rates falling to around 3.9% by the end of 2024 versus the Fed’s median dot plot of 4.6%.
Bloomberg
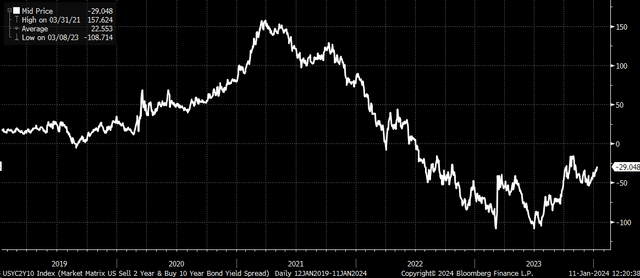
So, at least to this point, the market is saying that a hot December job report and a hot December CPI report are not enough to change its opinion on rate cuts. Further adding to the call for rate cuts is the steepening of the yield curve, with the two-year rate falling by four bps to 4.32% while the 10-year rate stays flat.
With the two-year rate falling to the 10-year rate, it’s the market’s way of anticipating Fed rate cuts. This is causing the yield curve to steepen and move to -29 bps, which is almost its highest level since early November.
Bloomberg
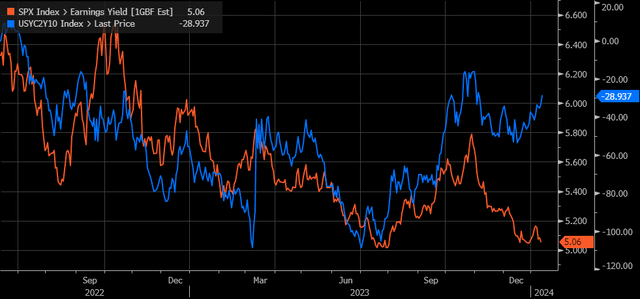
Over the last two years, the yield curve has played an important part in the equity market, with stock prices for the most trading along with the yield curve inversion. The S&P 500 earnings yield, just the inverse of the PE ratio, has closely tracked changes in the yield curve. They have, however, separated some since the middle of December.
Bloomberg
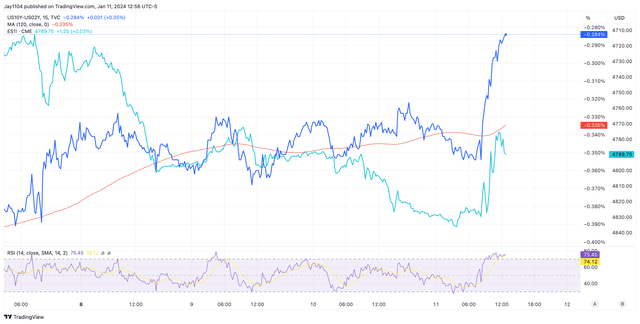
It’s worth noting that if the yield curve continues to steepen and normalize, it’s quite possible that this trend for equity prices to follow the yield curve resumes. It could even be why equities reversed earlier gains and turned negative following the CPI report.
S&P 500 Futures Inverted (TradingView)
Overall, the CPI report suggests that the inflation rate is falling to a level consistent with rate cuts, but probably not as many as the market has priced in. Additionally, the data is sticky enough to suggest that the back of the yield curve does not fall any further, and that probably means more yield curve steepening takes place.
Whether the relationship between stocks and yield continues to stick remains to be seen.


