
monsitj
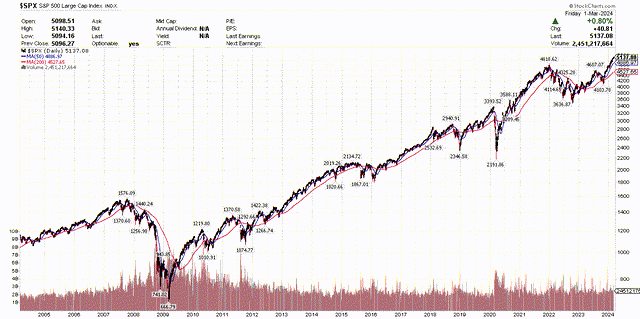
Financial markets have long been considered discounting mechanisms because of their tendency to move up or down in advance of real world economic developments they are supposed to reflect. Following the Great Financial Crisis, the Federal Reserve manipulated the discounting mechanism of the free market by reducing the cost of money to zero and injecting a steady flow of liquidity into the financial system like a drug might be administered to a patient intravenously. That liquidity helped to inflate financial asset prices. Interest rates in a free market measure risk, and when the Fed lowered short-term rates to zero and weighed on long-term rates with its bond purchase program, otherwise known as quantitative easing, it further undermined the market’s ability to price risk.

Edward Jones
The Fed’s goal during the years that followed the GFC was to reignite growth and increase the rate of inflation to an average of 2%, as we were flirting with deflation during the decade that followed the implosion of the housing bubble. The Fed manipulated financial asset prices to create a wealth effect that it hoped would lead to faster rates of economic growth and higher rates of inflation. The jury is still out on how well that trickle-down policy worked. Today, Chairman Bernanke likes to take credit for saving the economy, which I believe he allowed to nearly collapse while sleeping at the steering wheel of the Federal Reserve in the years leading up to the GFC. I did not like the policies of the Fed during the 2010s, and routinely railed against them in my writings. My disdain for the Fed’s manipulation also influenced my investment strategy and market outlook in a way that limited my participation in the upside of the market.
Stockcharts
In those years, I fell victim to my own biases because I was investing based on what I thought should happen to the economy and markets rather than what was likely to happen. I gradually learned that such an approach was futile because the market didn’t care about what I thought, nor was it concerned about what might be bad policy in the longer term. Markets operate in a 6-12 month window when they are free to operate. Thankfully, the Fed is no longer in manipulation mode, having normalized interest rate policy and started to reverse the process of quantitative easing. Markets are free again and in full discount mode. Thankfully, I have rectified my approach over the past several years to focus on what markets are more likely to do rather than what I think they should do, and that has helped me better navigate the market and business cycles.
Today, I see many investors and pundits making the same mistakes I did during the 2010s. They don’t like the current administration, the federal debt and deficits, the Fed’s monetary policy, valuations, and the list goes on. Many pundits are trying to call a top in the market or identify an artificial intelligence bubble at its peak. They focus on the negative incoming economic data and ignore the positive to build their case. I think this is an approach that will lead most investors astray. My critics will say that I have only focused on that which is positive, some calling me a perma-bull, but that is not a fair assessment. I always focus on both.
What makes this business cycle particularly difficult to measure is that during a soft landing, there is a relatively even balance between positive and negative incoming economic data. That allows for both bulls and bears to make their case. We need weaker economic data to lower the rate of increase in prices, but we need resiliency to the extent that the economic expansion continues.
I am not focused more so on one than the other, but on the rates of change in both. Rates of change are what drive free markets, and this market tells me the economy is headed for a soft landing. That would validate the gains we have seen year to date and provide room for more in segments of the market that have yet to participate.
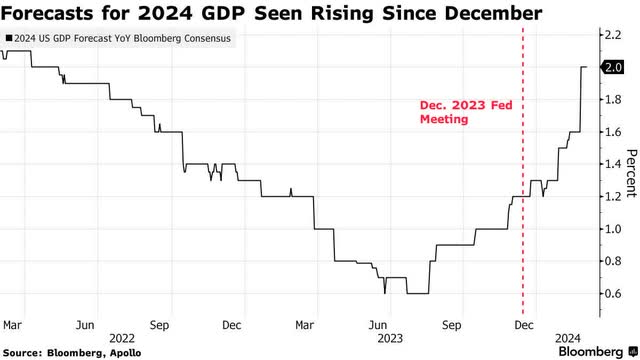
While there are a few pundits out there still calling for a recession this year, the consensus is firmly in the camp of continued expansion. In fact, estimates for the rate of economic growth in 2024 have continued to improve since the beginning of this year. That is a positive rate of change and a strengthening tailwind for corporate profits.
Bloomberg
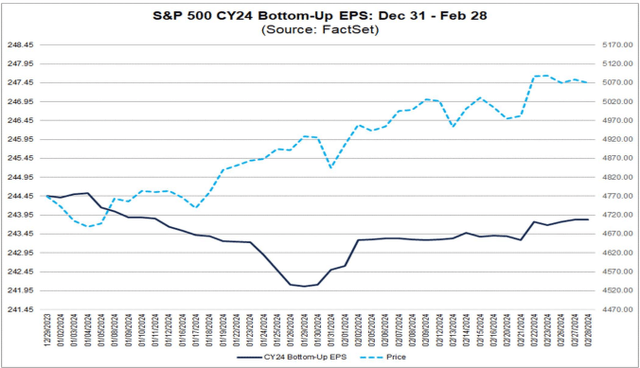
This is why the consensus earnings estimate for the S&P 500 has been on the rise since late January, which is another positive rate of change.
FactSet
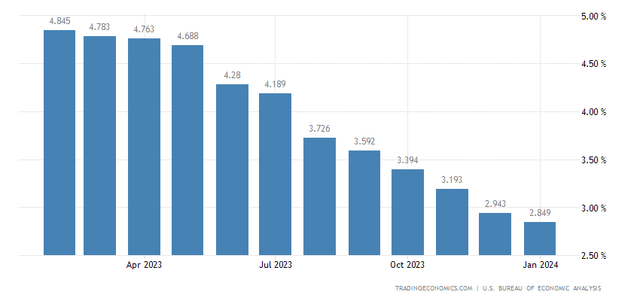
At the same time, the Fed’s preferred measure of inflation, being the core Personal Consumption Expenditures (PCE) price index, continues to decline on an annualized basis, as we learned last week from January’s figure. The bears did their best to pick through the components in search of ones that were on the rise last month, but the bottom line is that the overall core rate continues to decline. This is what will dictate Fed policy moving forward, and we are on track to reach 2% later this year, which is yet another positive rate of change.
TradingEconomics
Despite being on track for a soft landing, it appears investors are no longer concerned about how many rates cuts we realize, but simply comforted by the fact that short-term rates have peaked and will start to decline at some point this year. We started with expectations of seven cuts, and now we are down to just four. I am still concerned that the Fed needs to begin sooner rather than later, which will keep me on high alert if they don’t start by May, but I’m listening to the market here and assuming that it is telling me the economy is strong enough to weather the current rate environment for longer. Still, the rate of change is positive moving forward.
As I intimated in the fall of 2022 when the economic backdrop could not get any worse, ignore absolute numbers and focus on the rates of change in those numbers to help determine the market’s direction. Rates of change have been improving ever since and continue to do so, which is why the bulls keep running toward the soft landing ahead.
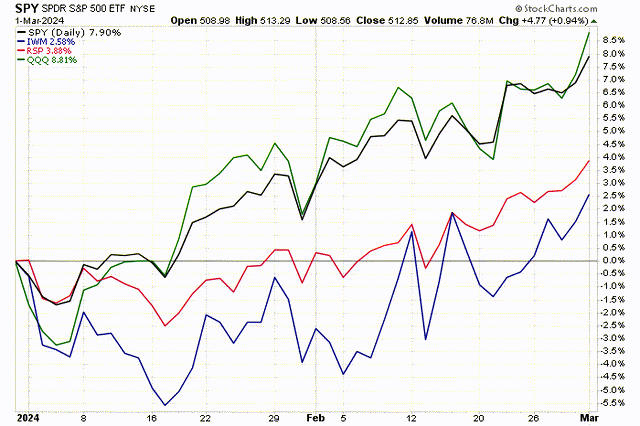
I am not calling a top in the bubbly artificial intelligence space, but I am not jumping on the bandwagon either, preferring to look at those segments of the market that present a greater value proposition and still decent upside potential on a risk versus reward basis. That leads me to what I’ve called the average stock, with an emphasis on small caps. I shared the chart below with investors last week, which shows a year-to-date performance comparison between the Nasdaq 100 (QQQ) and the S&P 500 (SPY), both of which are dominated by the largest technology companies, and the equally weighted S&P 500 (RSP) and Russell 2000 (IWM). I see the latter two closing the gap with the first two as the year progresses. The Russell 2000 small-cap index finally moved into positive territory last week.
Stockcharts
When the rates of change stop improving and start deteriorating, so will my outlook for the market and economy. Until then, enjoy the ride.


