Yuichiro Chino/Moment via Getty Images
Originally posted on February 11, 2024
In this brief market report, we look at the various asset classes, sectors, equity categories, exchange-traded funds (ETFs), and stocks that moved the market higher and the market segments that defied the trend by moving lower.
Identifying the pockets of strength and weakness allows us to see the direction of significant money flows and their origin.
The S&P 500 sets 10 new highs in 16 days.
For the week just past, the S&P 500 was up 1.4%. Year-to-date, it is up 5.4%. Over the past 30 days, it is up 5.7%. Over the past 12 months, it is up 22.1%. Since the bull market began in October 2022, it is up 40.5%.
ZenInvestor.org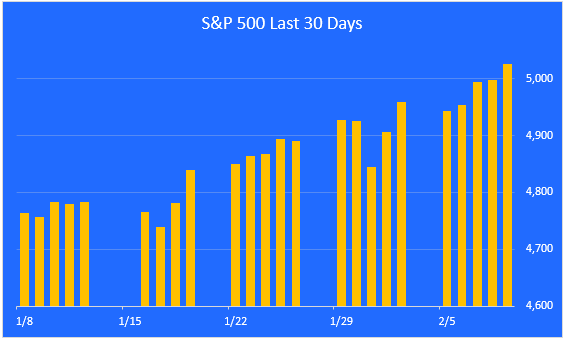
A look at monthly returns.
This chart shows the monthly returns for the past year. After a 10% correction from August through October, the market has been on a tear, culminating with last Friday’s close above the psychologically important 5000 level.
ZenInvestor.org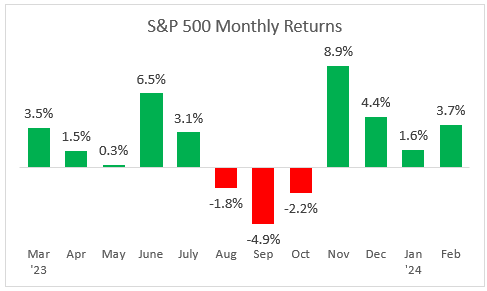
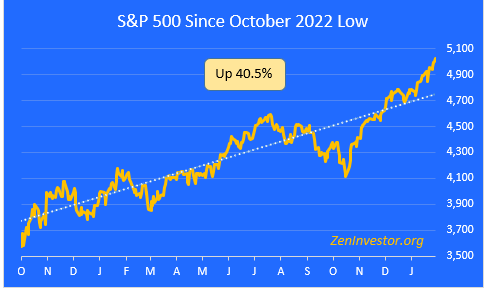
A look at the bull run since it began last October.
This chart highlights the 40.5% gain in the S&P 500 from the October 2022 low through Friday’s close. We made good progress last week, even though Q4 corporate earnings so far have only shown modest improvement over last year.
Major asset class performance
Here is a look at the performance of the major asset classes, sorted by last week’s returns. I also included the year-to-date returns as well as the returns since the October 12, 2022 low for additional context.
The best performer last week was Blockchain. Not to be confused with Bitcoin and other cryptocurrencies, Blockchain tracks the performance of companies involved in the development and utilization of blockchain technologies. This includes companies engaged in the research, development, and implementation of blockchain solutions across various sectors.
The long-suffering China market caught a bid after Barron’s hinted that Chinese authorities may inject $200 billion to prop up falling prices.
ZenInvestor.org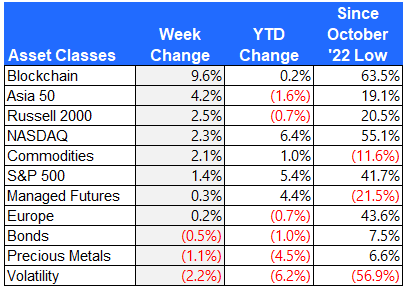
Equity sector performance
For this report, I use the expanded sectors as published by Zacks. They use 16 sectors rather than the standard 11. This gives us added granularity as we survey the winners and losers.
Technology had a very good week, especially among the Magnificent 7 mega-cap stocks. Software and semiconductor companies rallied sharply.
Defensive Utilities and Staples lagged behind as investors focused on growth.
ZenInvestor.org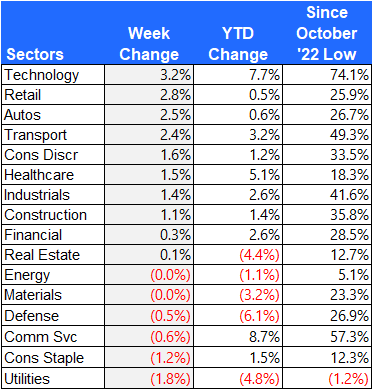
Equity group performance
For the groups, I separate the stocks in the S&P 1500 Composite Index by shared characteristics like growth, value, size, cyclical, defensive, and domestic vs. foreign.
The best-performing group last week was the Magnificent 7. Even though these 7 stocks continue to lead the market higher, market participation is broadening out, which is a healthy sign.
Defensive stocks sold off last week, as did Value-oriented groups. Last week was all about growth.
ZenInvestor.org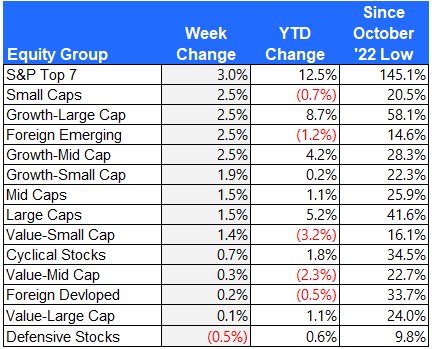
The S&P Top 7
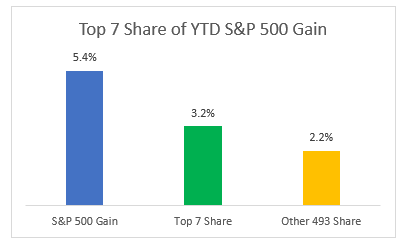
Here is a look at the seven mega-cap stocks that have been leading the market over the past year. These seven stocks account for 59% of the total YTD gain in the S&P 500. That’s down from 87% just a few months ago, providing evidence that participation in the bull market is broadening once again.
ZenInvestor.org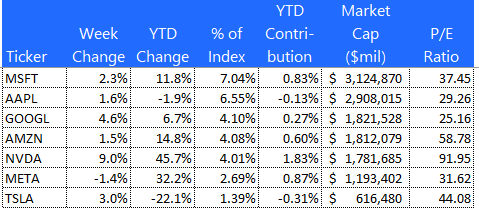
The 10 best-performing ETFs from last week
The ProShares Bitcoin Strategy ETF (BITO) took the top spot on the ETF leaderboard, gaining a whopping 10.8% in one week. Solar energy stocks finally perked up, led by a 22% pop for Enphase Energy (ENPH). Revenue dropped 58% in Q4, but management sees a recovery in the second half of the year.
ZenInvestor.org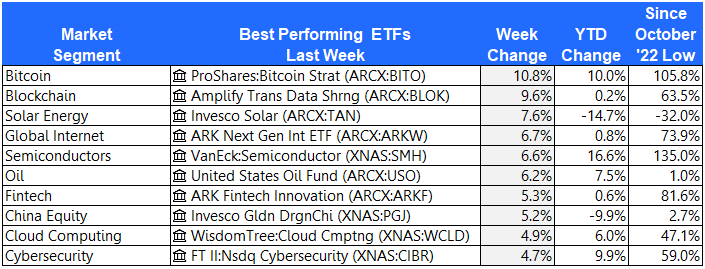
The 10 worst-performing ETFs from last week
Palladium and Uranium struggled last week. Cannabis gave back some of its recent strong gains but is still up by 38% this year.
ZenInvestor.org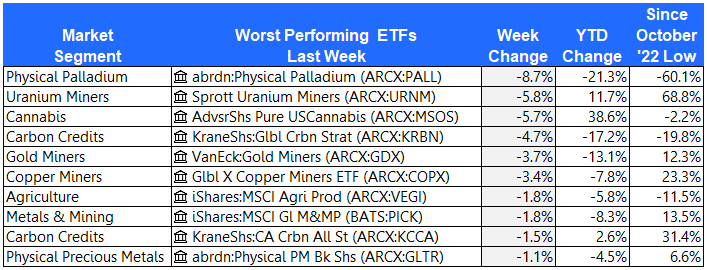
The 10 best-performing stocks from last week
Here are the 10 best-performing stocks in the S&P 1500 last week.
REGENXBIO Inc. (RGNX) announced positive top-line results from the phase I/II/III CAMPSIITE study of its one-time gene therapy candidate, RGX-121, for the treatment of patients (up to five years old) with Hunter syndrome.
Super Micro Computer (SMCI), a server maker, is on fire. It’s up 160% year-to-date. Its servers are used for cloud computing and AI applications.
ZenInvestor.org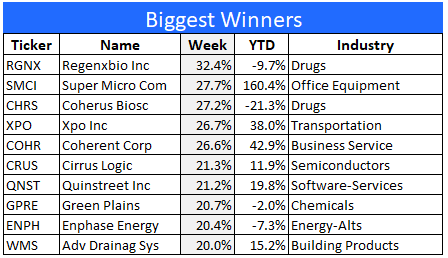
The 10 worst-performing stocks from last week
Here are the 10 worst-performing stocks in the S&P 1500 last week.
Digital Turbine’s (APPS) third quarter 2024 earnings missed expectations.
ZenInvestor.org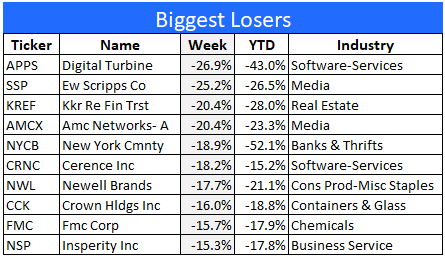
Final thoughts
The S&P Top 7 stocks continue to dominate the market, but that dominance is slipping lately. As the following chart shows, these seven mega-cap tech stocks still account for 59% of the S&P 500 YTD gain. In 2023, they accounted for 87% of the market’s gain.
After several weeks of broadening market participation, it now looks like a durable trend. This can be seen in the performance of small- and mid-cap stocks, which have recently been outperforming large caps.
The fact that the market as a whole made new highs last week, even though rates rose and earnings only showed modest improvement, tells me that this rally is not over yet. And as market participation broadens, the durability of this bull run is enhanced.
Are you looking for more high quality ideas? Consider joining The ZenInvestor Top 7, my Marketplace service. The Top 7 is a factor-based trading strategy. Its screening algorithm prioritizes reasonable price first, then the momentum, and finally projected earnings growth. The strategy produces 5-7 names, and rebalances every 4 weeks (13 times per year). The goal is to catch healthy companies that have gone through a rough period, and are now showing signs of making a strong comeback. Join now with a two week free trial.
Editor’s Note: The summary bullets for this article were chosen by Seeking Alpha editors.


