in-future
How do you amalgamate tech exposure, value, quality, and dividends? While not targeting value-ish companies directly or intentionally seeking a quality tilt, the First Trust NASDAQ Technology Dividend Index Fund ETF (NASDAQ:TDIV) offers a compelling balance of all these factors. So should income-focused investors who are searching for tech & telecom portfolios with healthy valuations buy into it? Not necessarily. There are a few vulnerabilities that should also be considered. Let us discuss that in the note.
Investment strategy: U.S. and overseas tech & telecom dividends
According to its website, the basis of TDIV’s strategy is the Nasdaq Technology Dividend™ Index. As described in the summary prospectus, the index includes no more than 100 dividend-paying (with a “regular or common” dividend) technology and telecommunications players (ICB taxonomy is used), with the latter intentionally underweighted (a 20% collective weight cap). Companies with a market cap below $500 million cannot compete for a place in it. Overseas companies with U.S.-listed securities can qualify; firms from emerging markets are welcome as well. The index has “a modified market cap weighting methodology,” with larger companies prioritized. It is rebalanced quarterly and reconstituted semiannually.
Valuation benefits, almost ideal quality, yet mostly tepid growth
In my previous note on TDIV that was published fairly long ago, in September 2021, I called this investment vehicle an “unobvious tech play.” In fact, little has changed since then, as its valuation story remains mostly compelling, though there are a few nuances that come to light upon a more careful inspection. Multiple facts can be provided to support that point. Let us discuss the most important ones.
As of January 18, TDIV had a portfolio of 84 holdings, with the essential allocations being the GICS semiconductors & semiconductor equipment and software industries, together accounting for 57.5% of the net assets. Broadcom (AVGO) was its principal holding with a 9.3% weight, followed by Qualcomm (QCOM) with an 8.2% weight.
| Metric | Holdings as of January 18 |
| Market Cap | $368.5 billion |
| Enterprise Value | $384 billion |
| EY | 4.97% |
| P/S | 5.88 |
| EBITDA/EV | 5.3% |
| FCFY | 5.2% |
Created by the author using data from Seeking Alpha and the fund; financial data as of January 20
Partly owing to the weighting schema of the index, investors get large exposure to the mega-cap echelon, as companies with market values above $100 billion have about 57.7% weight, so a $368.5 billion weighted-average market cap does come as a surprise. What is a pleasant surprise, though, is the earnings yield of this portfolio, which was approaching 5% as of January 20, with the primary drivers shown below:
| Symbol | Weight | GICS Industry | EY |
| Vodafone Group Public Limited Company (VOD) | 1.22% | Wireless Telecommunication Services | 49.2% |
| Cogent Communications Holdings, Inc. (CCOI) | 0.75% | Diversified Telecommunication Services | 30.8% |
| Nokia Oyj (NOK) | 0.31% | Communications Equipment | 21.2% |
Data from Seeking Alpha and the fund
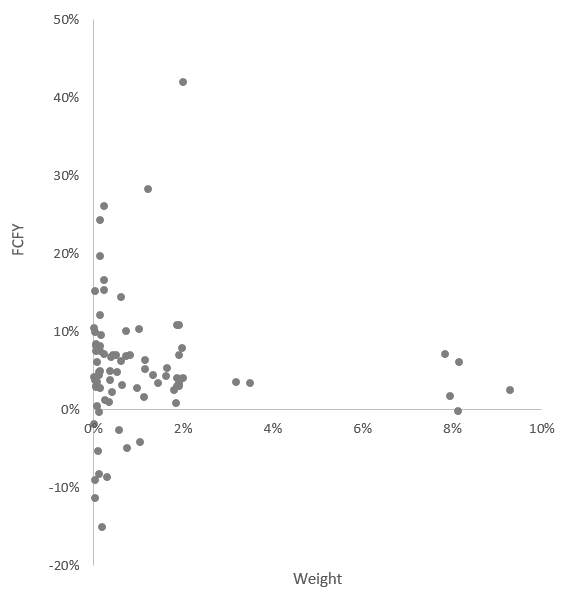
But since we are dissecting a portfolio with no exposure to banks and the like, we have a lot of flexibility when it comes to valuation and the analysis of quality characteristics. For example, the debt-adjusted earnings yield (EBITDA/EV) becomes an option. In the case of TDIV, this metric is a bit higher than its simpler alternative, at a healthy mid-single-digit level. Another parameter that certainly should be reviewed is the Free Cash Flow yield. As most TDIV’s holdings have a positive last twelve months levered FCF, with only around 11.5% struggling to cover capital expenditures (with negative net operating cash flow being the culprit in a few cases), the portfolio-wise figure is similar to EBITDA/EV at 5.2%, partly thanks to the 42% FCFY of Rogers Communications (RCI) and VOD’s 28% yield.
Distribution of FCF yields in the TDIV portfolio (Created by the author using data from Seeking Alpha and the fund)
Overall, I believe a mid-single-digit FCFY looks certainly inexpensive for a tech & telecom portfolio.
On the negative side, there is still something to criticize on the value front. The major problem here is that just around 21% of the holdings have a Quant Valuation rating of B- or higher (vs. 51% in September 2021), while over 46% look priced too generously, with D+ rating of worse.
While offering compelling value exposure (with nuances), TDIV has almost ideal quality, even though the index it tracks does not target the profitability factor directly.
- First, over 96% of the holdings (70 companies) have a Quant Profitability rating of B- or higher. It goes without saying that this is a robust result.
- Even though there are a few loss-making companies in this portfolio, those net CFFO-negative account for less than 1%. Most names represented have a positive LTM levered FCF.
- Capital efficiency indicators, including Return on Total Capital and Return on Assets, are in double digits.
- The balance sheet risk is also rather moderate. More specifically, I believe a Total Debt/EBITDA ratio below 3x is optimal. TDIV’s weighted-average figure stands at 2.72x (EBITDA-negative ADTRAN Holdings (ADTN) was excluded from calculations). Another factor worth mentioning is the difference between the WA market cap and enterprise value. In the case of TDIV, the latter is just around 4% higher.
| Metric | Holdings as of January 18 |
| ROTC | 13.4% |
| ROA | 11.8% |
| Total Debt/EBITDA | 2.72 |
Calculated using data from Seeking Alpha and the fund
Nevertheless, with such an attractive value-quality balance, TDIV has one major vulnerability: growth. In fairness, its weighted-average figures are far from those a tech investor would expect:
| Metric | Holdings as of January 18 |
| EPS Fwd | 3.6% |
| Revenue Fwd | 4.8% |
| EBITDA Fwd | 4.4% |
Calculated using data from Seeking Alpha and the fund
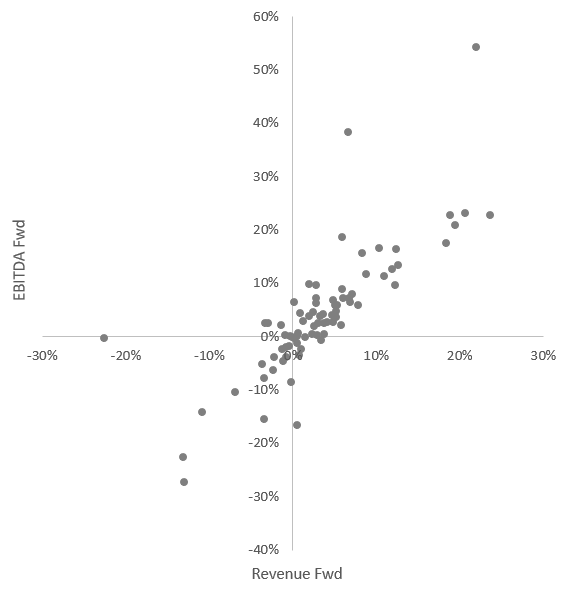
To give a bit more color, I created the following scatter plot:
Created using data from Seeking Alpha and the fund
The chart illustrates that one of the reasons why growth rates are so weak is TDIV’s exposure to companies that are forecast to deliver lower revenue and/or EBITDA going forward. Most likely, this is the consequence of the fund’s dividend focus. A minor remark here is that ADTN, which has a triple-digit forward EBITDA growth rate, was removed to improve the readability of the chart. The following firms with no analyst estimates were also removed:
| Stock | Weight |
| Benchmark Electronics (BHE) | 0.04% |
| Progress Software (PRGS) | 0.07% |
| Ubiquiti (UI) | 0.57% |
Data from the fund
Performance discussion
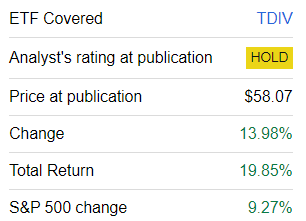
Since my September 2021 article, TDIV has had a solid run, easily beating the S&P 500 index.
Seeking Alpha
Over the long term, incepted in August 2012, TDIV delivered an annualized return a few bps above that of the iShares Core S&P 500 ETF (IVV). It also beat the Schwab U.S. Dividend Equity ETF™ (SCHD) and the WisdomTree U.S. Total Dividend Fund ETF (DTD).
| Portfolio | TDIV | IVV | SCHD | DTD |
| Initial Balance | $10,000 | $10,000 | $10,000 | $10,000 |
| Final Balance | $42,545 | $41,935 | $38,100 | $33,061 |
| CAGR | 13.63% | 13.48% | 12.53% | 11.13% |
| Stdev | 16.39% | 14.57% | 14.09% | 13.93% |
| Best Year | 36.69% | 32.30% | 32.89% | 28.19% |
| Worst Year | -22.13% | -18.16% | -5.56% | -6.44% |
| Max. Drawdown | -29.40% | -23.93% | -21.54% | -25.27% |
| Sharpe Ratio | 0.8 | 0.87 | 0.83 | 0.75 |
| Sortino Ratio | 1.25 | 1.37 | 1.37 | 1.15 |
| Market Correlation | 0.9 | 1 | 0.91 | 0.95 |
The period covered is September 2012-December 2023. Data from Portfolio Visualizer
On the downside, it had the steepest maximum drawdown in the group (delivered during the 2022 bear market). Besides, it had fewer positive periods than IVV, 92 vs. 95 (out of the total of 136).
Investor takeaway
I am drifting toward a more neutral view on TDIV. There is no denying that the fund is offering a robust quality story with something to appreciate regarding value characteristics. Its performance in the past was mostly solid, with the final months of 2023 being especially robust. However, there are a few downsides. First, growth characteristics are soft. Here, I should quote my previous article:
The fund might be a nice option to consider for more conservative investors who want some tech & telecom exposure but without risks stemming from too-bullish sales growth forecasts or profitability risks inherent to most players in this space that trade with what I would call the ‘great expectations’ premium.
This remains the case, though as the market environment now favors growthier stocks, TDIV’s proposition looks weak.
Second, it has a fairly burdensome expense ratio of 50 bps. And third, a 1.69% dividend yield is unspectacular, while dividend growth is sluggish. All in all, the Hold rating is maintained.


