DNY59
As the S&P 500 has risen to new highs, analysts and investors have played down valuation concerns as they still compare favourably to the 2000 bubble peak. Justifying expensive valuations by comparing them with the biggest bubble in US history tells us something about the bullish sentiment in the market, but it also ignores the deterioration in the economy since then. Specifically, the evaporation of the pool of US savings, which forms the basis of future corporate profits.
At the 2000 market peak, the S&P 500 traded at a PE of around 30x compared to 25x today, but the prospects for earnings growth back then were far better than they are today. In 2000 corporate profits were just a small share of the economy’s national savings. The economy was producing more than it consumed, allowing a buildup in savings, and these savings were distributed fairly evenly across the corporate sector, the household sector, and the government. Today, corporate profits are at a record high share of GDP, propped up by huge fiscal deficits which have seen net national savings rates turn negative. If we factor in the slower outlook for profit growth, the S&P 500 is far more overvalued today than it was at the 2000 peak.
The Remarkable Divergence Between National Savings And Profits
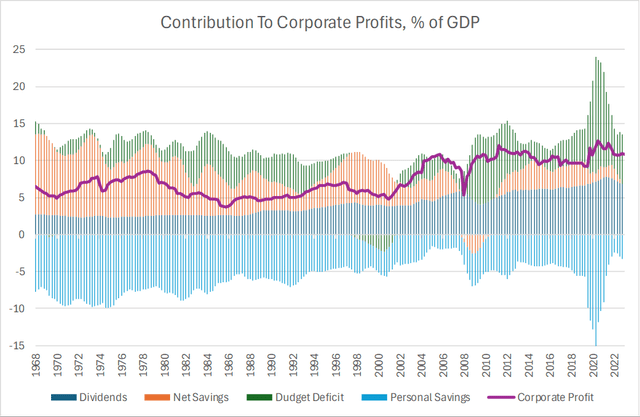
As a share of GDP, after tax US economy wide corporate profits stood at 6% of GDP in 2000, with S&P 500 profits amounting to around 7% of sales. Today, US corporate profits stand at 11% of GDP, while S&P 500 profits are 11% of sales. The 4 percentage point increase in profit margins over this period has reflected an expansion in profits across the economy. However, at the same, the economy’s net savings rate fell from a healthy 6% in 2000 to less than zero today.
As corporate profits are just one part of national savings, how can it be that US corporate profits sit at 11% of GDP while net national savings is now negative? Well, the only way for this to happen is if other sectors of the economy run large deficits, and in this case, it has been predominantly the rise in the budget deficit that has driven down savings and driven up profits. This can be seen in the following savings equations, which show how economic savings are distributed across the different sectors of the economy today as compared to 2000 (figures don’t add up exactly due to rounding and statistical discrepancies).
2000 Net National Savings Breakdown
Current Net National Savings Breakdown
BEA, Bloomberg (Green shows increase from 2000, Red shows decrease from 2000)
The fiscal balance moved from a surplus of around 1% in 2000 to a deficit of around 7% today. This has undermined the national savings rate, largely through the increase in consumption subsidies, which have reduced precautionary savings and driven up corporate profits. Note that the government need not cut corporate taxes or subsidise spending directly for corporate profits to benefit from a rising fiscal deficit. As long as the personal savings rate remains unchanged, which it has, a rise in the fiscal deficit translates to a rise in profit’s share of total savings.
An additional factor driving the rise in corporate profit in the face of negative savings has been the rise in dividend payments. Dividends contribute to profits, but are not part of national savings. When a company pays a dividend to an individual, this results in an increase in income, and if their personal savings rate is unchanged, it will be spent on a good or service that results in a rise in corporate revenue with no related expenditure. Dividends as a share of GDP have risen by 3pp since 2000, which has indirectly contributed to the rise in corporate profits.
Rising profit margins allowed S&P 500 profits to grow by over 6.2% annually from 2000 to 2023, far outpacing the 4.4% growth in sales and nominal GDP growth seen over this period. A 30x PE ratio in 2000 is not particularly expensive when earnings are set to grow by over 6.2% annually for 23 years. Assuming a 50% dividend payout ratio and a required rate of return of 10%, the dividend discount model shows that earnings would have to be expected to grow by 5% annually for the SPX to be cheaper today than at its 2000 peak.
All The Profit Has Already Been Squeezed Out Of This Economy
The key question is if profits are already substantially bigger than net savings, how will they manage to grow in the future? In order for margins to remain at their record levels, we would have to see the fiscal deficit remain at current extreme levels, dividends remain at a record high share of GDP, and the personal savings rate remain at current lows, all without net national savings continuing to decline.
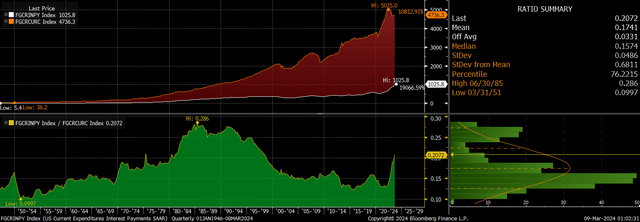
If large government deficits persist, government debt will continue to rise and interest payments will rise exponentially. Interest on the national debt is already up to 21% of Federal tax receipts, and this is with a weighted average interest rate of around 3%. At current interest rates, this figure rises to almost 40%. Clearly, then, this rate of rising government indebtedness cannot be sustained at current interest rates.
Regarding dividends, they could move higher still as a share of GDP causing upside pressure on margins, but this would simply come at the expense of retained earnings and net assets values. As for private savings, despite all the government income subsidies, personal savings are in the lowest 5th percentile in data going back to 1946. The savings rate has only been lower in the height of the housing bubble that ultimately burst and led to a sharp reversal in precautionary savings rates.
Three Scenarios That Could Slash Profit Margins
As well as facing headwinds from negative savings rates, profits face an additional problem in the form of slower real GDP growth. Just as a company relies on retained profits to fund investment, an economy relies on its net savings to drive investment and growth. The low savings rate, together with the ageing population and the long-term trend of declining productivity, suggest real GDP growth is likely to come in closer to 1% than the 2% widely expected.
The main risk from the low savings rate, however, is that the imbalances that have driven it create an increasing risk of a macroeconomic outcome that results in a crash in profits. I see three scenarios that could play out that could drive down profit margins over the coming years.
A Fiscal Crisis And Forced Austerity: If inflation resumes its upward trend and Treasury yields begin to rise again, the government may be forced to undertake deficit reduction measures, which could range from spending cuts under a Republican administration to tax hikes under a Democrat administration. While this seems hard to imagine, with $11tn in Treasury debt maturing over the next 12 months and the Fed still selling its holdings, the bond market may force the government’s hand by driving up bond yields through 5%. Even a 1pp narrowing of the deficit would cause a 9% fall in corporate margins, all else equal.
Interest Costs Vs Federal Receipts (Bloomberg)
A Market Crash And A Surge In Personal Savings Rates: Another scenario that could drive down corporate profits over the coming years is a surge in personal savings, which could result from a stock or property market crash. The low savings rate we see today, despite the high level of income subsidies, likely reflects in part the high price of stocks and housing. The level of US net worth relative to GDP has long been inversely correlated with the personal savings rate, as high paper profits naturally result in lower precautionary savings. A fall in equity or property prices would likely cause a sharp rise in savings, driving down profit margins.
QE And A Dollar Crash: In order to prevent a spiralling of government interest costs, the Fed will likely be forced to lower rates and reinstate quantitative easing. This would help to sustain the government’s deficits by lowering interest rates far below the rate of GDP growth, effectively allowing persistent large deficits to continue without causing an interest cost surge. However, negative real interest rates due to QE and perpetual high deficits could easily cause a collapse in the dollar and uncontrollable inflation. Unlike Japan, which has managed to sustain QE and high deficits for many years without a surge in inflation thanks to the country’s large external assets, the US has an equally large external debt load. A loss of confidence among foreign investors could see rising inflation become self-fulfilling as the Fed is forced to create increasing amounts of money to buy increasingly negatively yielding bonds that the public no longer wants to hold.
This would be negative for profits for two reasons. Firstly, a sharp fall in the dollar would raise import costs far more than export revenues due to the country’s large trade deficit, which would undermine net national savings. Secondly, it would force down the fiscal deficit. Rising inflation tends to benefit the fiscal accounts due to the progressive nature of the tax code, but it would also force the government to take steps to slow spending.
Even If High Margins Are Sustained, The SPX Fair Value Is Around 60% Below Current Levels
Even if this precarious savings imbalance remains intact and profit margins remain at record highs, stocks are still likely to generate deeply negative real returns over the long term. Assuming a 1% trend growth rate of real GDP, sales and earnings, and a dividend payout ratio of 40% in line with the long-term average, the S&P 500 is priced to return 3% annually in real total return terms. Assuming a 6% real required rate of return, a move back to fair value would require the PE ratio to fall from 25x to 10x. If profit margins were to move back to the levels seen in 2000, the PE ratio would have to trade at around 6x in order for long-term returns to reach 6% real.
The following chart shows different fair value PE ratios based on different assumptions for growth, the requires rate of return, profit margins, and the dividend payout ratio. Note that for the S&P 500 to be trading at fair value today, real earnings would have to accelerate to over 2.7%, the required real rate of return would have to fall below 5%, profit margins would have to rise to 12%, and the dividend payout ratio would have to double.
| Long-Term Real Earnings Growth | Required Real Rate of Return | Profit Margin | Dividend Payout Ratio | Fair Value PE Ratio |
| 1.00 | 6.75 | 5 | 20 | 2 |
| 1.25 | 6.50 | 6 | 25 | 3 |
| 1.50 | 6.25 | 7 | 30 | 4 |
| 1.75 | 6.00 | 8 | 35 | 6 |
| 2.00 | 5.75 | 9 | 40 | 9 |
| 2.25 | 5.50 | 10 | 45 | 13 |
| 2.50 | 5.25 | 11 | 50 | 18 |
| 2.75 | 5.00 | 12 | 55 | 27 |
| 3.00 | 4.75 | 13 | 60 | 41 |
| 3.25 | 4.50 | 14 | 65 | 66 |
Summary
The S&P 500 PE ratio of 25x compares favourably to the 2000 peak figure of 30x, but only when we ignore the source of the profit growth that has taken place over this time. Margin expansion has been sustained by large US deficits which have simultaneously driven net savings rates down below zero, meaning future profit growth will be hard to come by. If profit margins were to move back to the levels seen in 2000, a real required rate of return of 6% would put the S&P 500’s fair value PE ratio at around 6x.


