imran kadir photography/Moment via Getty Images
Investment Thesis
Only a handful of ESG ETFs have outperformed the SPDR S&P 500 ETF (SPY) since the COVID-19 pandemic, and the SP Funds S&P 500 Sharia Industry Exclusions ETF (SPUS) was by far the best choice, delivering a 77% gain from 2020-2023. SPUS aims to satisfy ESG investors seeking to follow Islamic religious law and non-ESG investors with more traditional financial screens like low leverage and debt-to-market-cap ratios below 33%. While I see tremendous concentration risk with SPUS due to its 46% exposure to Technology stocks, this is one ESG ETF worth watching. In the article below, I will describe how SPUS works, why it’s performed so well lately, and rely on my comprehensive fundamental analysis to justify my “hold” rating.
SPUS Performance
First, I want to highlight SPUS’s performance because it’s a nice success story for an ESG ETF. While most have lagged the market, SPUS handily outperformed, delivering a 15.69% annualized gain since January 2020. This gain was 3.54% better than SPY and 1.13% more than the Wahed FTSE USA Shariah ETF (HLAL).
The performance is more impressive when considering SPUS’s 0.45% expense ratio, which is nearly twice the 0.26% average fee for ESG ETFs. Still, SPUS and HLAL ranked #1 and #3 over the last four years, so the strategy is worth examining further.
Other top-performing ESG ETFs include the IQ Candriam ESG US Equity ETF (IQSU), the Impact Shares YWCA Women’s Empowerment ETF (WOMN), and the Xtrackers S&P 500 ESG ETF (SNPE), and the one thing they have in common is high exposure to Technology stocks. Therefore, I’m careful to avoid assuming SPUS’s performance is primarily due to a superior strategy. Instead, it’s likely more of a function of its Technology sector exposure, and it’s essential to understand if this will persist in case this sector falls out of favor.
SPUS Strategy Discussion
SPUS tracks the S&P 500 Shariah Industry Exclusions Index, launched two months before the ETF’s December 17, 2019, inception date. According to the Index Factsheet, S&P Dow Jones Indices collaborates with an “independent London/Kuwait-based consulting company that specializes in solutions for the global Islamic investment market.” Like many ESG strategies, the Index follows an industry exclusion method, with the following business activities related to the following excluded:
- Advertising: advertisers of pork, alcohol, gambling, tobacco.
- Media & Entertainment: producers, distributions, and broadcasters of music, television shows, musical radio shows, and cinema operators, with exceptions for news channels, newspapers, sports channels, children’s channels, and educational channels.
- Alcohol
- Financial Services except Islamic banks, financial institutions, insurance companies, or others that pass Islamic and accounting-based screens
- Gambling
- Pork-related activities
- Pornography
- Tobacco
- Recreational cannabis
- Gold and silver trading as cash on a deferred basis
There are exceptions if a company derives less than 5% of its income from non-permissible business activities. The Index also requires each company’s 36-month average debt-market value of equity ratio to be less than 33%, with a 2% buffer for current constituents. Finally, the Index is float-adjusted market-cap-weighted and rebalances monthly. SPUS’s portfolio turnover was only 4% for the fiscal year ending November 2022 but was 46% in 2020, so it could be a reasonably active ETF.
Please note that SP Funds lists the debt-market cap ratio maximum as 30%, but I believe the Index’s 33% maximum to be more accurate. This ratio is not the same as debt-equity, as debt load is measured as a percentage of equity market value, not book value. For example, SPUS’ top holding is Apple (AAPL), which has a debt-equity ratio of 1.99 based on $123.9 billion in debt and $62.15 billion in total common equity, found on its latest balance sheet. However, for SPUS, Apple’s debt ratio is only 0.04 (4%) based on its $2.92T market cap. This approach creates a bias toward the more prominent and riskier stocks in the Technology sector. As evidence, consider the percentage of companies that pass this 33% screen for each S&P 500 sector, along with their aggregate float-adjusted market cap size in billions:
- Communication Services: 36.84% (7/19) – $3,511 (8.78%)
- Consumer Discretionary: 58.49% (31/53) – $4,210 (10.56%)
- Consumer Staples: 57.89% (22/38) – $2,491 (6.17%)
- Energy: 56.52% (13/23) – $1,492 (3.70%)
- Financials: 55.56% (40/72) – $5,263 (12.83%)
- Health Care: 78.13% (50/64) – $5,214 (12.86%
- Industrials: 84.42% (65/77) – $3,460 (8.66%)
- Materials: 60.71% (17/28) – $924 (2.31%)
- Real Estate: 23.33% (7/30) – $952 (2.32%)
- Technology: 92.42% (61/66) – $11,963 (29.57%)
- Utilities: 3.33% (1/30) – $900 (2.25%)
This free-float market cap distribution is how the S&P 500 Index is weighted, but you can see the advantage Technology stocks have. Not only are they the largest with an $11.96 trillion aggregate market cap, but 61/66 stocks pass the 33% debt screen. Next is the Financials sector at $5.21 trillion, and although the Index allows for some exceptions, it’s excluded in practice, as the largest companies do not pass Islamic screens. After that, Health Care and Industrials are likely selections, with Consumer Discretionary questionable due to only 58.49% of stocks passing the debt screen.
SPUS Sector Snapshot
Those are my educated guesses, but let’s see how it all shakes out below with a high-level sector analysis.
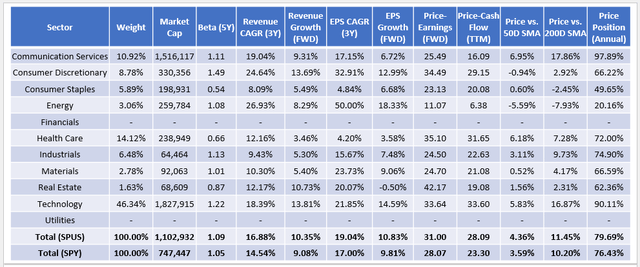
This analysis confirms these guesses but also reveals something new. Here are a few quick takeaways:
1. The bias toward larger stocks is evident by SPUS’s weighted average $1.1 trillion market cap, almost $400 billion larger than SPY.
2. SPUS’s risk is greater than the market, as measured by its 1.09 weighted average five-year beta. Additional exposure to Technology stocks is the primary source.
3. SPUS has higher growth rates and valuations across the board, meaning Morningstar’s classification as a “Large Growth” ETF is appropriate. FactSet Research categorizes it as a broad-based large-cap broad-based (blend) ETF, but that’s likely only due to its selection universe. In practice and given the relatively stable composition of the S&P 500 Index, SPUS is a growth ETF.
4. SPUS’s selections are trading higher above their 50- and 200-day moving average prices than SPY. They’re also trading closer to their 52-week high price, which I did not anticipate and am unsure if it will hold. On the one hand, stocks with larger market caps tend to be the top performers because, after all, that’s how they got so big. On the other hand, the S&P 500 Index is somewhat concentrated, with 50% of the Index covered by the top 33 stocks, and that probably won’t change in the near term. SPUS’s positive momentum features could be temporarily driven by only a few key stocks.
5. Despite only 7/19 Communication Services stocks passing the debt screen, it’s SPUS’s third-largest sector behind Technology (46.34%) and Health Care (14.12%). Three stocks qualified for SPUS, including Alphabet (GOOGL) and Meta Platforms (META), with 7.18% and 3.73% weightings, respectively. Furthermore, their debt-market cap ratios are just 1.96% and 4.45%, so barring any significant change in business activity, these stocks will be top holdings in SPUS for the foreseeable future.
SPUS Top Ten Holdings
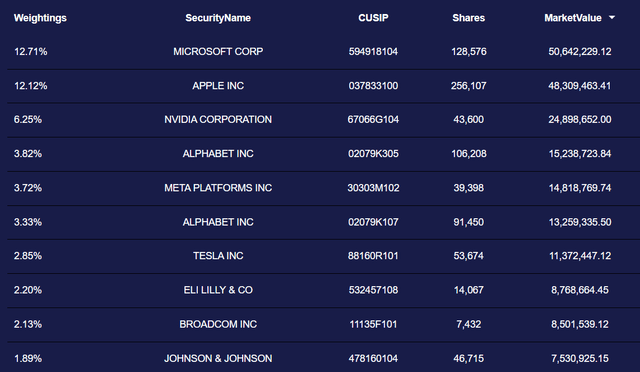
SPUS’s top ten holdings are below and include all the Magnificent Seven stocks except Amazon (AMZN). Berkshire Hathaway (BRK.B) is also absent, as well as Financials stocks like JPMorgan Chase (JPM), Visa (V), and Mastercard (MA).
Interestingly, SPUS avoids Chevron (CVX) but includes Exxon Mobil (XOM). Other key stocks it excludes are UnitedHealth Group (UNH), AbbVie (ABBV), Costco (COST), Walmart (WMT), McDonald’s (MCD), and Netflix (NFLX). Since all these stocks easily meet the debt screen, I assume their absence in the Index is permanent due to their failed religious screens.
SPUS Company Fundamentals
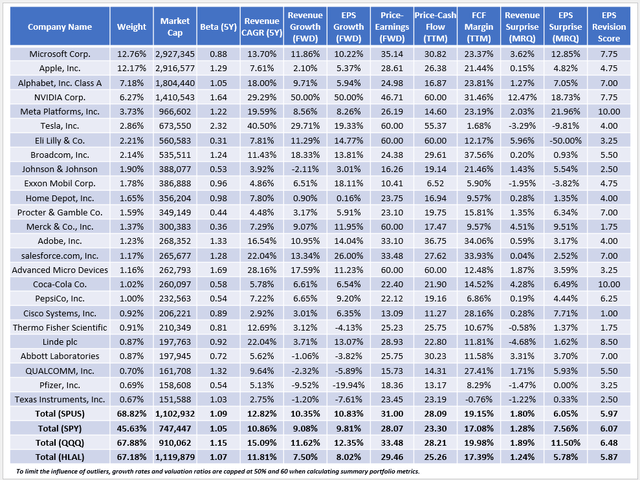
The following table highlights selected fundamental metrics for SPUS’s top 25 holdings, totaling 69% of the fund. Given this concentration level and SPUS’s growth focus, the Invesco QQQ ETF (QQQ) is a reasonable alternative for non-ESG investors. For investors seeking alignment with Islamic religious law, I’ve included fundamentals HLAL, a similarly-priced alternative to SPUS with a 0.50% expense ratio and $362 million in assets under management.
I have a few additional observations:
1. SPUS and HLAL have similar weighted average market caps of around $1.1 trillion, indicating high allocations to mega-cap stocks. However, HLAL has 1.76% and 1.59% more exposure to Microsoft and Apple but excludes top semiconductor stocks like Nvidia (NVDA) and Broadcom (AVGO). The latter two stocks comprise 8.41% of SPUS; overall, there is a 77.71% overlap between the ETFs.
2. SPUS trades at 31.00x forward earnings and 28.09x trailing cash flow, or 3-5 points more than SPY. Superior historical and forward growth rates support that higher valuation, but SPUS’s EPS Revision Score, which I derived from individual Seeking Alpha Factor Grades, is noticeably lower than QQQ’s. A key source is SPUS’s 3.22% overweighting of Apple, where most analysts (22/24) have downgraded sales expectations for the next quarter. Apple reports on February 1, 2024.
3. SPUS has excellent 19.15% weighted average free cash flow margins. In addition, 73/202 (36%) holdings have perfect “A+” Seeking Alpha Profitability Grades, indicating they are leading quality companies in their respective sectors. While 36% is a relatively small portion, the aggregate weight of these companies is 84% due to its market-cap-weighting scheme. As I’ve stated in previous articles, this weighting scheme is the easiest way to keep a portfolio’s quality high. Although it often creates concentration issues, the strategy has worked well in the large-cap category. To illustrate, ETFs with market-cap-weighting schemes have, on average, outperformed non-market-cap-weighting scheme ETFs across the large-cap dividend, value, blend, and growth categories over the last ten years:
- Large-Cap Dividends: 161.92% vs. 159.66% (+2.27%)
- Large-Cap Value: 145.11% vs. 131.90% (+13.22%)
- Large-Cap Blend: 207.96% vs. 179.45% (+28.51%)
- Large-Cap Growth: 280.63% vs. 255.41% (+25.22%)
The market-cap-weighted large-cap growth ETFs in this sample (QQQ, SCHG, ONEQ, ILCG, SPYG, VOOG, IVW, IUSG) have 18.52% average return on total equity ratios compared to 16.64% the non-market-cap-weighted ETFs (IWY, MGK, VONG, IWF, VUG, QQQE, QQEW, SPGP, FTC, PWB, RPG). SPUS is above average at 19.21%, so finding faults from a quality perspective is difficult. Instead, the main questions relate to concentration, valuation, and whether stocks like Nvidia and Broadcom are indeed Shariah compliant. Notably, HLAL, which measures debt as a percentage of total assets instead of market cap, excludes them.
Investment Recommendation
SPUS holds approximately 200 S&P 500 stocks selected based on business activity and debt-related screens. Given the composition of the parent Index, there is a strong bias toward the Technology sector, which explains its strong returns since its December 2019 launch. Using market capitalization instead of total assets in the debt ratio calculations adds to this bias, as it becomes easier for a company to qualify if its value is inflated.
SPUS trades at 31x forward earnings, or three points more than SPY. When coupled with weak diversification, I view it as a risky play for 2024. However, long-term shareholders can take comfort that SPUS’s high-quality selections will likely recover quickly after a market downturn. Therefore, I rate SPUS as a solid “hold,” and I look forward to re-evaluating it again next quarter. Thank you for reading.


