
JuSun

Investment Thesis
There are multiple ETFs that aim to achieve consistent returns while offering low volatility. Invesco’s S&P 500 Low Volatility ETF (NYSEARCA:SPLV) is one popular fund that works to achieve this objective. While SPLV has both strong holdings and demonstrates low volatility, there is another low volatility ETF that is more attractive for its both expected performance and expense ratio. Therefore, SPLV warrants a hold rating for investors seeking reliable, stable returns.
Fund Overview and Compared ETFs
SPLV is an ETF that seeks to track the 100 S&P 500 securities with the lowest volatility realized over the past 12 months. The fund had an inception in 2011, has 102 holdings, and $8.17B in AUM. Its sector allocation is heaviest on consumer staples (23.48%), utilities (18.90%), and healthcare (15.35%). Two additional low volatility ETFs used for comparison purposes in this article are Invesco’s S&P 500 High Dividend Low Volatility ETF (SPHD) and iShares MSCI USA Minimum Volatility Factor ETF (USMV).
SPHD is another Invesco ETF that is based on the S&P 500 Low Volatility High Dividend Index. The fund was started in 2012 and currently has $3.07B in AUM. With 50 holdings, this fund has the fewest of ETFs compared. Because the fund focuses on low volatility in addition to higher dividend yields, its largest sector allocations are real estate (17.72%), utilities (17.36%), and consumer staples (13.50%).
USMV is an iShares fund that tracks the MSCI USA Minimum Volatility Index. This fund is the largest with $26.73B in AUM and was initiated in 2011. This ETF has 165 holdings with the greatest sector allocations on information technology (24.86%), healthcare (16.86%), and financials (14.77%).
Performance, Expense Ratio, and Dividend Yield
While the S&P 500 index has a 10-year CAGR of roughly 12%, all three low volatility funds had a 10-year performance below this index. This is a key drawback for “low volatility” funds which ordinarily underperform the market. SPLV has a 10-year CAGR of 9.09%, while SPHD’s 10-year CAGR is 8.36%, and USMV’s 10-year CAGR is 10.20%. Therefore, in terms of looking at price return only, USMV wins in the performance category for ETFs examined.
10-Year Price Return: SPLV, SPHD, and USMV (Seeking Alpha)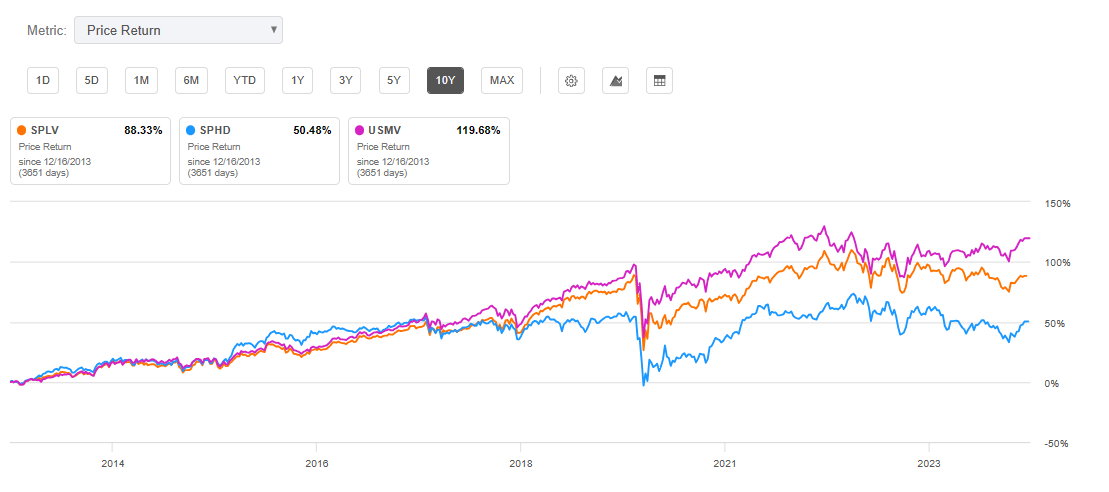
Additionally, USMV has the lowest expense ratio at 0.15%, compared to SPLV (0.25%) and SPHD (0.30%). Despite having the greatest performance and lowest expense ratio, USMV’s dividend yield is a major downside at only 1.70%. SPHD wins for having the highest dividend yield at 4.45% while SPLV has the greatest 5-year dividend growth CAGR at 8.56%.
Expense Ratio, AUM, and Dividend Yield Comparison
|
SPLV |
SPHD |
USMV |
|
|
Expense Ratio |
0.25% |
0.30% |
0.15% |
|
AUM |
$8.17B |
$3.07B |
$26.73B |
|
Dividend Yield TTM |
2.44% |
4.45% |
1.70% |
|
Dividend Growth 5 YR CAGR |
8.56% |
2.61% |
5.44% |
Source: Seeking Alpha, 17 Dec 23
ETF Holdings and Comparison
As expected for sector allocations, SPLV is heavy on consumer staples with holdings like McDonald’s Corp. (MCD), Coca-Cola (KO), and Procter & Gamble Co. (PG). SPHD’s heaviest weights are on communication services like AT&T Inc. (T) and Verizon Communications (VZ). Finally, USMV is the heaviest in information technology with holdings like Broadcom Inc. (AVGO). All ETF investors know that the future performance of the fund is tied to their individual holdings. Therefore, key differences are broken down below that provide an indication of each fund’s outlook.
Top 10 Holdings for Three Examined Low Volatility ETFs
|
SPLV – 102 holdings |
SPHD – 50 holdings |
USMV – 165 holdings |
|
MCD – 1.41% |
T – 3.28% |
AVGO – 1.97% |
|
KO – 1.32% |
VZ – 3.28% |
TMUS – 1.54% |
|
PEP – 1.21% |
SPG – 3.09% |
IBM – 1.54% |
|
KHC – 1.21% |
IP – 2.88% |
DUK – 1.53% |
|
BRK.B – 1.21% |
MO – 2.83% |
WCN – 1.51% |
|
PG – 1.17% |
KMI – 2.67% |
CSCO – 1.51% |
|
KMB – 1.17% |
OKE – 2.65% |
ROP – 1.51% |
|
YUM – 1.17% |
MMM – 2.62% |
MRK – 1.50% |
|
CL – 1.16% |
PRU – 2.56% |
WM – 1.49% |
|
RSG – 1.16% |
IBM – 2.46% |
APH – 1.49% |
Source: Multiple, compiled by author on 17 Dec 23
SPLV – Strong Mix of McDonald’s, Berkshire Hathaway, and Procter & Gamble
Despite being a decades-long symbol of America, McDonald’s is still growing with over $208B in market capitalization. MCD has a 7.5% YoY revenue growth along with an 11.6% forward EBITDA growth. Having recently launched CosMc’s, McDonald’s is innovating in the coffee market aimed at stealing market share from Dunkin’ and Starbucks. While it is too soon to tell if CosMc’s is a success, it will likely expand if its pilot locations are profitable.
Berkshire Hathaway Inc. (BRK.B) is another strong holding for SPLV at 18% YoY revenue growth, 21% net income margin, and 62% YoY working capital growth. With a beta of 0.76, BRK.B has relatively low volatility compared to the market overall while achieving a 10-year CAGR of 11.8%, roughly the same as the S&P 500 overall.
The final shining point for SPLV is PG, one of my favorite consumer staples. Procter & Gamble demonstrated a 49% TTM gross profit margin as well as return on equity, capital, and assets well above the consumer staples median. PG has provided a dividend for 67 years with a 2.61% yield currently.
SPHD – Drug down by AT&T, Verizon, and Altria
Looking forward, SPHD will likely be drug down by holdings with attractive dividends but high payout ratios leading to little or no growth. SPHD’s top holding, AT&T, has seen a mere 1.04% YoY revenue growth with a 44% dividend payout ratio. The company also has shown a negative net income margin over the past twelve months with a negative return on total assets.
VZ is the second holding with a high dividend but low expected growth. Despite paying a dividend for 19 years consistently, its 54% payout ratio has yielded little growth for the company. This has been seen with a -1.15% YoY revenue and -3.86% return on equity growth.
Altria (MO) is the third holding dragging SPHD down. While dividend investors love its more than 9% yield, its 76% dividend payout ratio has resulted in negative growth. MO has seen negative YoY revenue growth and flat EBITDA growth.
USMV – Propelled by Broadcom and T-Mobile
USMV demonstrates the strongest holdings of the three ETFs compared. Its top holding, AVGO, has proven to be incredibly profitable with a 74% gross profit margin and 39% net income margin. The company has a forward EBITDA growth of 18% and 25% YoY return on equity growth. Despite a YTD performance of greater than 100%, AVGO’s P/E GAAP is still 6% below its 5-year average P/E ratio.
The second strong ingredient for USMV is T-Mobile (TMUS). With a total 5-year price return of 144%, TMUS continues to be extremely profitable. The company has a 49% YoY levered FCF growth along with a 420% YoY return on equity growth. TMUS also had a 62% TTM gross profit margin and net income margin 200% above its sector median.
Valuation and Risk
Consistent with its 10-year history, USMV leads the three funds in YTD performance at over 7%. SPLV and SPHD have both seen negative performance YTD. All three funds have performed worse than the S&P 500 index this past year. Of the three funds, all are roughly in the middle of their 52-week price ranges.
Year-to-Date Price Return: SPLV, SPHD, and USMV (Seeking Alpha)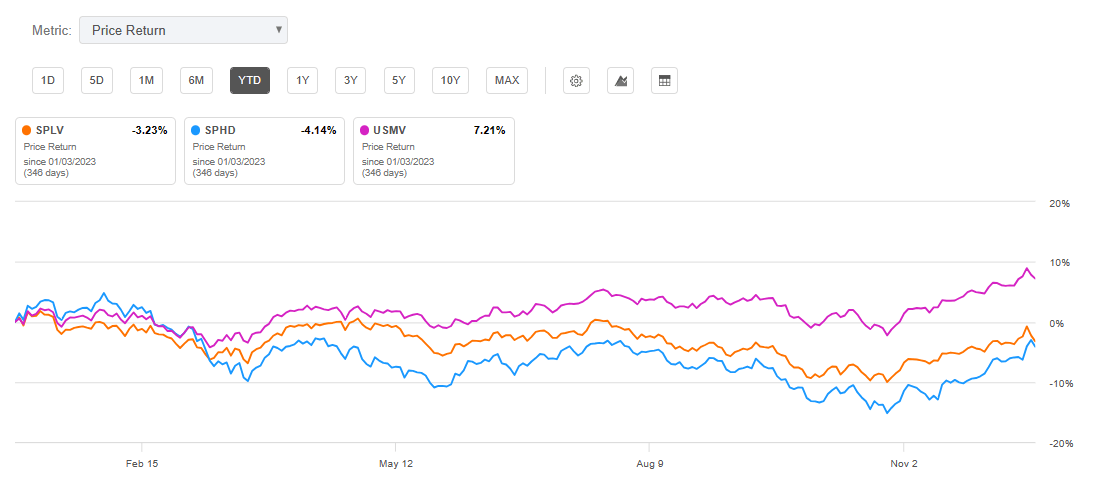
Looking at price-to-earnings and price-to-book ratios, SPHD is the most attractive. However, given its low-growth holdings, I do not expect the fund to see significant return over the next year. In contrast, while USMV has less attractive valuation metrics including P/E and P/B ratios, its holdings demonstrate strong growth and therefore greater price return. Given the respective holdings for each fund, I anticipate USMV to see the greatest performance over the next year. This would also be consistent with the historic performance over the past 10 years.
Valuation Metrics for SPLV and Peer Competitors
|
SPLV |
SPHD |
USMV |
|
|
P/E ratio |
17.68 |
10.84 |
23.73 |
|
P/B ratio |
3.28 |
2.05 |
3.77 |
Source: Compiled by Author from Multiple Sources, 17 Dec 23
To this point, we have yet to cover perhaps the most relevant metric to each fund and that is its volatility. Looking at the beta values for each fund, SPLV has the lowest beta value of 0.69 compared to the S&P 500. Therefore, one can reasonably expect the lowest volatility from SPLV compared to SPHD (beta: 0.86) and USMV (beta: 0.75).
Overall Findings
SPLV warrants a hold rating. It achieves the heart of the ETF’s goal which is the lowest volatility. Additionally, the fund has strong holdings with MCD, BRK.B, and PG. However, it has a higher expense ratio than USMV with lower historical performance.
Looking at the other two funds examined, SPHD is a sell. Despite having the highest dividend yield and most attractive valuation, it contains holdings that have demonstrated little to no growth. T, VZ, and MO may provide a high dividend, but their payout ratios leave little for reinvestment into growth. Therefore, looking forward, while the fund may provide low volatility, I expect the poorest performance.
Finally, USMV warrants a buy rating. The fund demonstrates the greatest historical performance and lowest expense ratio. While past performance is not a guarantee of future performance, USMV has the strongest holdings looking forward including AVGO and TMUS. Both companies have demonstrated strong profitability and growth.
Concluding Summary
All three funds examined (SPLV, SPHD, and USMV) achieved their basic goal of having volatility lower than the market as a whole. However, each have a distinct blend of holdings that will result in diverging performance. Due to its high dividend and low growth, holdings for SPHD will noticeably underperform over the next year in my view. To add to its underperformance, the fund has the highest expense ratio. I believe SPLV will perform notably better than SPHD buoyed by the growth of MCD, BRK.B, and PG. While having the lowest dividend yield, I think USMV will see the greatest return next year, bolstered by AVGO and TMUS. Additionally, investors of USMV will enjoy the lowest expense ratio of the three funds compared. Although all three funds may underperform the S&P 500 overall, all three will likely achieve lower volatility than the market. However, SPLV warrants a hold rating as it will likely achieve low volatility but at lower returns than USMV.