Fokusiert
Investment Thesis
I last covered the Invesco S&P 500 GARP ETF (NYSEARCA:SPGP) in June 2023, cautioning readers against an investment due to its high exposure to volatile Energy and Material stocks. Despite these risks, SPGP proved solid, gaining 9.49% and matching the gains of the SPDR S&P 500 ETF (SPY). Since it began tracking its current Index, SPGP has outperformed the SPDR Portfolio S&P 500 Value ETF (SPYV) and the SPDR Portfolio S&P 500 Growth ETF (SPYG) by 11% each on total returns.
The result is impressive, but I worry about investors chasing performance. Since I downgraded SPGP from “buy” to “hold” on April 28, 2022, SPGP has lagged SPY by 1.47% and SPYV by 6.47%. If you select ETFs based on historical returns, you might consider that all of SPGP’s alpha was generated between October 2020 and March 2021, when it beat SPY by 18.18%. I don’t think it’s prudent to emphasize such a unique period, so I have yet to decide whether SPGP was just “lucky” or its strategy is superior. Ten-year returns provided by S&P Dow Jones Indices don’t suggest the approach is anything special, and although that includes the results of a backtest, I’m not comfortable jumping on the SPGP bandwagon just yet.
That said, there are benefits to evaluating SPGP’s semi-annual reconstitutions, as it highlights market segments that are priced well. The most recent one occurred a few weeks ago, and the first part of this article will address those changes. The second part will compare SPGP’s fundamentals alongside other ETFs with attractive combinations of growth and value. I look forward to taking you through these options and answering your questions in the comments section afterward.
SPGP Overview
Strategy Discussion
SPGP tracks the S&P 500 GARP Index, selecting 75 S&P 500 Index stocks each June and December based on five screens:
- Three-year earnings per share growth
- Three-year sales per share growth
- Financial leverage
- Return on equity
- Earnings-To-Price
Growth scores are calculated for all S&P 500 companies, with the top 150 qualifying. The list is cut to 75 based on quality and value scores, with components weighted by their growth scores. This order of operations is important because it’s evident the selection process favors growth stocks. As a result, it’s notable when value stocks are selected instead, implying that growth stocks are so overvalued that it doesn’t matter what growth potential they offer – it’s not worth it. That happened in December 2021, and the Index has lacked solid sales and earnings growth rates since.
December Reconstitution Summary
December’s reconstitution was relatively uneventful, with only nine substitutions. The additions were as follows:
- Enphase Energy (ENPH): 1.83%
- Deere & Co. (DE): 1.56%
- Tapestry (TPR): 1.35%
- ON Semiconductor (ON): 1.31%
- Lamb Weston (LW): 1.01%
- Visa (V): 1.01%
- Microchip Technology (MCHP): 0.99%
- Raymond James Financial (RJF): 0.98%
- W. R. Berkley (WRB): 0.96%
Most additions are from the Technology and Financials sector, but the total impact by weight is only 11.00%. As offsets, the Index deleted nine stocks:
- Moderna (MRNA): 2.13%
- Weyerhaeuser (WY): 1.64%
- Generac Holdings (GNRC): 1.53%
- C.H. Robinson Worldwide (CHRW): 1.19%
- Dow (DOW): 1.05%
- Cigna (CI): 0.90%
- Procter & Gamble (PG): 0.89%
- Arch Capital Group (ACGL): 0.88%
- Accenture (ACN): 0.82%
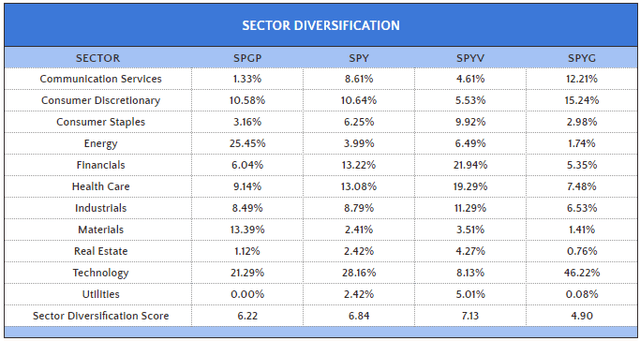
The combined weight of these nine stocks was 11.03%, with Accenture as the only Technology company. The net result is a 21.29% allocation to that sector. Energy exposure remains high at 25.45%, and I reiterate the cautionary point from my last review that this is excessive. Since energy prices are impossible to forecast, so are the growth rates assigned to this sector.
SPGP Fundamentals
High-Level Summary
The following table provides a summary of SPGP’s high-level fundamentals. We can use this as a starting point to identify its strengths and weaknesses by comparing it with SPY, SPYV, and SPYG.
The Sunday Investor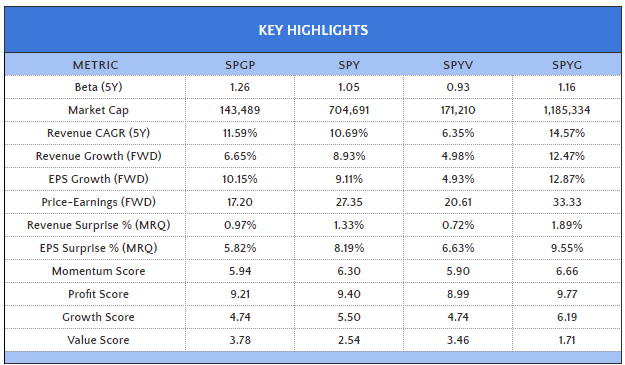
SPGP’s estimated sales and earnings growth rates are 6.65% and 10.15% and are closest to SPY. However, it trades at just 17.20x forward earnings, the cheapest among the four. SPGP’s weighted average market capitalization of $143 billion reflects the presence of at least some mega-cap stocks, and its 1.26 five-year beta reflects high exposure to Energy and Materials.
GARP investors often calculate a stock’s PEG ratio, short for price-earnings to growth. If we divide SPGP’s 10.15% estimated earnings per share growth rate into its 17.20x forward P/E ratio, we get 1.69x compared to 3.00x, 4.18x, and 2.59x for SPY, SPYV, and SPYG. Since investors prefer this number to be as low as possible, SPGP stands out for the better.
However, this table contains a clue that more analysis is required. In the bottom three rows, I calculated a profit, growth, and value score based on individual Seeking Alpha Factor Grades. SPGP’s 4.74/10 growth score substantially lags behind SPY and SPYG and matches SPYV’s score. The reason is that this score evaluates each stock with its sector peers, so it’s a better apples-to-apples comparison. Therefore, SPGP is not a great growth ETF at the moment, and by looking at the fund from the sector level, we see why.
Sector Summary
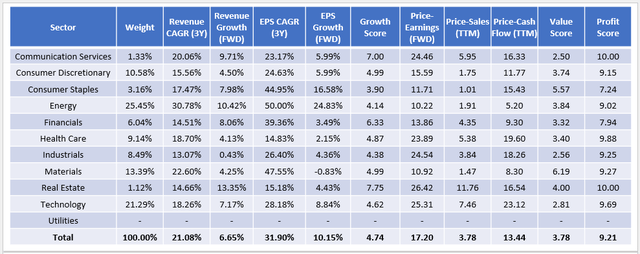
Energy is the main reason for SPGP’s seemingly strong fundamentals. SPGP’s Energy stocks trade at 10.22x forward earnings with 24.83% estimated earnings per share growth, or a 0.41 PEG ratio. With 25.45% exposure, the sector has considerable influence.
However, these estimates are unreliable. One piece of evidence comes from the EIA, with the one-year confidence interval for WTI crude oil spot prices ranging between $40 and $130 per barrel. Other experts also report a range of estimates, with a notable example being PIRA Energy Group’s $100-105 average estimate for Brent crude between 2012 and 2025. The average price was $75, or approximately $55 in inflation-adjusted dollars, and is lower than the firm’s $60 “Low Price” scenario, as described in this exhibit. My approach is to view Energy sector earnings growth estimates with the same degree of skepticism as experts for oil prices.
Besides, the sector’s 4.14/10 growth score could be better. SPGP’s selections in Real Estate, Communication Services, and Financials offer the best growth scores, but their weights are minimal. Instead, the fact that the ETF’s 3.78/10 value score is better than SPYV’s proves that SPGP remains firmly a value play.
Positive Takeaways / Three Alternatives
The best part about SPGP’s current composition is its high profit score (9.21/10), which doesn’t require much mega-cap exposure. Apple (AAPL) and Microsoft (MSFT) are members but with minimal weightings below 1.00%. Alphabet (GOOGL), Visa (V), Broadcom (AVGO), Exxon Mobil (XOM), and Chevron (CVX) are also present, but their average weight is only 1.30%. This 75-stock fund is reasonably well-diversified at the company level, and I’ve attributed this to the Index’s financial leverage and return on equity screens.
I can’t overstate the importance of these screens and how difficult it is to find high-quality ETFs with good growth and value scores. Among large-cap ETFs, I only identified 30 in my database, and most had poor profit scores. However, three caught my eye that I’d like you to consider:
- Invesco S&P 500 Revenue ETF (RWL)
- Pacer Lunt Large Cap Multi-Factor Alternator ETF (PALC)
- Avantis U.S. Large Cap Value ETF (AVLV)
As shown below, each alternative has profit scores above 9.00 and targets large-cap stocks, as indicated by their weighted average market cap figures. They’re also less volatile than SPGP and have more momentum than SPGP.
The Sunday Investor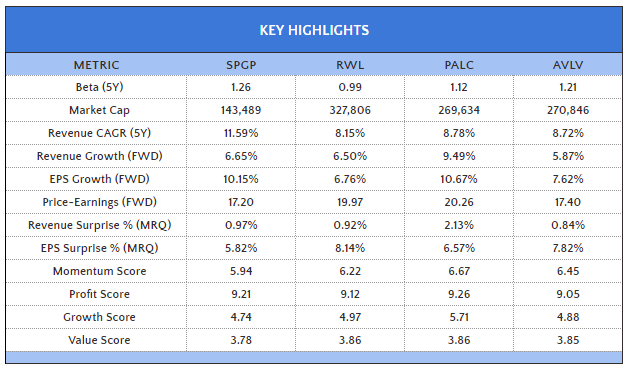
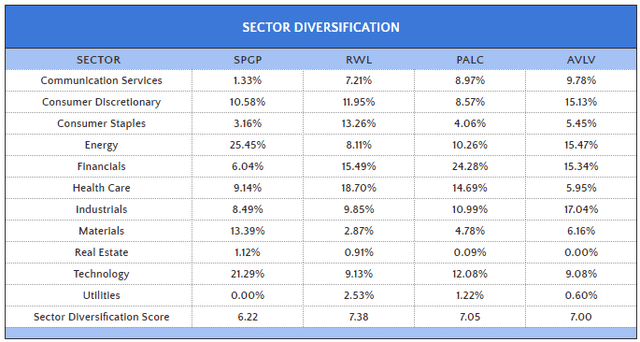
Another benefit is that they’re better diversified. RWL has 10%+ allocations to four sectors. PALC’s second-largest sector (Technology) is only at 12%. Finally, AVLV has exposures for all sectors below 20%.
Investment Recommendation
SPGP’s latest reconstitution resulted in nine substitutions and was mostly uneventful. The main takeaway is that it still has a value lean, evidenced by its 17.20x forward earnings valuation and 3.78/10 value score that matches SPYV’s. The portfolio’s high beta remains, as does its considerable exposure to Energy stocks. Given the unpredictability of oil prices, I ask readers to take that sector’s attractive fundamentals with a grain of salt.
Although SPGP is not a good growth fund today, there are few alternative ETFs with superior growth and value scores. I found three that did not sacrifice quality or diversification, but they are all value-oriented and will not automatically adjust should growth stocks become favored again. That makes SPGP unique and appropriate for style-neutral investors who want more activity than the standard passive fund offers. While it’s not for me, as I’m not convinced the strategy is better than SPY’s, I hope I provided enough information for you to make an informed decision. If I missed anything or you’d like further details, please feel free to comment below.


