Willie B. Thomas/DigitalVision via Getty Images
I have responded to more than 1,900 audience comments over the past year. It has been, for the most part, a fantastic experience. And since I feel like I’ve immersed myself into the Seeking Alpha community like a guitarist in a mosh pit (I wish!), I can now start to angle some of my articles toward helping identify and provide my personal opinions about the more “frequently asked questions” I receive.
One important and timely instance of this is the topic of playing investment “defense,” in the context of being a long-term investor. Because there are suppositions and facts, and when I did a deep dive (no mosh pit) into the inner workings of S&P 500 performance over two very telling time frames, I saw what I expected to see, but what I suspect many part-time or casual, index-buying investors would be surprised to hear about.
To clarify: I am a long-term investor. That means my goals are long-term. It also means that part of long-term success as I define it is not allowing for extended periods of down or flat returns to delay progress toward goals. That also means I aim to go well beyond the headlines and “conventional wisdom” about investing in this post-pandemic market climate, and draw conclusions about what’s really going on. I’m an analyst, after all!
Later in this article, I’ll show a detailed table, whose key conclusions are as follows:
- Since the S&P 500 peak at the start of the pandemic in February 2020, every stock in the S&P 500 has fallen by at least 20% at some point.
- The median “max drawdown” from peak to trough for the 492 stocks I analyzed was 47%.
- Since that time, more than four years ago, nearly two out of every five stocks have annualized returns of less than 5%, including dividends. While the future won’t likely resemble the past, with T-bills now yielding more than 5%, perhaps the next 4-5 years will be as tough or tougher on the “average stock,” whose mediocre performance since 2020 has been obscured by the outsized return of a small number of mega-cap stocks.
- 2023 and the first quarter of 2024 were generally strong for the S&P 500 and many of its stocks. However, how soon we forget the misery of 2022. That lands us with the fact that since the start of 2022 (now about 28 months’ time), 62% of the 492 stocks I analyzed have returned under 5% per year. And, nearly half of those stocks are down since 1/1/2022. This seems to me the most obvious example of what is known as “recency bias.” There are still many investors walking around thinking that the “whole market is doing great” when in reality, breakeven or worse has been as much the norm as anything.
- The indexes like the S&P 500 and Nasdaq 100 hide this. And it won’t matter until it does. With recent cracks in some mega-cap leaders, maybe that time is getting closer. Either way, it has major implications for how investors should be thinking about the stock market. Because this is the S&P 500, and small caps and non-US stocks have been decidedly worse over this period.
Bottom line: “long-term investing” is about more than simply “finding great companies and holding them,” at least in my view. And bonds don’t offer the defensive advantage they once did, other than via T-bills, as long as rates stay up there.
So, I’m very much a “long-term investor.” I am just not one who is going to risk sitting around hoping that whatever ills impact the global stock and bond markets pass like a storm with no damage. I’ll summarize it this way.
I am proactive in playing defense, using a limited amount of capital. Not instead of offense, but in addition to it!
Long-term investing has many definitions. Mine goes like this:
1. Establish a long-term watch list of stocks and ETFs I am willing to own “at a price”
This is based on fundamental and quantitative research that aims to cast a wide net: I want all sectors and many asset classes represented. That way, if I see that commodities, or small caps, or non-US equity or US Dollar bear or any other conceivable market niche is emerging as a high reward-to-risk situation, I already have my “go to” security or securities identified.
2. Create a set of core positions (stocks and ETFs) that will be the longest-term holds.
Supplement those core holdings with “support” positions which will tend to be held for less time, as they are either more volatile or situational. And, I keep a third rung on this ladder or “depth chart” as I call it. That is the “tail” segment, which contains the positions I’ll likely hold for shorter time periods, and devote less capital to them when I do own them. That’s because they are the most volatile of all the ones I follow. These tend to be higher-beta ETFs and option positions.
The idea is that “every market theme has its day… or several weeks to months, more likely,” and I want to be able to participate to some degree. Frankly, this is why my equity portfolio does not keep up with the Nasdaq 100 during years like 2023. I tend to focus my core stock positions on those which pay a higher yield than the S&P 500 by about 1-3% or so. None of the Magnificent Seven have met that criteria for a while (Apple Inc. (AAPL) was in range but years ago).
So if I do want to get a slice of that part of the market, I’ll do so over shorter periods of time, and using ETFs that own those types of stocks. Or, I’ll buy a call option on the Invesco QQQ Trust ETF (QQQ), the Technology Select Sector SPDR® ETF (XLK) or something of that sort.
3. Be willing to raise/lower the position sizes of those core holdings
By doing so, my aim is to own less during major drawdowns in those positions and own more during times when the reward outweighs the risk. That’s a subjective decision, so it means to execute that part, one has to have a process they are comfortable with, so it is not a constant guessing game.
It is also not “market timing” (to me at least) because I do this all as part of running one coordinated portfolio, where I know my total market exposure at any point in time, and which market scenarios and risks I am engaging with. This is something I did as an advisor and fund manager with “other people’s money” and now my wife and I are those “other people” since I am retired from the personalized advice business.
4. Study market history… continuously
It is one thing to say that today’s markets are so very different than those of even the pre-pandemic era, much less 38 years ago, when I first started in the business. It is another to be able to cite why it is different, and how that leads to what goes into an investment process. I spent years under the radar of other people’s “due diligence” and today the main critic of my work is me (and my wife), as well as anyone who reads my work here and elsewhere.
That brings me to some key statistics from the post-pandemic market environment that I think investors should have front and center if they are at all concerned about defending whatever nest egg they have amassed.
This table is as of last Friday. Focusing on the blue highlighted section, I note that “asset allocation” strategies, as portrayed by that set of four ETFs that have been around for a long time, show that since the market top that occurred as the pandemic started to “get real” for US investors, returns have been underwhelming.
The Aggressive allocation is 80% stocks and 20% bonds, and the other three (growth, moderate, conservative) have equity allocations of 60%, 40%, and 30%. Those are some mediocre returns for all but the more aggressive types. 1.4% a year for more than four years for a conservative investor doesn’t cut it for me. And I am a conservative investor, I just get there in a totally different way than traditional asset allocation. I incorporate inverse ETFs, options in small sizes, and position sizing as noted above.
In my recent appearance on Seeking Alpha’s the Investing Experts podcast I detailed some positions I currently own, and my recent articles supplement that to some degree.
Ycharts (data), Rob Isbitts (table)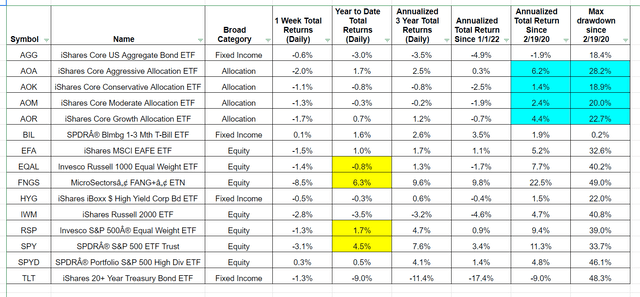
I find these to be great “benchmarks” for me, and they were for my clients back in my advisory days. Because we all realize that by purchasing any one of those ETFs, one could decide to “call it a career” as an investor and let the markets do what they do. I’d never do that because I don’t trust the stock and bond markets to deliver the returns I want when I want them.
So I apply plenty of risk management, which in recent years has been owning T-bills instead of long-term bonds (which is what those allocation ETFs tend to use), and not being nearly as “buy and hold” as the typical investor, even if my watch list for ETFs has not changed dramatically during this time. What has changed is my renewed interest in building a stock portfolio, gradually, as described in several past articles.
The other blue highlighted section should be paired with the annualized returns. These are the maximum drawdowns for each of those stock/bond allocation mixes, and as I see it, that column is the best “advertisement” for approaching modern markets differently that I can offer.
Here’s why: take the moderate “40/60” version of this, the iShares Core Moderate Allocation ETF (AOM), which I’m guessing is closest to where many retirees and pre-retirees would land within that group of four mixes. Since 2/19/2020, through a 33% crack in the S&P 500 in five weeks, a rabid recovery fueled by free money handed out, which spurred a consumer spending boom, then to the debacle for stocks and bonds (and the Fed?) in 2022, which tanked QQQ by 33%, and finally the vicious rally back to the old stock market highs and through them, where we still stand today.
Through all of that, AOM has averaged 2.4% per year, and “buy and hold/traditional asset allocation” investors had to deal with a 20% drawdown along the way. Pardon me, but that’s not a great tradeoff!
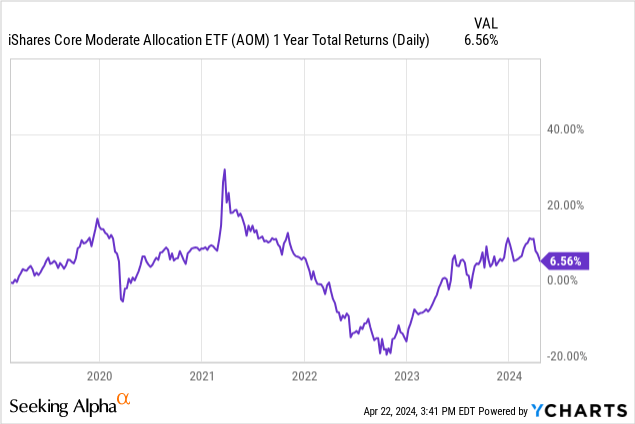
This chart shows every one-year “rolling” period total return for AOM since that February 2020 starting point. There were good times, like a 30% gain, and the aforementioned 20% loss, but what stands out to me is how often the one-year return was around zero or negative.
This is “history” now, but now we are in a battle with inflation, not to mention geopolitical battles in multiple spots around the globe. And, the speculative fever that has entered many parts of the market (0DTE options, anyone?!), and the generally casual, buy the dips atmosphere I think still permeates the investor population might represent an overhang on the major stock indexes repeating recent strong performance. I’ll also note that some folks are perma-bulls because their living and lifestyle depends on it. They make their money on a percentage of assets managed and think that means rooting for the market to always go up. I was in that business for a long time, and I always felt that the goal was to make money and don’t lose big, which is very different from “waving the flag” for everyone to stay fully invested and always finding an excuse to be bullish. That said, the opposite is true of perma-bears who sell fear for a living.
Me, I’m just trying to be a realist. So I aim to jam decades of time in the trenches to some basic lessons I’ve learned about risk management, humility, and the story the markets try to tell us through charts and investor behavior.
S&P 500 stock returns since the start of the pandemic: not what we might think
That brings me to the key piece of this part of that “story” which is not technical but quantitative. I went back and reviewed the stocks in the S&P 500 (492 of them, given that some are recent additions via IPO or merger), and looked at how they did during those same periods in the table above. Specifically: three years, since the start of 2022, and since 2/19/2020, the pandemic top.
Ycharts (data), Rob Isbitts (table)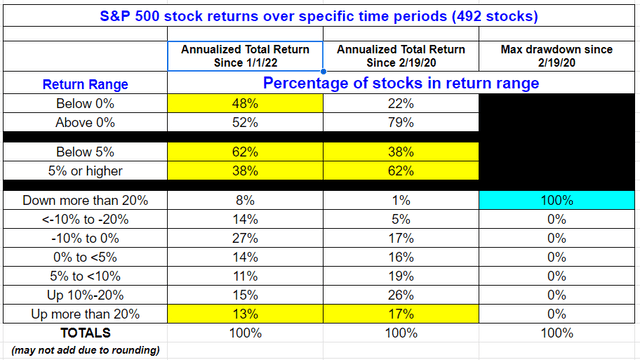
My guide to the highlights are in yellow and blue. In yellow, we see that since 2022 began, S&P 500 stock winners and losers are about even. That explains why the equal-weighted S&P 500 has been below the traditional capitalization-weighted S&P 500 since that time. By the way, this is 28 months’ time, and those are total returns, over those periods. This shows why defense is so important.
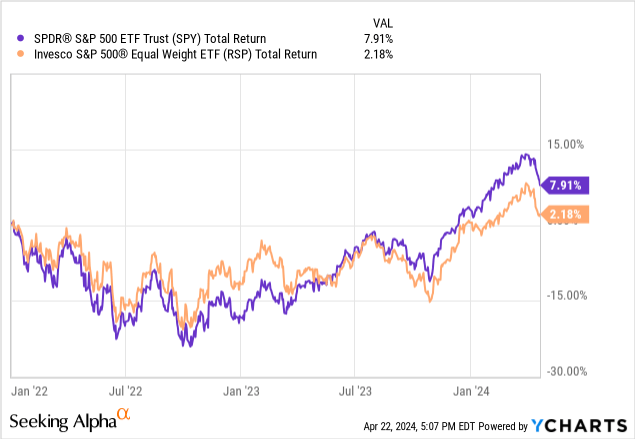
We’ve seen long periods of mediocrity in the stock market before. And it wasn’t too long ago. That’s SPY from the start of 2000 through the start of 2012.
12 years to turn $100,000 into $105,930, Yikes!
However, I suspect many of today’s investors did not endure this, and thus assume that “the Fed put will save us” or that something else will come to the rescue. That’s entirely possible. But I don’t want to count on that happening.
Seeking Alpha and Ycharts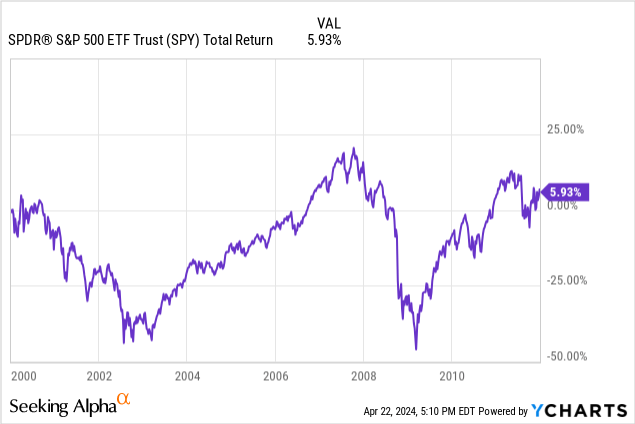
Tail risk hedging: a very basic example
I tried to create a quick visual to start to help translate this “tail risk” concept that is so important to me and was the key to my keeping investors from jumping ship during my professional investing career. This is NOT a recommended portfolio, just an introduction to the tail risk hedging concept.
The purple line is SPY, and the orange line is a portfolio I constructed by allocating 90% to SPY and 10% to the ProShares VIX Mid-Term Futures ETF (VIXM), which owns futures on the VIX volatility index out a few months. In other words, when VIX spikes (as typically occurs in panicky markets), VIXM flies. It gained more than 100% in a flash in early 2020 and was up about 17% when SPY fell nearly 20% during the first 5.5 months of 2022. When the market goes up slowly or quickly, VIXM sinks, as volatility drops or crashes.
I created this sample portfolio so that it rebalanced to that 90/10 mix at the end of each month. It might be a bit hard to see in the chart, but the 90/10 mix fell about 2/3 as much as SPY alone during early 2020 and the SPY-only line (purple) did not catch up to the slightly hedged version of SPY until very recently. The two lines end up at the same spot.
Ycharts.com (sample portfolio by Rob Isbitts0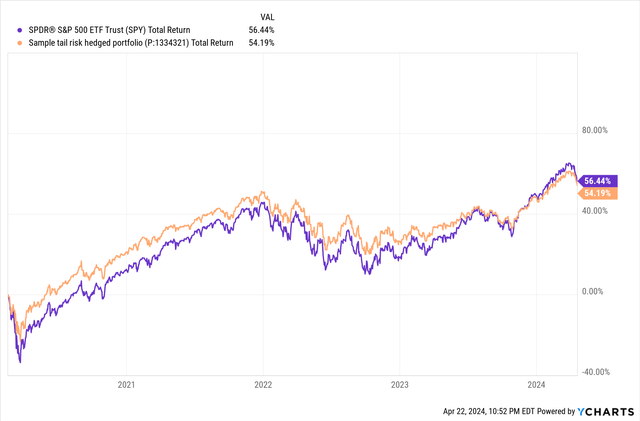
What did I prove here? That tail risk hedging does produce some moderation in portfolio declines, as it should. And, it can preserve capital in a way that can save an investor years of “making up for lost time and money.” Again, I can produce much more interesting examples and will do so if the audience and editors permit. Hedging is both science and art, and I have perhaps 50 different ETFs and an infinite number of options contracts (puts and calls) that can be deployed with the same goal: avoiding big losses that damage your portfolio and, frankly, investment psyche, as rough markets can do.
My personal approach to defending my own portfolio is primarily 3-fold:
1. T-bills are very nice contributors and earn enough return with virtually no downside risk that it frees me up to pursue returns more aggressively than I would if I wasn’t “banking” 5%+ on a big chunk of my portfolio. That won’t last forever, but for now, it is terrific!
2. Allocate only enough of my portfolio toward playing defense so that it does not soak up too much capital that could be earning long-term returns. This is where and why I use inverse ETFs, other ETFs that have a hedged/tail risk-fighting component to them, or small allocations to put options and call options on various parts of the market (ETF and index options).
3. Keep reminding myself that defense is like the concept of term life insurance. I wish I didn’t have to pay for it, but I’d rather take a little money out of my pocket on a regular basis to avoid having to figure out what to do with an eventual market decline. And, given the S&P 500 stock returns and returns of allocation ETFs since the start of the pandemic, more than four years ago, it is possible that an era of low returns is already upon us. That makes not losing big along the way that much more important, as market behavior during the first 12 years of this 24-year old century showed us.


