cemagraphics
Last weekend’s article concluded the S&P500’s (SPY) break to new all-time highs looked genuine and identified 4918 as the first upside target. 4906.6 was reached and led to a small reaction. Was that close enough?
This week’s article will look at the odds for continuation higher, and exactly what to look for when this strong trend tops and reverses. Various technical analysis techniques will be applied to multiple timeframes in a top-down process which also considers the major market drivers. The aim is to provide an actionable guide with directional bias, important levels, and expectations for future price action.
S&P 500 Monthly
With only three sessions remaining in January, the bar is set very high for a bearish monthly bar to develop. Now that the S&P500 has broken to new all-time highs, a monthly close below the breakout point of 4818 is needed to create a bearish bias.
While a bearish bar does not look likely, it is worth noting there can be a reversal from a neutral position like the October ’23 bottom. The last two sessions of October saved the bar from a close at the lows and the November bar cemented the reversal.
That said, the odds favor a strong January close and any reversal likely develops in February or later.
SPX Monthly (Tradingview)
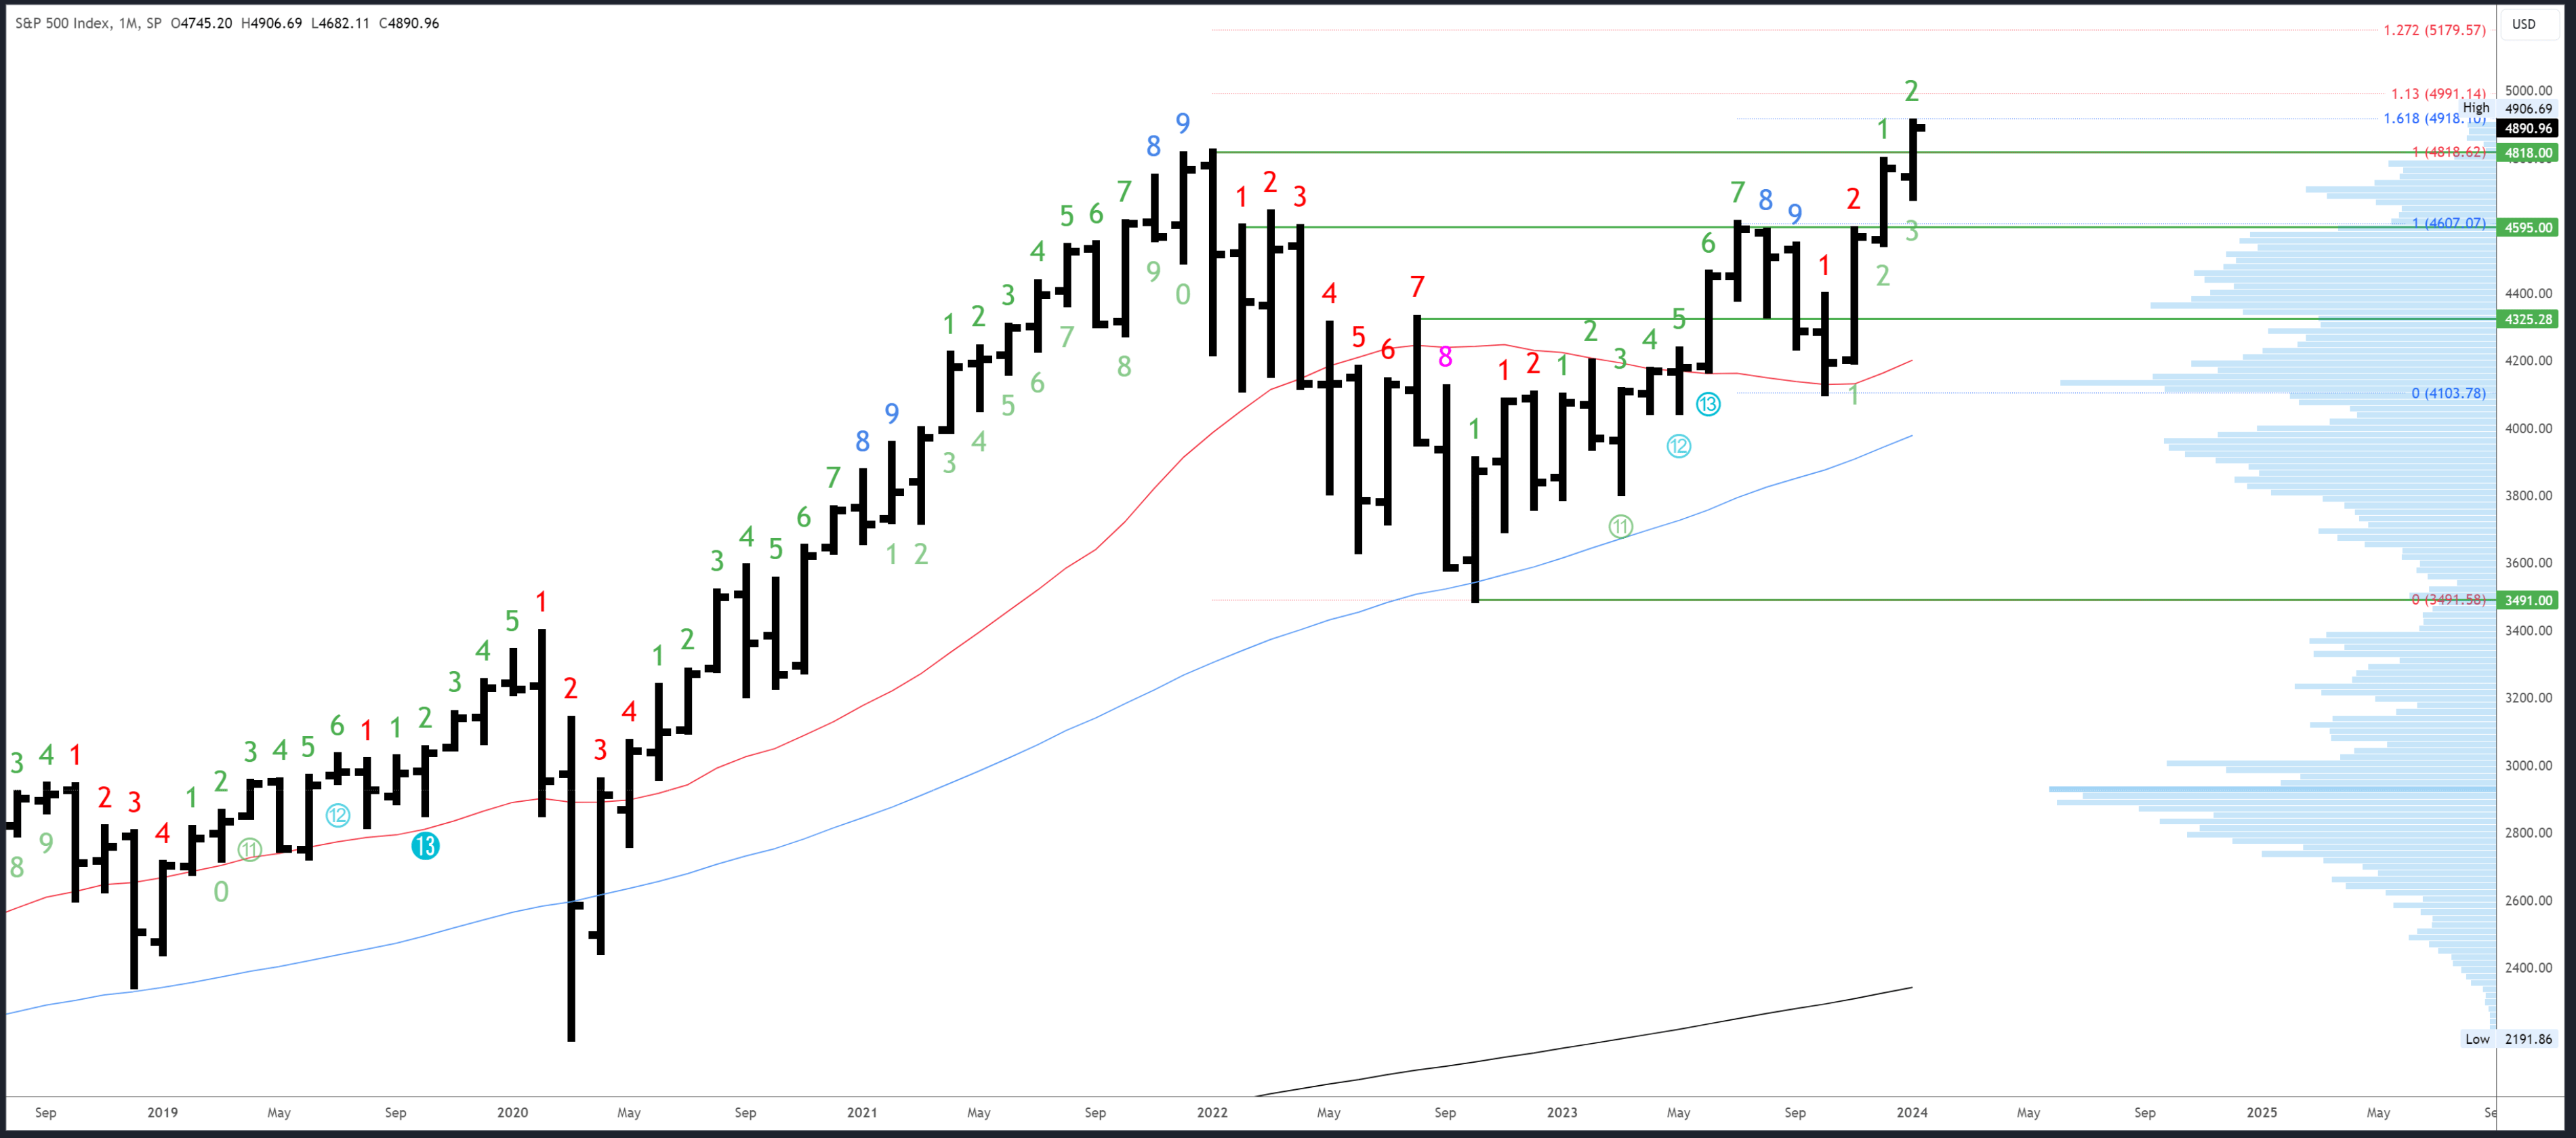
Now the S&P500 is in “blue sly” at new all-time highs, Fibonacci extensions and measured moves will act as a guide for targets. The first of Fib extension (the 1.618* extension of the July-October decline) comes in at 4918. Above that, 4991 is 1.13* extension of the 2022 decline.
4818 is obviously an important level for the breakout, with the January open of 4745 also key.
There will be a long wait for the next monthly Demark signal. January is bar 2 (of a possible 9) in a new upside exhaustion count.
S&P 500 Weekly
Once again, a strong weekly bar formed this week with another higher low, higher high and another highest close ever. As long as this continues to happen, the rally is likely to persist.
A reversal can develop in various ways and obviously I can’t list them all. One of the keys is to look for new lows of the week on Thursday and Friday instead of the new highs like we have been seeing the last three weeks.
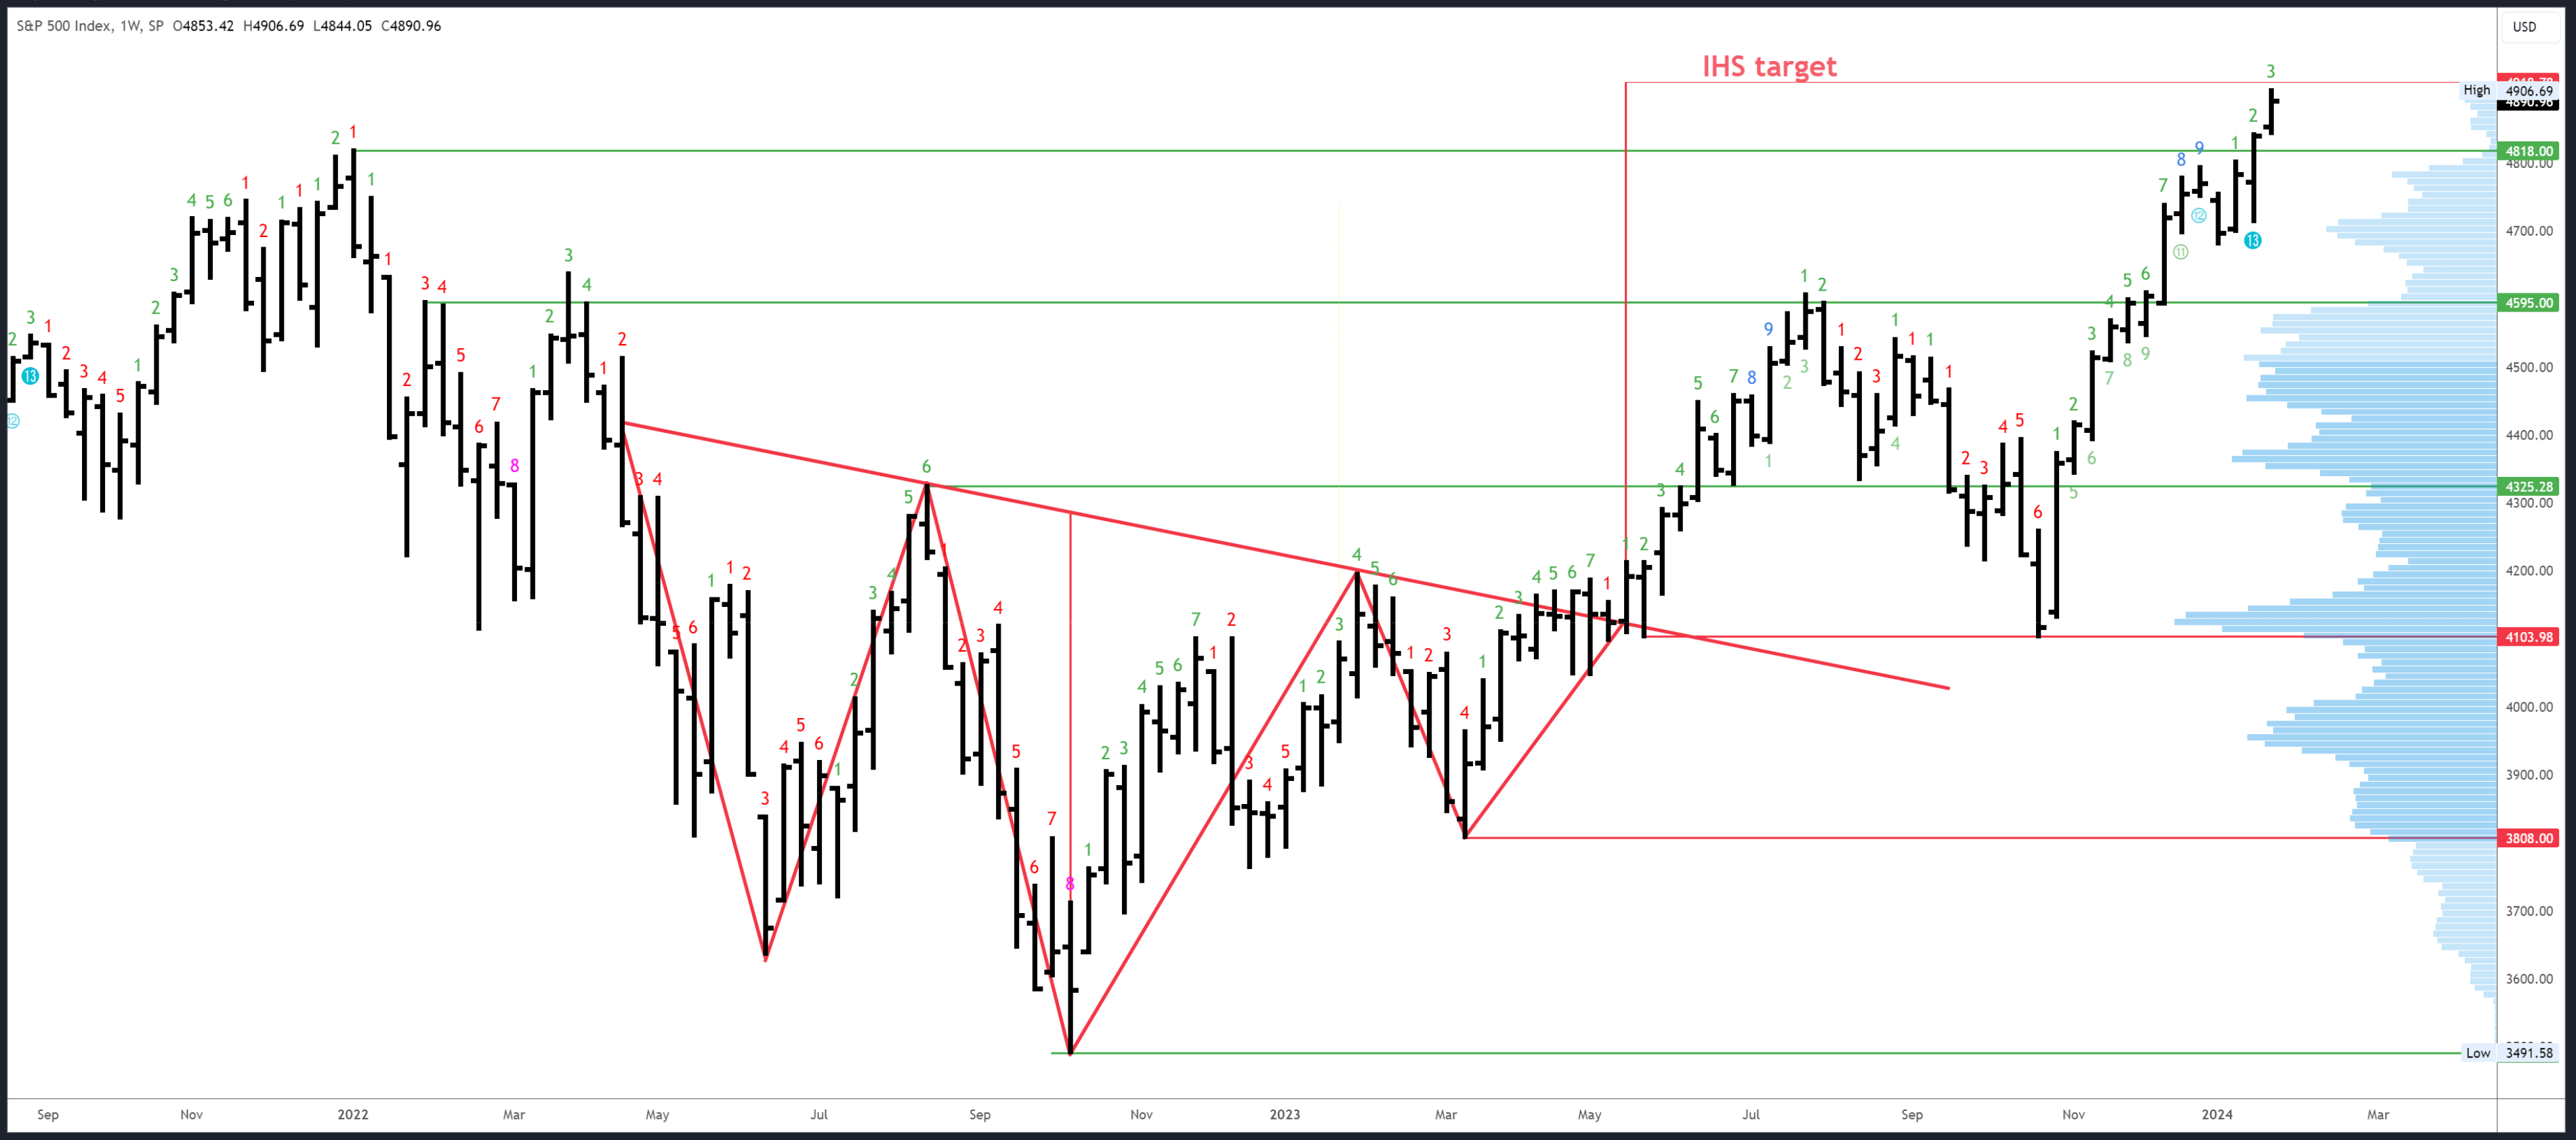
I always read through the comments under my articles and last week one reader asked about a developing inverse head and shoulders pattern. It reminded me of the large weekly pattern from the 2022 low which I removed from my chart after it triggered. Well, now I’ve checked again and it is nearly at its target, which just happens to be 4918, the monthly Fib extension target. This adds confluence to the target and increases the likelihood of a reaction.
SPX Weekly (Tradingview)
Potential resistance is 4918. There is channel resistance under 5000 but is too distant to be relevant next week.
Potential support is at this week’s low and the small weekly gap from 4842-44. 4818 is the next major level.
An upside Demark exhaustion count will be on bar 4 (of 9) next week. Also worth mentioning is that another Demark signal – a 9-13 – completed last week and could have an effect.
S&P 500 Daily
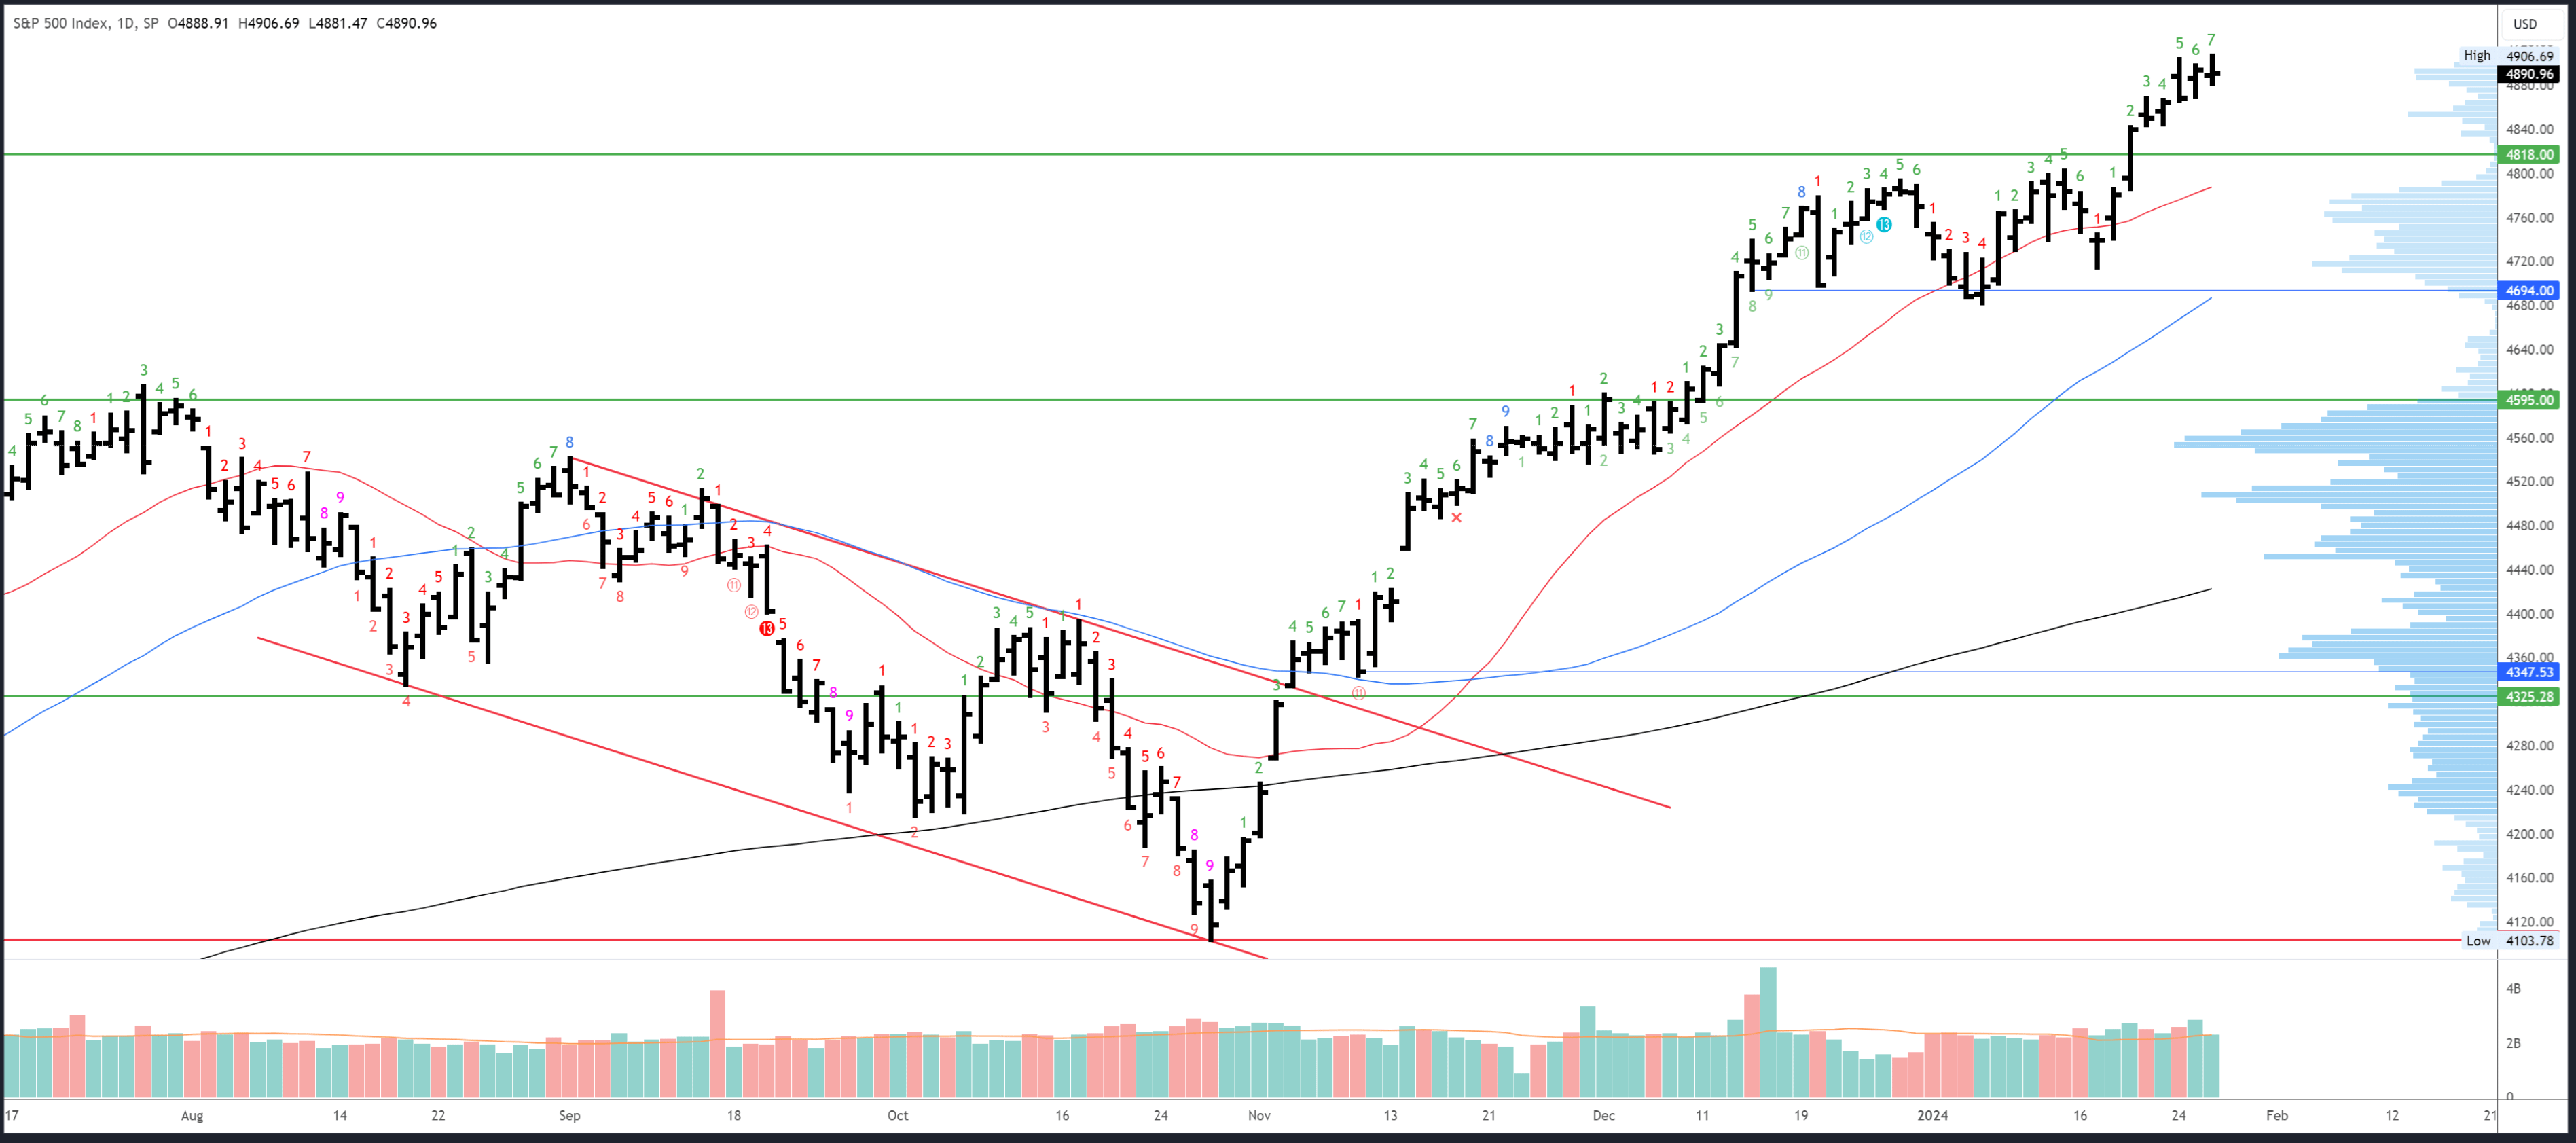
The daily chart reveals the price action this week was mixed. Wednesday’s weak session and Friday’s “doji” bar do reflect profit taking and indecision. After a 4% rally in six sessions, a consolidation seems needed and would be bullish if it can hold Monday’s 4844 low.
SPX Daily (Tradingview)
As well as 4918, there is a measured move (possible wave 5=wave 1) at 4967.
4865 is minor support. 4842-44 is more important.
An upside Demark exhaustion count will be on bar 8 (or a possible 9) on Monday which means we may see a reaction on Monday or Tuesday.
Drivers/Events
Economic data smashed estimates this week with PMIs and GDP showing the US economy is in better shape than many expected. If the Fed does cut in H1, it won’t be in response to data like this; inflation must prove it will be anchored near 2%. On that note, the Core PCE Price Index m/m came in at 0.2%. At a 3m or 6m annualized pace this is below the Fed’s 2% target.
Next week is very busy and full of potential stock market catalysts.
Monday’s focus will be on the Treasury’s Quarterly Refinancing Announcement. The last QRA was a big plus for bonds and stocks as less long-term debt was issued. Now the 10-year is near 4% rather than 5%, I expect less changes to issuance will and the market reaction could be a lot milder.
Wednesday’s FOMC meeting won’t deliver any changes to policy. A hawkish tone is expected to push back on the market’s dovish expectations but this has already been achieved up to a point as the odds of a March cut are now near 50/50 after being around 90% at the end of December. I am tempted to say Powell’s jawboning won’t matter, but I’ve found the market often reacts to things I sometimes take for granted and dismiss. If he does manage to convince the markets they are overly dovish, it could finally have an effect.
Friday’s Jobs Report is obviously important, but given other economic data has been solid, it would need to make a shocking miss to be relevant to the rate cut debate. I am reminded of last year’s January NFP which came after some improving data and posted a massive beat of +517k. The S&P500 topped that week and made a six week, -9% correction.
Earnings season hits a peak next week as 86 companies are expected to report, including the majority of the mega-cap Tech and Energy companies. So far, 124 companies have reported and 78% have beaten earnings estimates.
Probable Moves Next Week(s)
The S&P500 is approaching the target of 4918, and with a daily exhaustion signal due early next week and signs of slowing, a reaction is expected at this area. This doesn’t mean we should close all longs and go short, however. Targets are an opportunity to lighten up and re-assess. The most likely reaction is to form a bullish consolidation to set up higher.
A busy calendar could lead to a complicated week, but the TA is quite simple – as long as dips hold 4942-44, the near-term trend is in good health. Closing the week below or near 4942 would be a bearish development and likely lead to a test of 4800-4818. A break of 4800 should confirm the rally starting at the October low is complete and a large correction is underway.

 Q2 2024 Earnings Call Transcript")

