Yuichiro Chino/Moment via Getty Images
January 24, 2024
“It’s gonna take time
A whole lot of precious time
It’s gonna take patience and time, mmm.”
– George Harrison
Got My Mind Set on You
Risk assets had a good quarter and a good year following a very difficult 2022. On the economic front, the consumer remained resilient, but underlying economic trends remained poor. More on that below, but first, a review of Q4 performance for “primary” assets.[1]
Recall that in the third quarter, commodities were the lone primary asset class with a positive return. Well, it was the exact reverse in the fourth quarter. Commodities were down, but every other primary asset class was up. US equities were +11.6% during the three-month period. Global equities closely followed, up +11.2%. Safe-haven assets were up too. Long-dated US Treasury bonds were up +12.9% and gold was up +11.5%. Commodities, the outlier, were down -10.9%.
Consistent with the defensive posture we have maintained since late 2021, the Grey Owl All-Season[2] strategy moved sidewise for the period (up +0.1%) and the year (-1.6%). So far in 2024, stocks and bonds have bounced up and down on a weekly basis. This has been favorable for the GO All-Season strategy. Through the first three weeks of 2024 the approach has made modest progress +0.7% versus the 60/40 index of -0.7%.
Economic Growth
For several quarters now, we have shared charts depicting a decelerating economic environment in the US. Last quarter we acknowledge that there were potential signs of a bottom forming. Some of those signs have diminished, others remain positive, and additional data shows deterioration in new areas.
From the September (still contractionary) very short-term high, the manufacturing economy “re-decelerated” into December. The US ISM Manufacturing Purchasing Manager Index (PMI) summarizes in a single data point the state of the US economy. The PMI is a “diffusion index” which aggregates survey data from decision makers throughout the manufacturing economy. The questions are around the managers’ expectations (e.g. “do you plan to acquire more or less inventory next month compared to this month) and are thus a leading indicator of economic activity.
The PMI has been decelerating since March of 2021. It entered contractionary territory (below 50) in November 2022 and continued lower to 46 in June 2023. It went up to 49 in September (showing signs of life, but still contractionary), then reversed course back down to 47 for December.
Figure 1 – US ISM Manufacturing PMI Monthly (ycharts.com/indicators/us_pmi)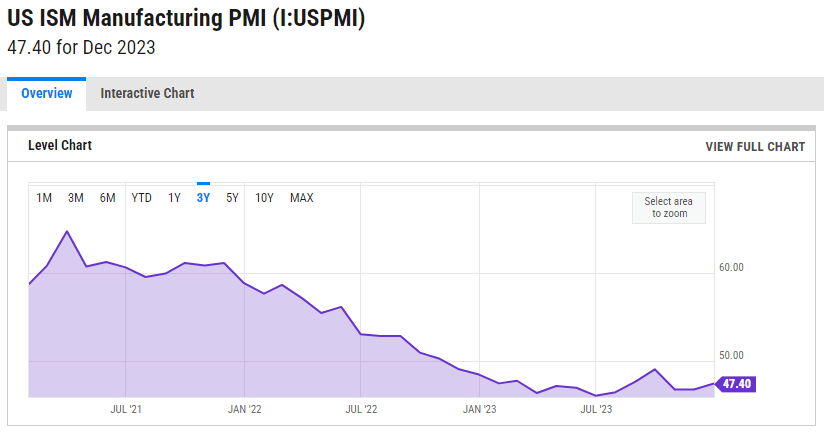
On the other hand, signs of life in Industrial Production remain. December showed the tiniest amount of year-over-year growth: +0.98%.
Figure 2 Industrial Production: Total Index (fred.stlouisfed.org/series/INDPRO)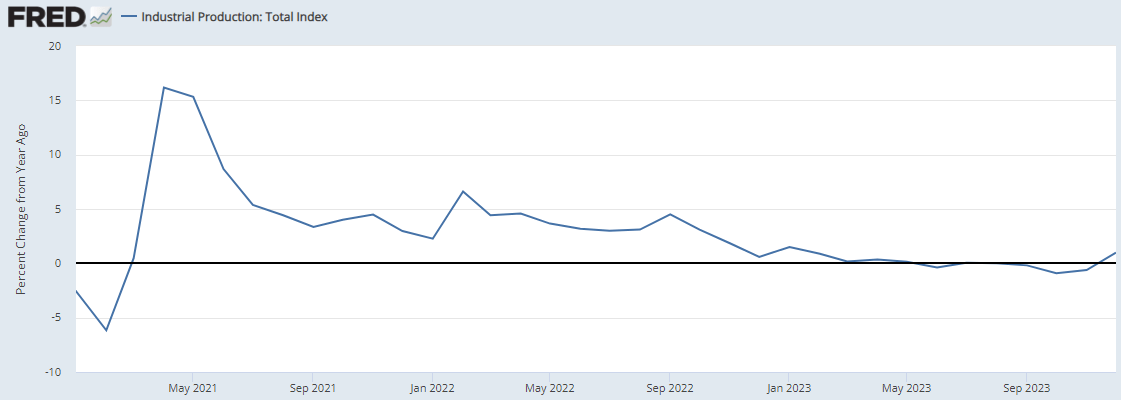
The rebound in retail sales also persisted. The Johnson Redbook Index return to year-over-year growth in retail sales that began in the middle of the summer continued at about that level through December.
Figure 3 – United States Redbook Index (tradingeconomics.com/united-states/redbook-index)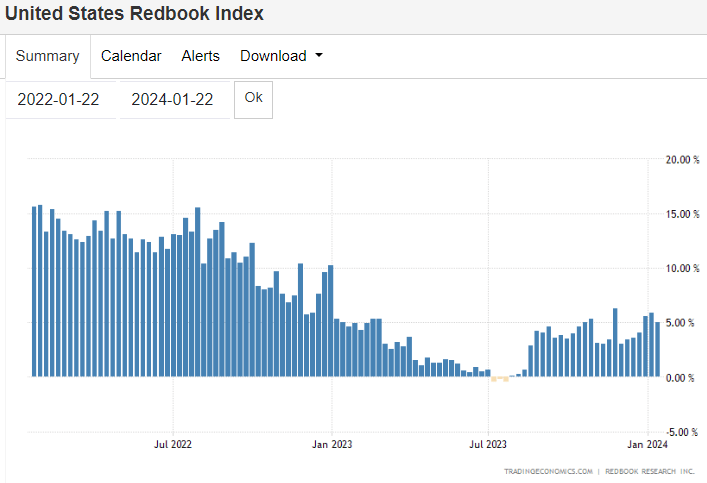
Now for the new bad news. Up until this point, the services economy has been fairly robust. The recessionary data over the past few years was contained within the manufacturing sector. Unfortunately, now there are signs that the services economy is running out of steam. In December, the employment portion of the US ISM Services Index showed intense deceleration to a very contractionary 43.3. Is this a one month anomaly, or an early indicator that Covid-era consumer and corporate cash piles are beginning to run low?
Figure 4 – US ISM Services Employment Index (ycharts.com/indicators/us_ism_non_manufacturing_employment_index)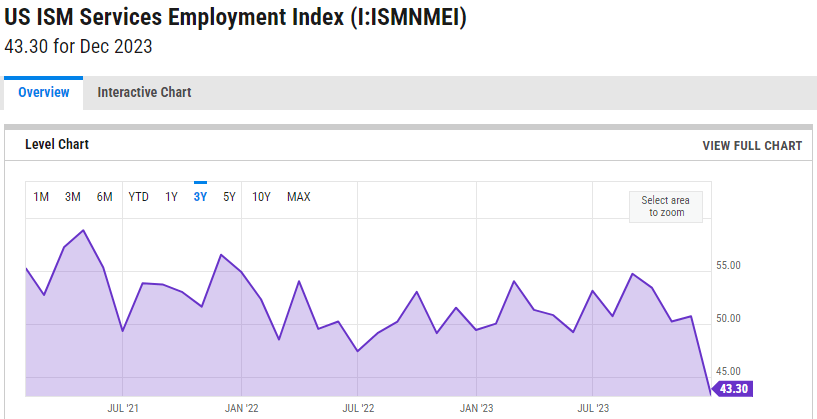
It is also worth noting that of the 2.55 million jobs created in 2023, 25% were in the government sector. According to Tier1 Alpha, historically, anything above 10% signals an approaching recession.
The rhetorical question we posed last quarter remains relevant: Did the US economy already experience a “soft-landing?” Has the rebound begun? Perhaps, but it seems unlikely. More likely is that unsustainable government and consumer borrowing has extended the cycle.
Borrowing to Spending
After modestly contracting from the 2020 Covid stimulus, federal government spending resumed growing on a quarter-over-quarter basis in the second quarter of 2021 (from a level significantly higher than the pre-Covid baseline). It continued in the third quarter of 2023.
Figure 5 – Federal Government: Current Expenditures, Billions of Dollars, SAAR (fred.stlouisfed.org/series/FGEXPND#0)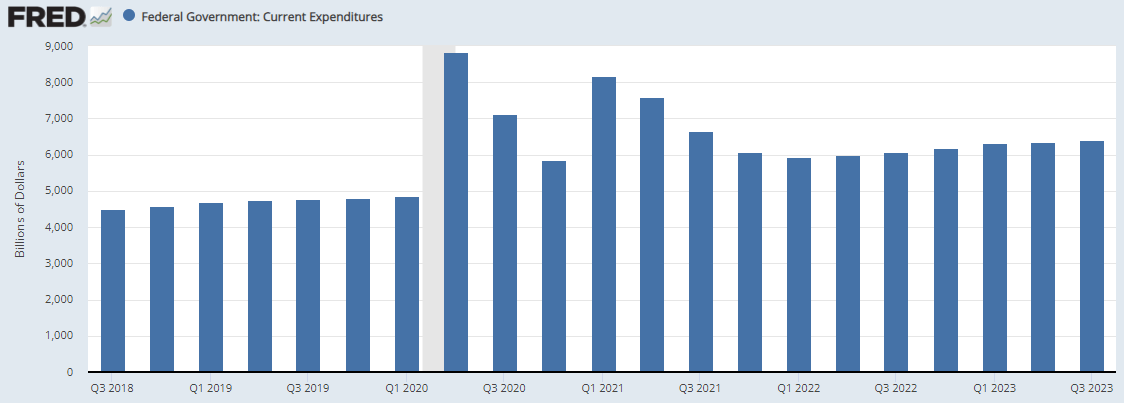
How long can this continue? Who knows for sure, but some of the last remaining pandemic era programs are finally winding down.
Inflation
For the last two quarters we wrote that inflation may be reaccelerating. Since our last letter, that trend seems to have abated. We showed the below chart highlighting that since the beginning of May both commodity prices (orange in the chart below) and the 5-Year Breakeven Inflation Rate (blue in the chart below) working higher.
Figure 6- Trading View – Track All Markets (tradingview.com)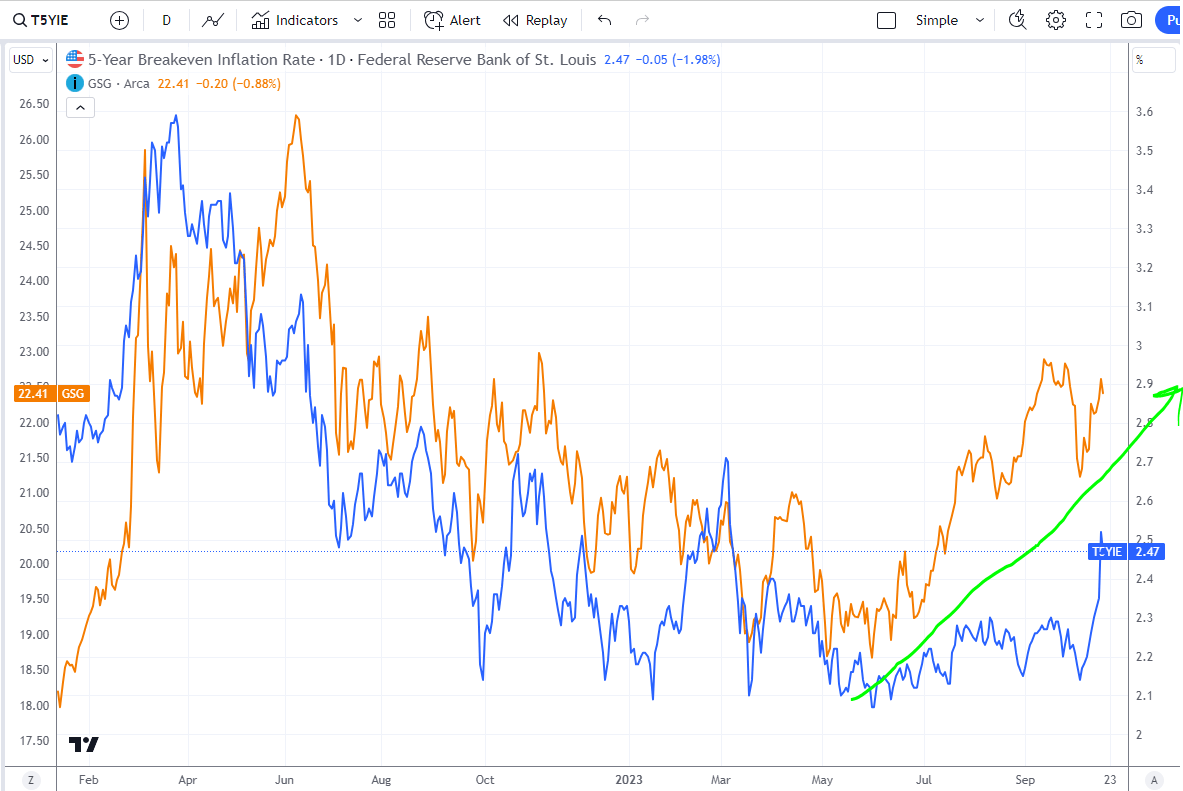
Today, the chart depicts a retreat in commodity prices (orange) and the 5-year Breakeven Inflation Rate (blue) bouncing around between the low and mid-2s. Should this continue it is likely favorable for bonds. Energy is just over 50% of the index and oil is near a multi-year low range between the high $60s and low $70s.
Figure 7 – TradingView – Track All Markets (TradingView.com)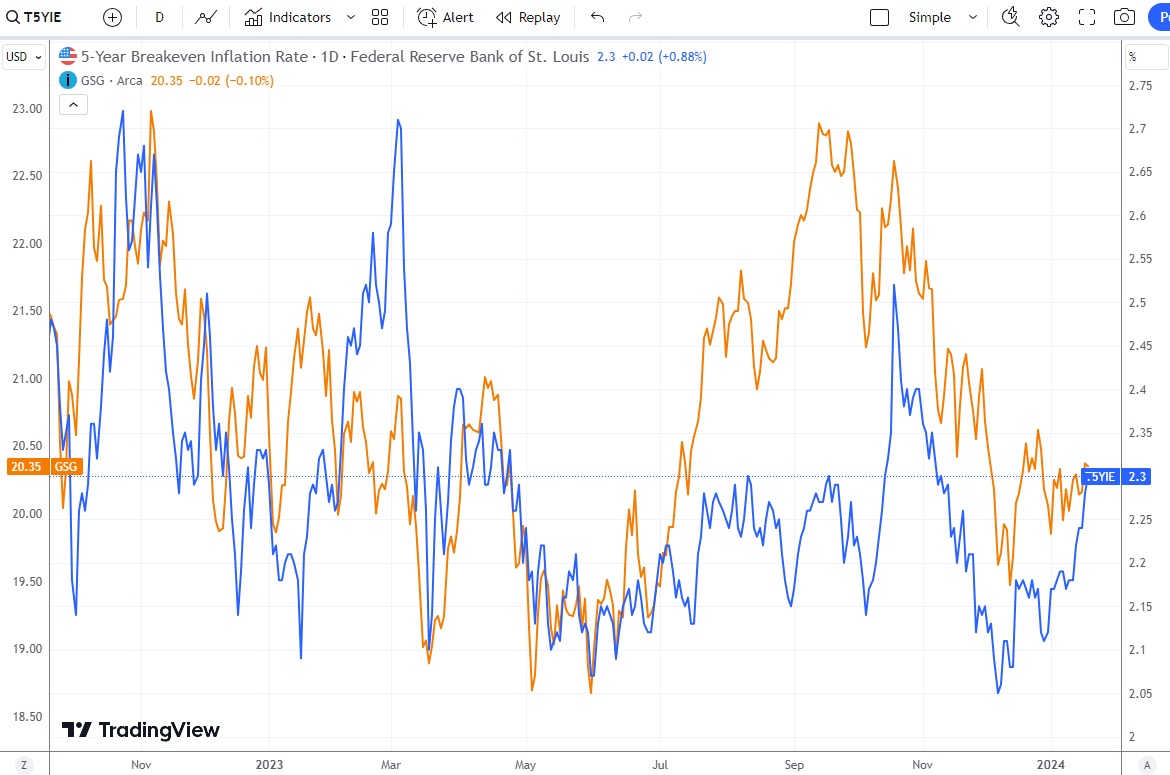
Different, but the Same
It is worth reiterating a point we have made before and providing a few new slices of data to corroborate. This time isn’t different – there is still an economic cycle. But, the Covid-era spending (transfer payments) did allow both corporations and individuals to build a cash cushion that has slowed the progression of the downward portion of the economic cycle.
Offices are one example where the cycle is developing very slowly. A recent Wall Street Journal article noted that office vacancy recently reached a new record. Unfortunately, that doesn’t come close to telling the full story. The actual occupancy rate shows buildings are more than twice as empty.
Figure 8 – US Office Vacancy Rate (wsj.com/real-estate/commercial/offices-around-america-hit-a-new-vacancy-record-166d98a5) Figure 9 – Kastle Systems – Data Assisting in Return to Office plans (kastle.com/safety-wellness/getting-america-back-to-work/)
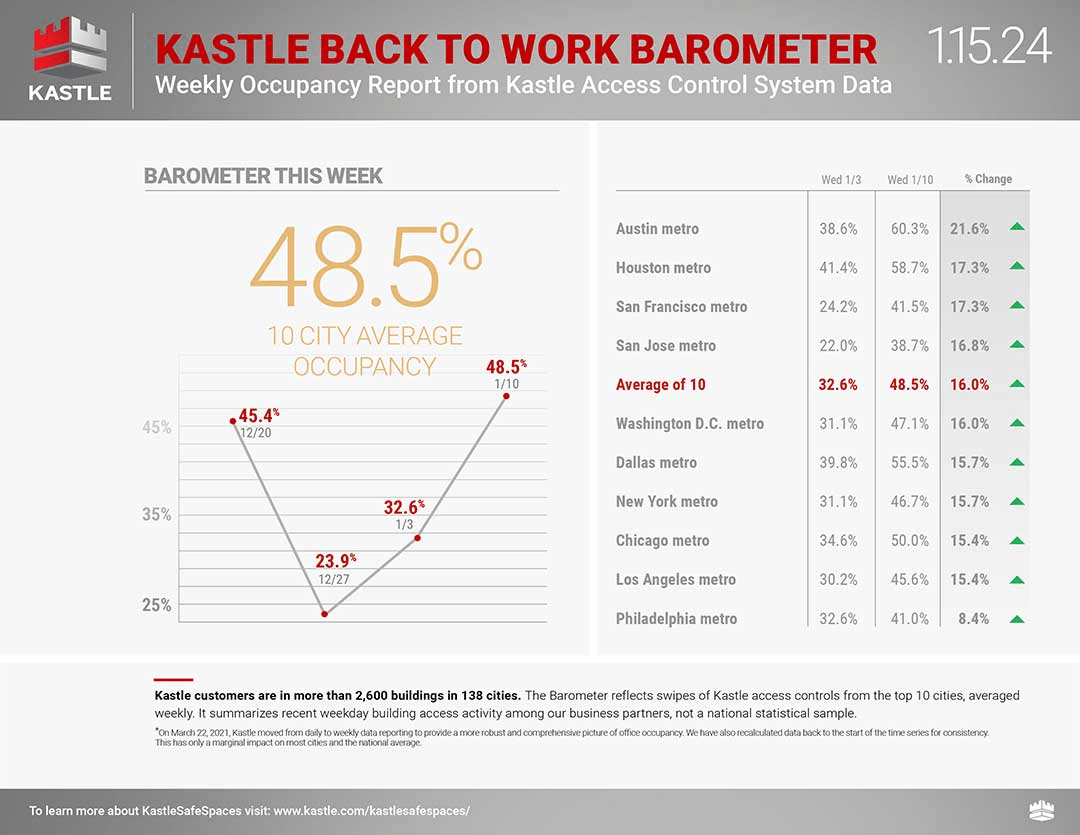
Until the leases “roll” the office building owners will not be forced to come to terms with their new lower valuations and income streams.
A similar slow-moving dynamic is playing out in the venture world. This situation was described in a recent episode of “This Week in Startups.”(Emphasis ours.)
“David Weisburd: According to Peter Walker at Carta, Carta represents roughly 50% of the [venture] market. So roughly 1500 or so companies at large, died in 2023. This equals the largest death toll for startups since the dot com crash of 2001. The question becomes, will more startups die in 2024? John Redmond from Discovery a $2.5 billion hedge fund in Connecticut has estimated that roughly 1200 private companies will quote, unquote exhaust their financial reserves by the end of 2024.
Bill Gurley: I would expect 2024 to be just as bad as 2023. And the gauge I’m using to estimate the window is just how much capital people had. And so there were numerous LP decks that I was privy to see, you know, a year ago where people brag that 80% of their companies had 2 to 3 years of cash. And so the day of reckoning is really where you get to the end of that.”
(The full transcript is available at: Bill Gurley, Brad Gerstner, & Jason Calacanis on the state of tech markets, hosted by David Weisburd | E1875 – This Week in Startups)
Consumer spending, employment, profit margins (from slow to reset corporate loans) are all adjusting to new economic dynamics on a delayed basis. Perhaps a long enough delay means a soft-landing (or better) develops. Multi-year stagnation is also possible, as is a traditional recession where assets are forcibly transferred from weak to strong hands.
Market Signals
Equity market performance remains resilient as the largest capitalization equities continue to drive a significant amount of overall performance. Since the end of 2021, the S&P 500 is up a modest +4.6% while the Micro-capitalization index is down -17.1% (as depicted in the chart below). That positive result is largely driven by a few mega-capitalization stocks.
Figure 10 – Trading View – Track All Markets (tradingview.com)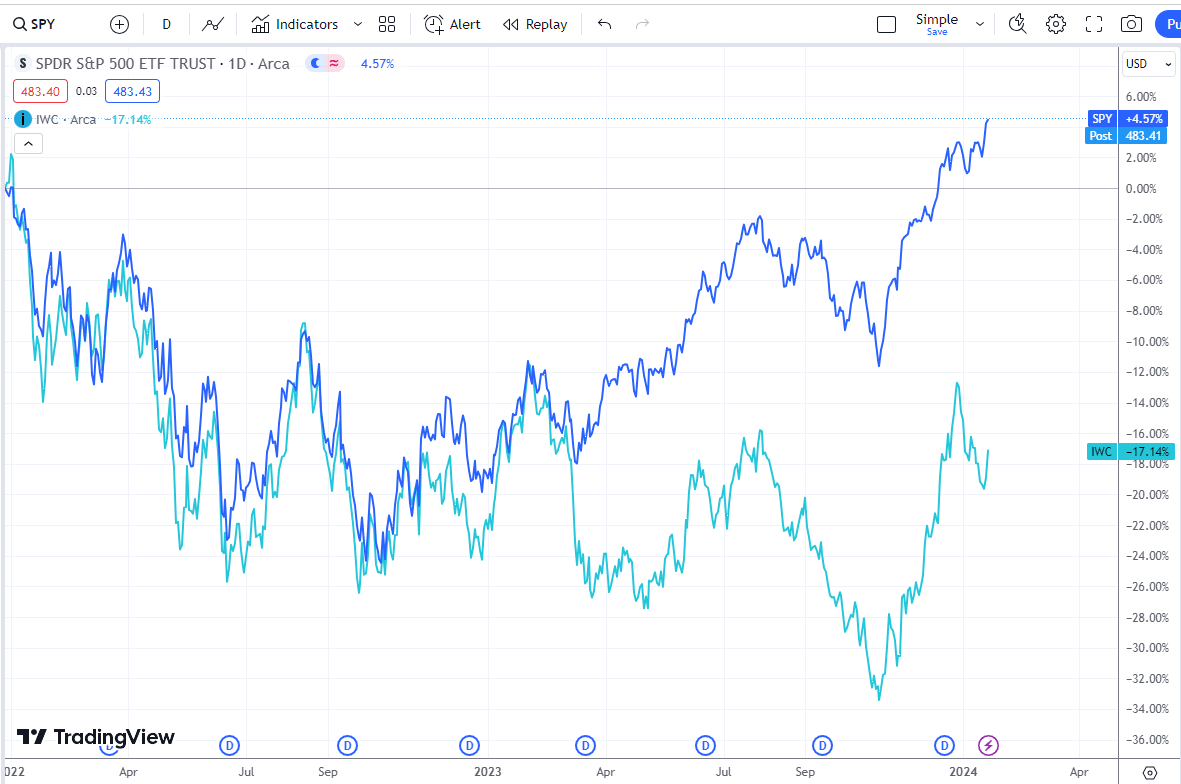
Cautious, Yet Open Minded
Since the end of 2021, we have positioned the Grey Owl All-Season portfolio for a risk-off environment. It has come in spurts but has not fully developed. While our cash allocation remains large, it is lower than it has been in recent quarters. We have more exposure to idiosyncratic risk-assets including India, insurance, momentum, utilities, crypto, uranium, and emerging markets (excluding China). Our true hedges were a drag in 2023. In retrospect those cash and hedges were too much belt and suspenders. Today the hedges are smaller. Regarding cash, it is important to point out that this position today yields approximately 5% annually. For the first time in fifteen years, it pays to be cautious.
The US economy has held up better and longer than most believed possible. While the evidence points to unsustainable borrowing as the most likely explanation, it is impossible to say when it would truly become unsustainable.
*****
[1] We refer to US equities, long-dated US Treasury bonds, gold, and commodities as “primary” asset classes borrowing the language of HCWE & Company. The idea is that these four assets best capture two variables that explain a significant amount of asset price movement: global growth (explained by investor risk sentiment) and inflation. This framework is the basis for a permanent portfolio, an “all-season” portfolio, risk-parity, etc. US equities and commodities are “risk” assets, while US Treasury bonds and gold are “haven” assets. The market (or asset class) returns are measured on a total return basis using index exchange traded funds (ETFs): SPY for the S&P 500, ACWI for the MSCI All-Country World Index, GSG for the S&P GSCI Commodity Index, TLT for 20+ Year Treasury Bond index (i.e. “long-dated” US Treasury bonds), and GLD for gold.
[2] Despite the generic and frequent use of the term, we renamed our strategy Grey Owl All-Season after Bridgewater Associates requested we do so claiming it conflicted with a strategy they call All-Weather.

 Q2 2024 Earnings Call Transcript")

