angel_nt
A guest post by Ovi
Below are a number of Crude plus Condensate (C + C) production charts, usually shortened to “oil”, for oil-producing countries. The charts are created from data provided by the EIA’s International Energy Statistics and are updated to September 2023. This is the latest and most detailed/complete World Oil production information available. Information from other sources such as OPEC, the STEO, and country-specific sites such as Russia, Brazil, Norway, and China are used to provide a short-term outlook for future output and direction for a few of these countries and the World.
World Oil Production and Projection
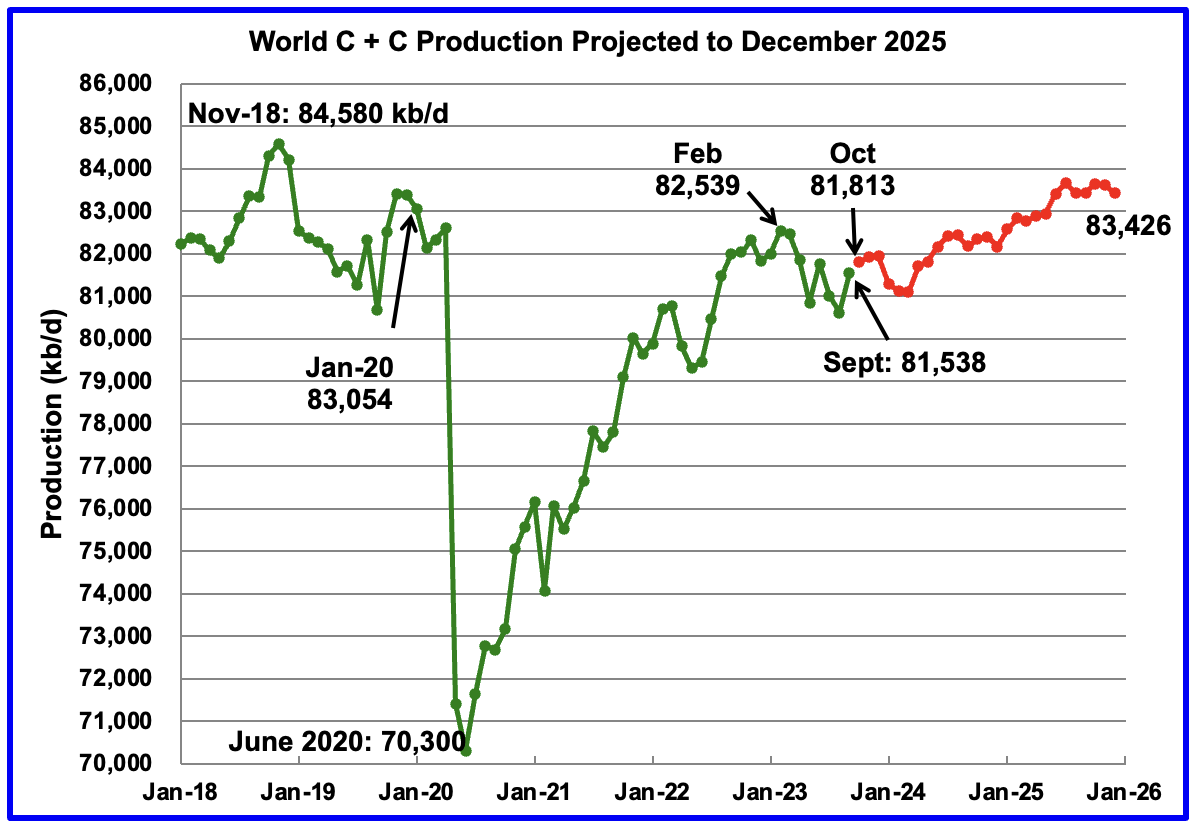
World oil production increased by 927 kb/d in September, green graph. The largest increase came from Saudi Arabia, 500 kb/d, while the US added 224 kb/d and Brazil 210 kb/d.
This chart also projects World C + C production out to December 2025. It uses the January 2024 STEO report along with the International Energy Statistics to make the projection. (Red markers).
The red graph forecasts that World crude production in December 2025 will be 83,426 kb/d and is 1,154 kb/d lower than the November 2018 peak. Note the large production decrease starting in January 2024. It could be reflecting the latest OPEC+ cut announced in November 2023.
From October 2023 to December 2025, production is estimated to increase by 1,613 kb/d or an average of 62 kb/d/mth.
Keep in mind that OPEC+ has close to 3,000 kb/d of cuts in reserve if required.
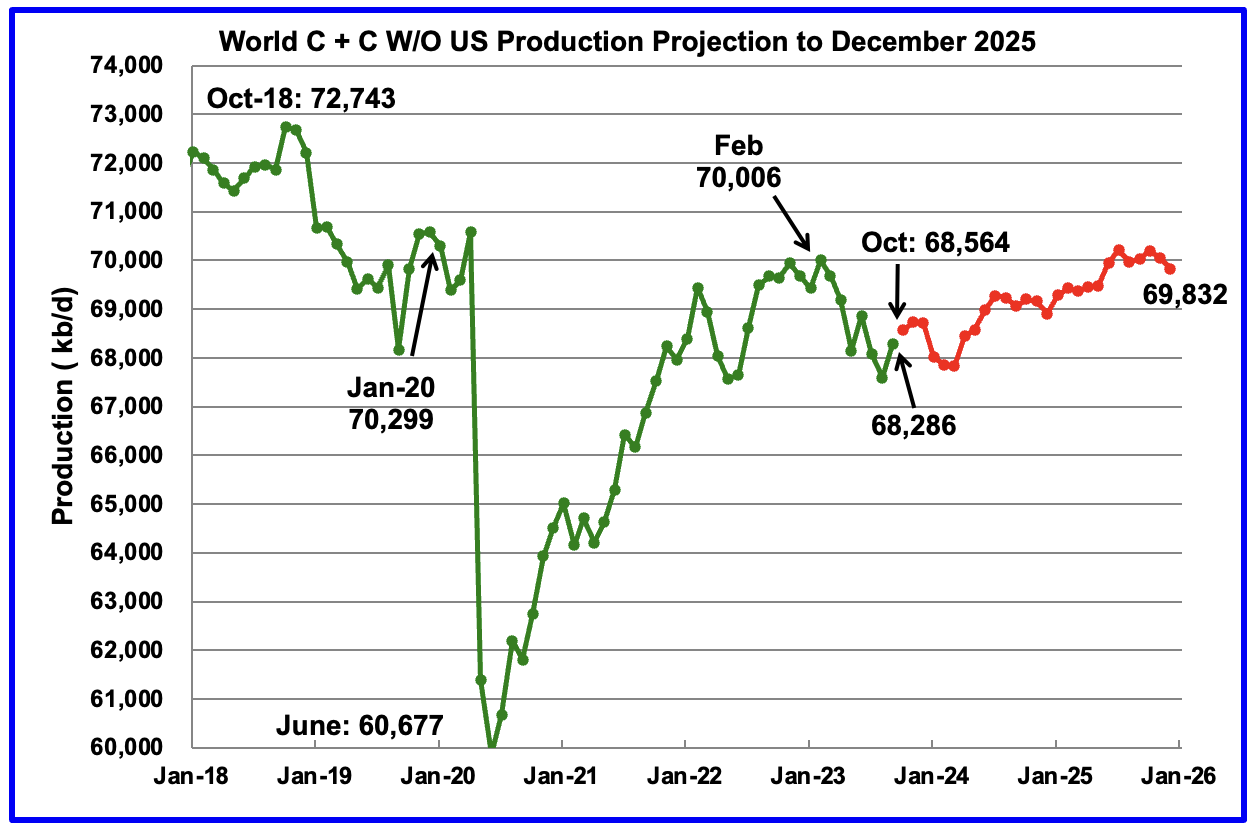
World without the US oil output in September increased by 688 kb/d to 68,286 kb/d. October is expected to add 378 kb/d.
Note that December 2025 output of 69,832 kb/d is lower than February 2023.
World oil production W/O the U.S. from October 2023 to December 2025 is forecast to increase by a total of 1,268 kb/d.
A Different Perspective on World Oil Production
Instead of dividing the World oil-producing countries into OPEC and Non-OPEC, this section divides the countries into two groups on the basis of their production capacity. The division will be The Big Three, US, Saudi Arabia and Russia, and the Rest, i.e., the World oil producers W/O the Big 3. The top producer in the Rest, currently Canada, produces less than half of the lowest producer in the Big Three.
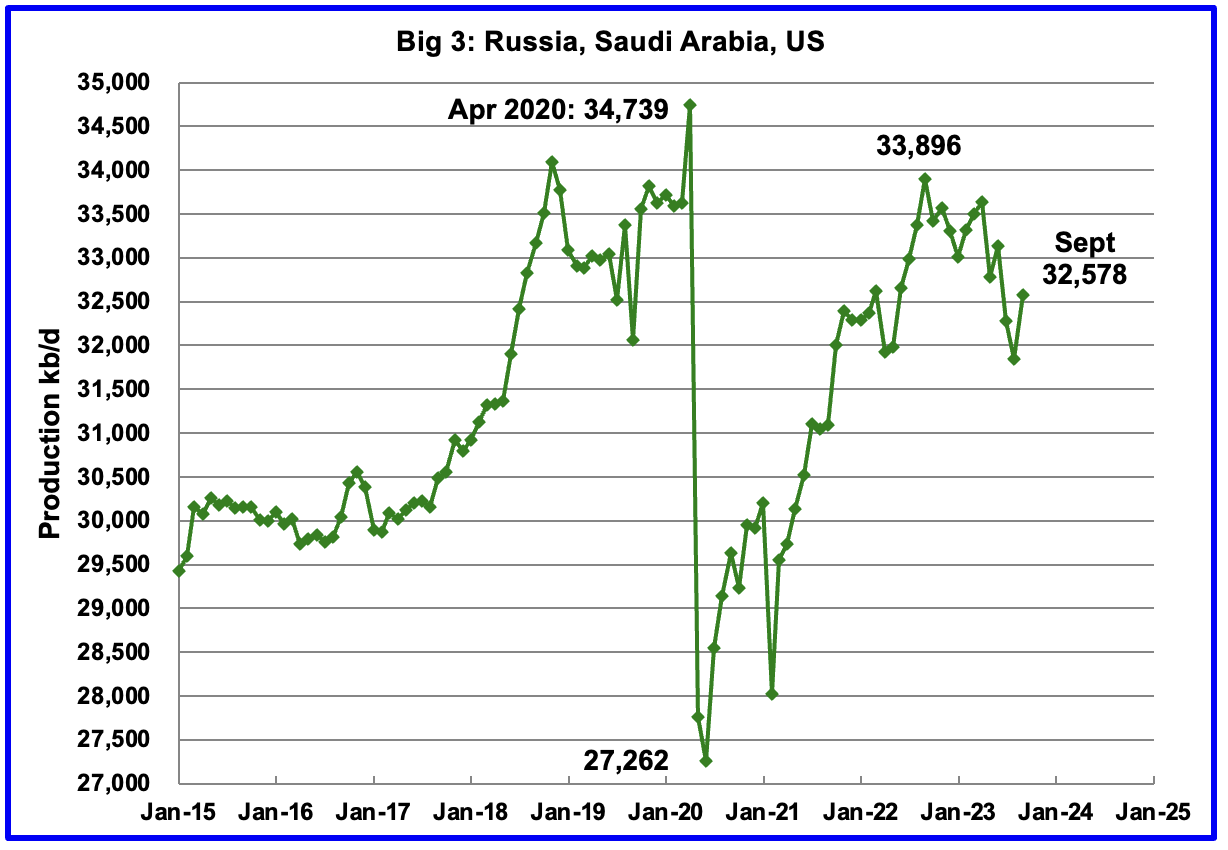
Peak production in the Big 3 occurred in April 2020 with a rate of 34,739 kb/d. The peak was associated with a large production increase from Saudi Arabia. Post-COVID, production peaked at 33,896 kb/d in September 2022. The production drop since then is due to cutbacks within the OPEC+ countries.
September production from the Big 3 increased by 730 kb/d to 32,578 kb/d.
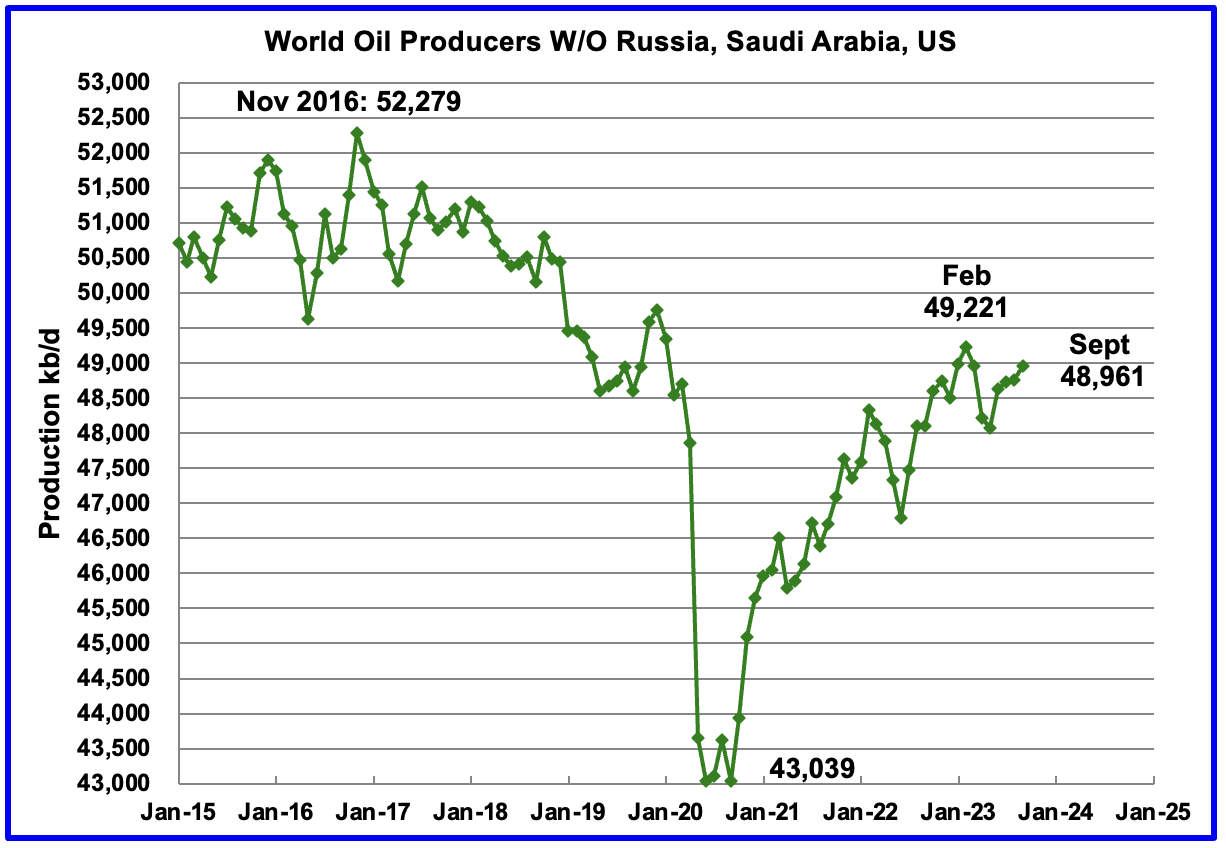
Production in the Rest has been slowly increasing since the low of September 2020, 43,039 kb/d. In February 2023, production rose to a post-COVID high of 49,221 kb/d. Output in September was 48,961 kb/d, an increase of 235 kb/d over August.
Production is down 3,318 kb/d from November 2016.
World Oil Production Ranked by Country
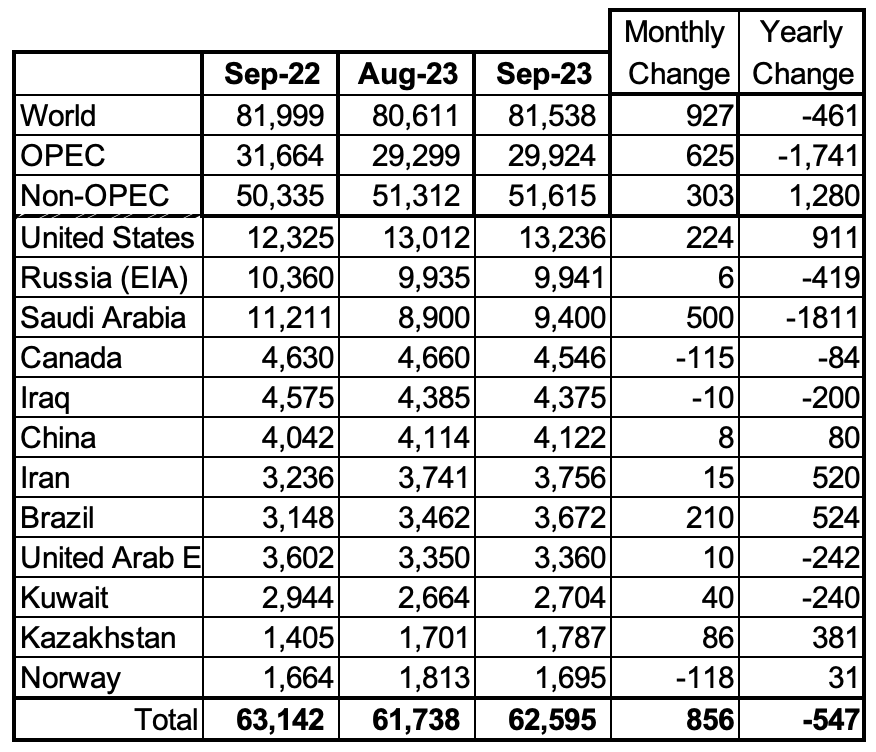
Above are listed the World’s 12th largest oil producers. In September 2023, these 12 countries produced 76.8% of the world’s oil. On a MoM basis, these 12 countries increased production by 856 kb/d, while on a YOY basis, production dropped by 547 kb/d. On a YoY basis, the size of the Saudi Arabia drop is double the US increase.
Non-OPEC Oil Production Charts
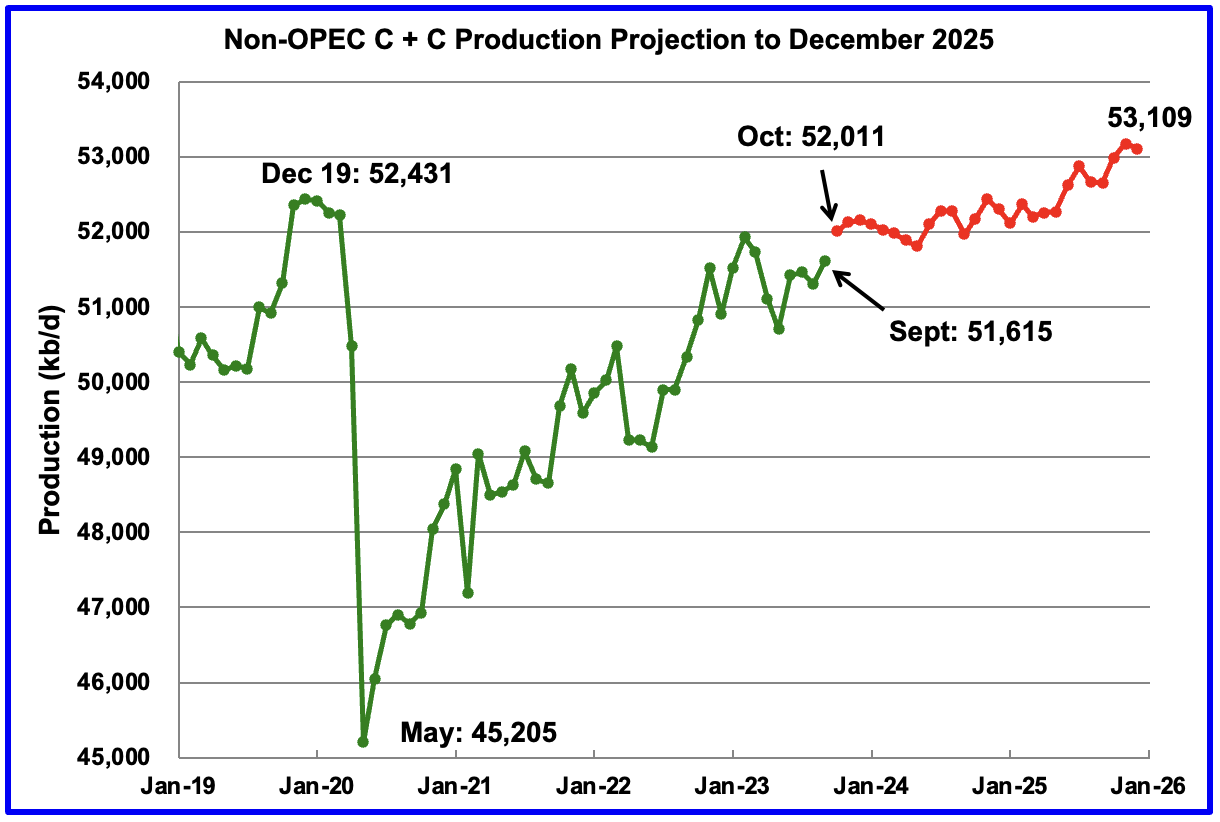
September Non-OPEC oil production rose by 303 kb/d to 51,615 kb/d. The largest increase came from the US.
Using data from the December 2023 STEO, a projection for Non-OPEC oil output was made for the period October 2023 to December 2025. (Red graph). Output is expected to reach 53,109 kb/d in December 2025, which is 678 kb/d higher than the December 2019 peak of 52,431 kb/d.
From October 2023 to December 2025, oil production in Non-OPEC countries is expected to increase by 1,098 kb/d. According to the STEO, the major contributors to the increase are expected to be the US and Canada.
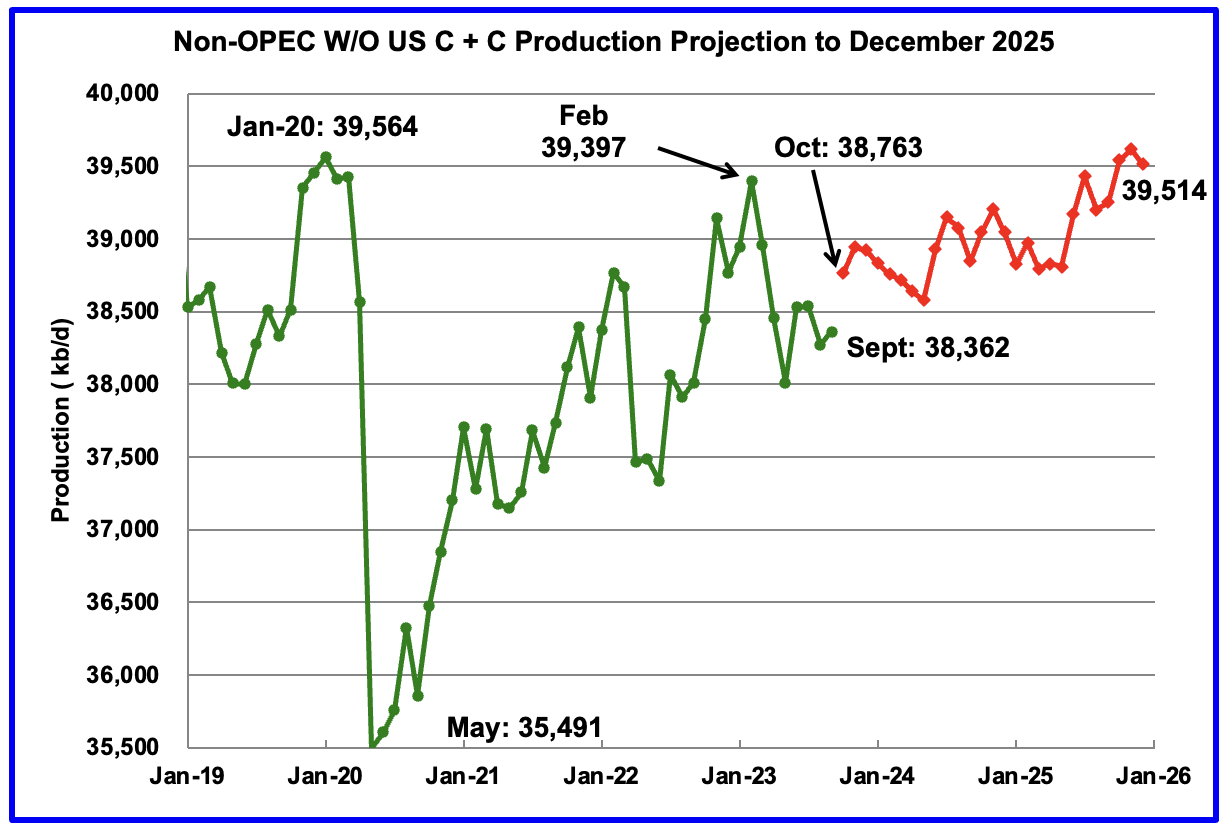
September Non-OPEC W/O US production increased by 91 kb/d to 38,362 kb/d. October production is projected to increase by 401 kb/d.
From October 2023 to December 2025, production in Non-OPEC countries W/O the US is expected to increase by 751 kb/d.
Note that the December 2025 output is lower than the January 2020 high of 39,564 kb/d by 50 kb/d.
Non-OPEC Oil Production Ranked by Country
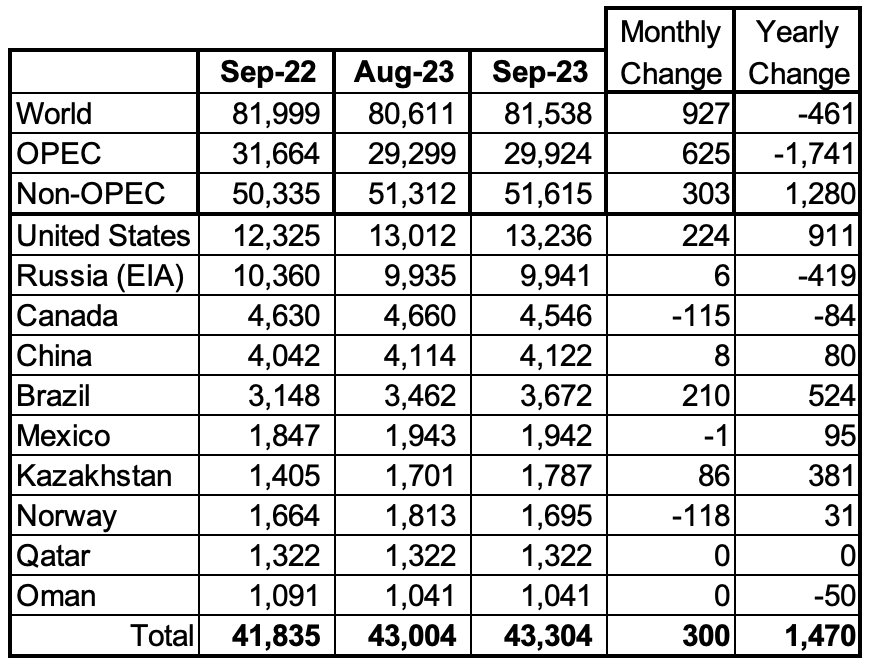
Listed above are the World’s 10 largest Non-OPEC producers. The criteria for inclusion in the table is that all of the countries produce more than 1,000 kb/d.
September’s production increase for these ten Non-OPEC countries was 300 kb/d while as a whole, these Non-OPEC countries saw a production increase of 303 kb/d.
In September 2023, these 10 countries produced 83.9% of all Non-OPEC oil production.
OPEC’s C + C production increased by 625 kb/d MoM, while YoY, it decreased by 1,741 kb/d. World MoM production increased by 927 kb/d, while YoY output decreased by 461 kb/d.
Non-OPEC Oil Production Charts
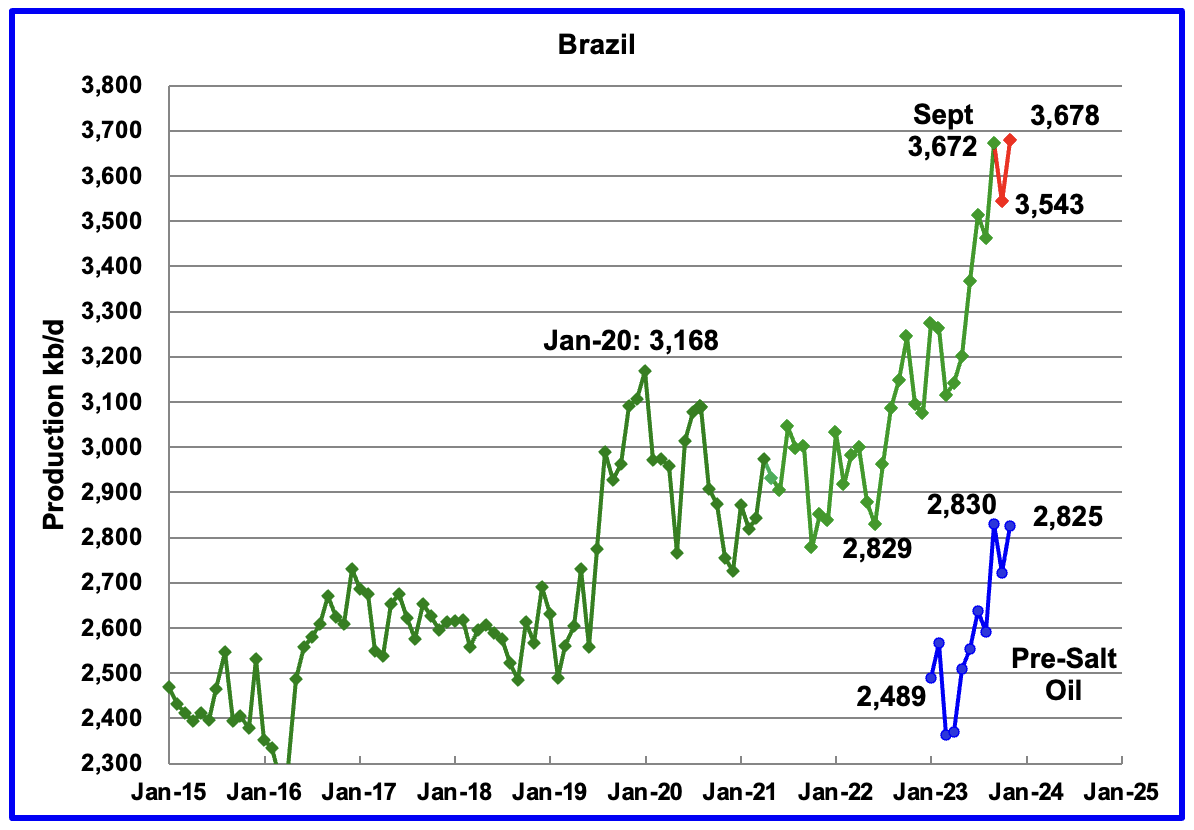
The EIA reported that Brazil’s production increased by 210 kb/d in September to 3,672 kb/d.
Brazil’s National Petroleum Association (BNPA) reported that output in October decreased by 129 kb/d to 3,543 kb/d followed by a 135 kb/d rebound in November to 3,678 kb/d.
From March 2023 to November 2023, production increased by 563 kb/d. A similar rise in production is not expected in 2024. For 2024, the MOMR is expecting a smaller increase, closer to 100 kb/d.
For 2024, the January MOMR states: “Crude oil output is expected to increase through production ramp-ups in the Buzios (Franco), Mero (Libra NW), Tupi (Lula), Peregrino and Itapu (Florim) fields. Oil project start-ups are expected at the Atlanta, Pampo-Enchova Cluster, and Vida sites. However, increasing costs in the offshore market and inflation might also continue to delay projects and could temper growth in the short term.” However, for 2025, an increase of close to 200 kb/d is expected.
Production from the off-shore “pre-salt” region has been added to the Brazil chart, blue markers. November oil production increased by 103 kb/d to 2,825 kb/d, which accounts for most of the 135 kb/d overall increase in Brazil’s November output. Much of Brazil’s 2023 production growth came from the highly productive pre-salt fields. From March 2023 to November 2023, production from the pre-salt fields increased by 462 kb/d.
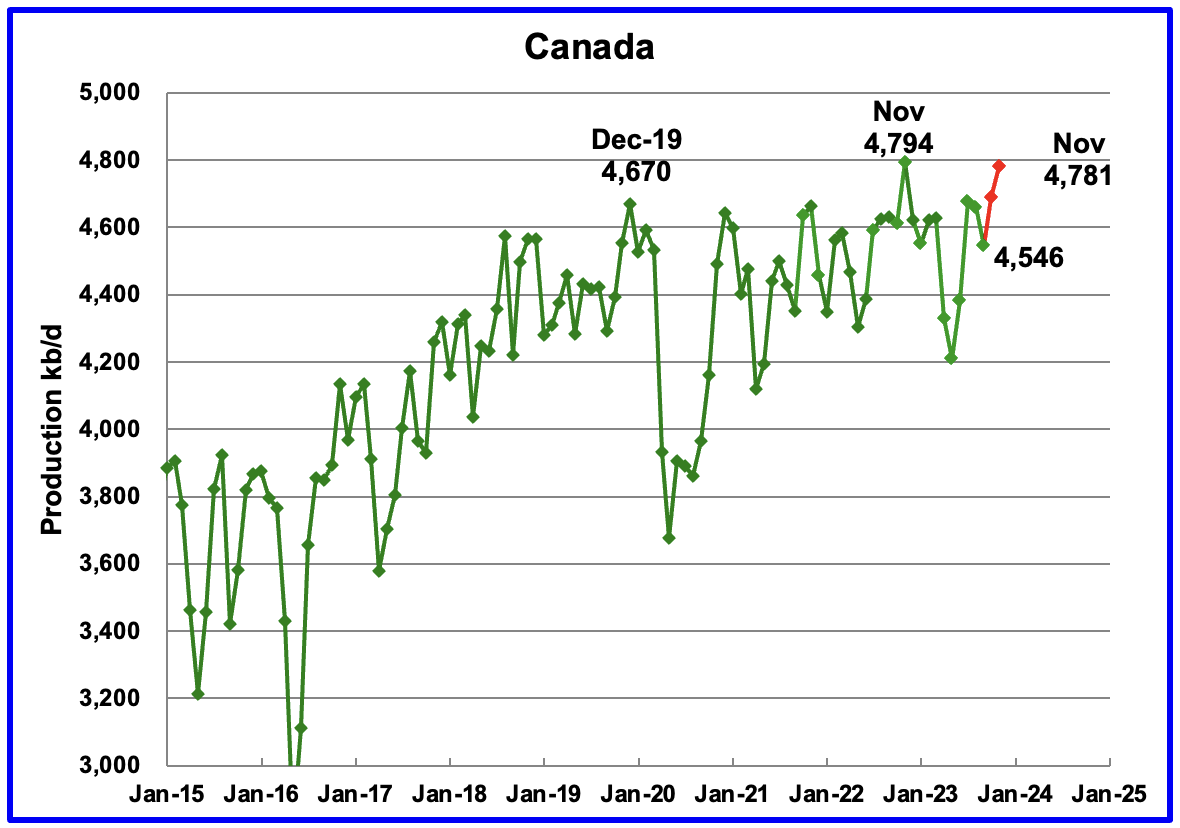
According to the EIA, Canada’s production decreased by 115 kb/d in September to 4,546 kb/d. The September drop was due to fires in Alberta during the 2023 summer.
The STEO is forecasting that Canadian production will rise by 142 kb/d in October, along with an additional 93k/d increase in November, red markers.
According to this source, Alberta’s oil production rose to a record in November that tops China’s production.
“Production is surging as oil-sands companies prepare for an expansion of the Trans Mountain pipeline – which runs from the province to Canada’s Pacific Coast – to start up this year, giving them 590,000 barrels of new export capacity.
Alberta’s oil-sands deposits represent the world’s third-largest crude reserve, and November’s production is more than all but four countries, edging out China’s average output in 2022 while trailing Iraq’s, according to data from BP p.l.c. (BP, OTCPK:BPAQF). Including output from Canada’s other provinces makes the country the world’s fourth-largest producer.”
In January 2024, the Canada Energy Regulator approved another variance request by the Trans Mountain Pipeline (TMX). Line fill of the TMX pipeline could start in March/April.
“Trans Mountain Corp is racing against the clock to complete the expansion project, which will boost the capacity of Canada’s only oil pipeline to the West Coast to 890,000 barrels per day from 300,000 bpd currently.”
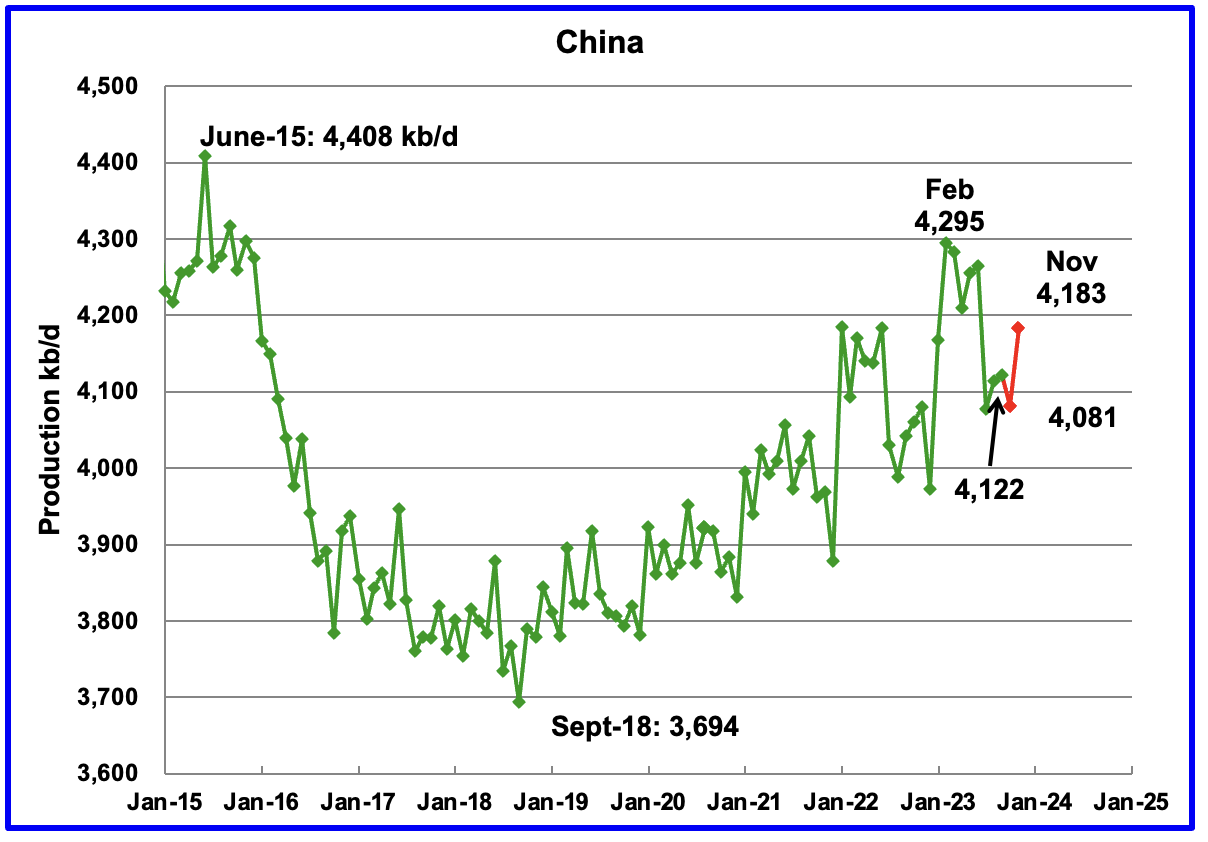
The EIA reported China’s oil output in September rose by 8 kb/d to 4,122 kb/d.
The China National Bureau of Statistics reported that output dropped in October to 4,081 kb/d and then rebounded in November by 102 kb/d to 4,183 kb/d.
Every January for the last four years, China’s production has taken a massive increase. In 2022, production jumped by 322 kb/d from December 2021 to February 2022. However, according to the January MOMR: For 2024, Chinese liquids production is expected to remain steady at the 2023 level of 4.6 m/d.
While China’s production growth has risen steadily since 2018, it may be approaching its post-pandemic high, as inferred by the January MOMR.
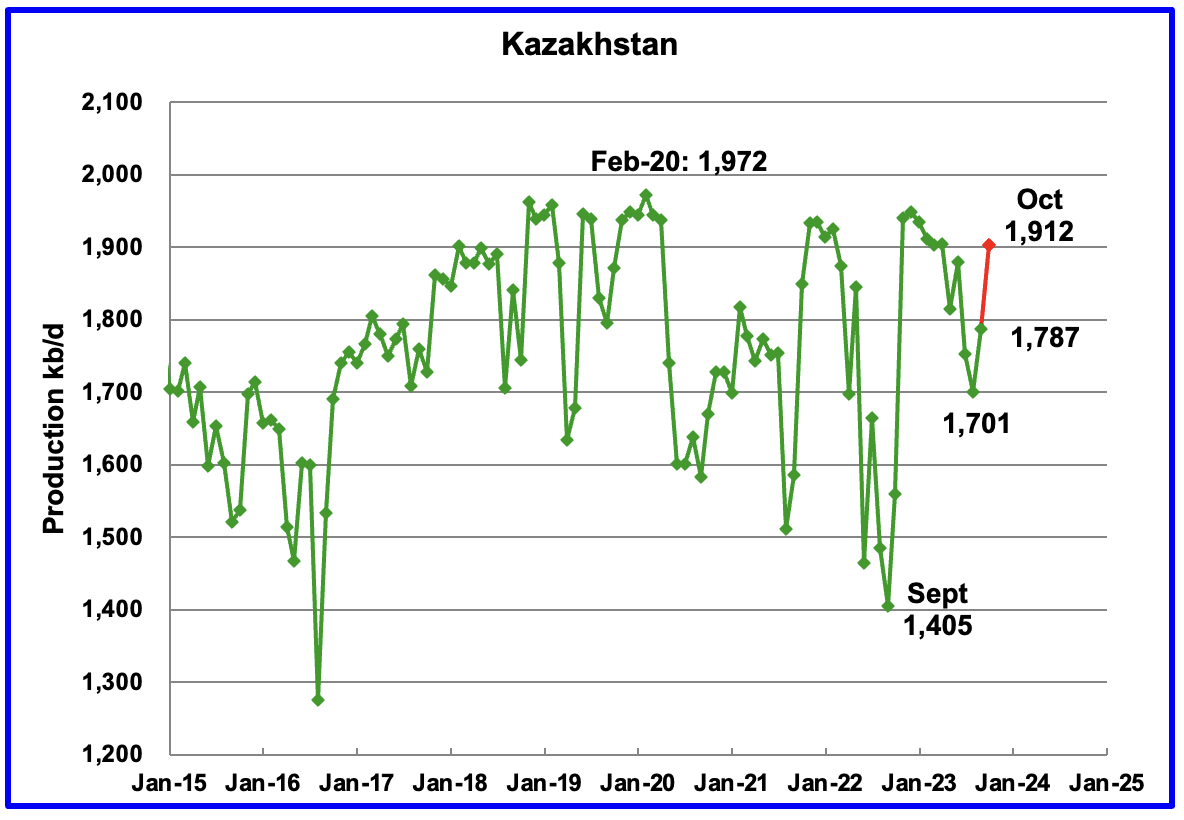
According to the EIA, Kazakhstan’s output increased by 86 kb/d in September to 1,787 kb/d.
The STEO is forecasting that production will continue to rise in October to 1,912 kb/d, red marker.
The January MOMR is reporting that “November Crude production dropped by 44 tb/d, m-o-m, to average 1.6 mb/d. NGL and condensate output rose by 17 tb/d, m-o-m, to average 0.4 mb/d.”
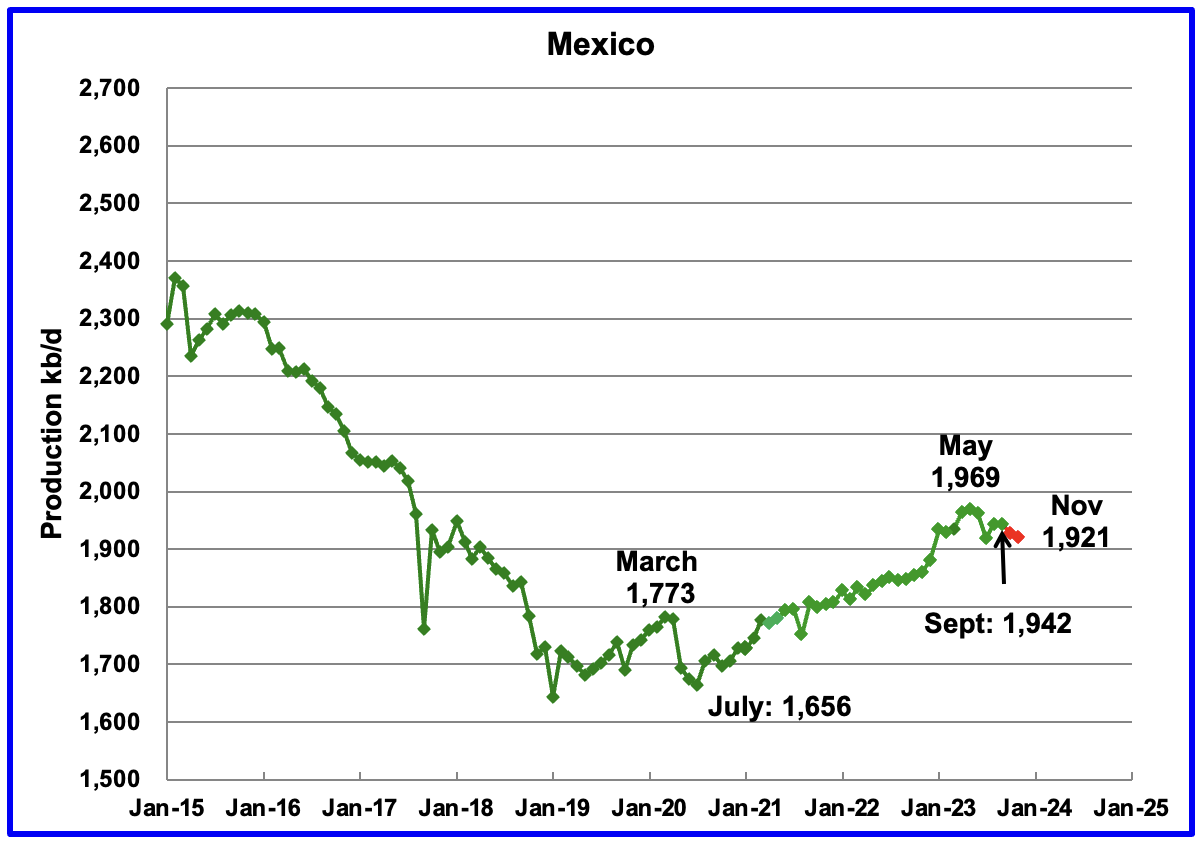
Mexico’s production in August and September was 1,943 kb/d, an increase of 24 kb/d from July’s 1,919 kb/d.
According to Pemex, Mexico’s oil production dropped in October and November to 1,921 kb/d.
Mexico has recently revised its definition of condensate. This has resulted in the EIA adding an extra 63 kb/d, on average, to the Pemex report. The red markers include the additional 63 kb/d.
According to the January MOMR for 2024: “Pemex’s total crude production decline in mature areas like Ku-Maloob-Zaap and Integral Yaxche-Xanab is forecast to outweigh production ramp-ups in Area-1 and El Golpe-Puerto Ceiba, and from a few start-ups, namely TM-01, Paki and AE-0150-Uchukil.
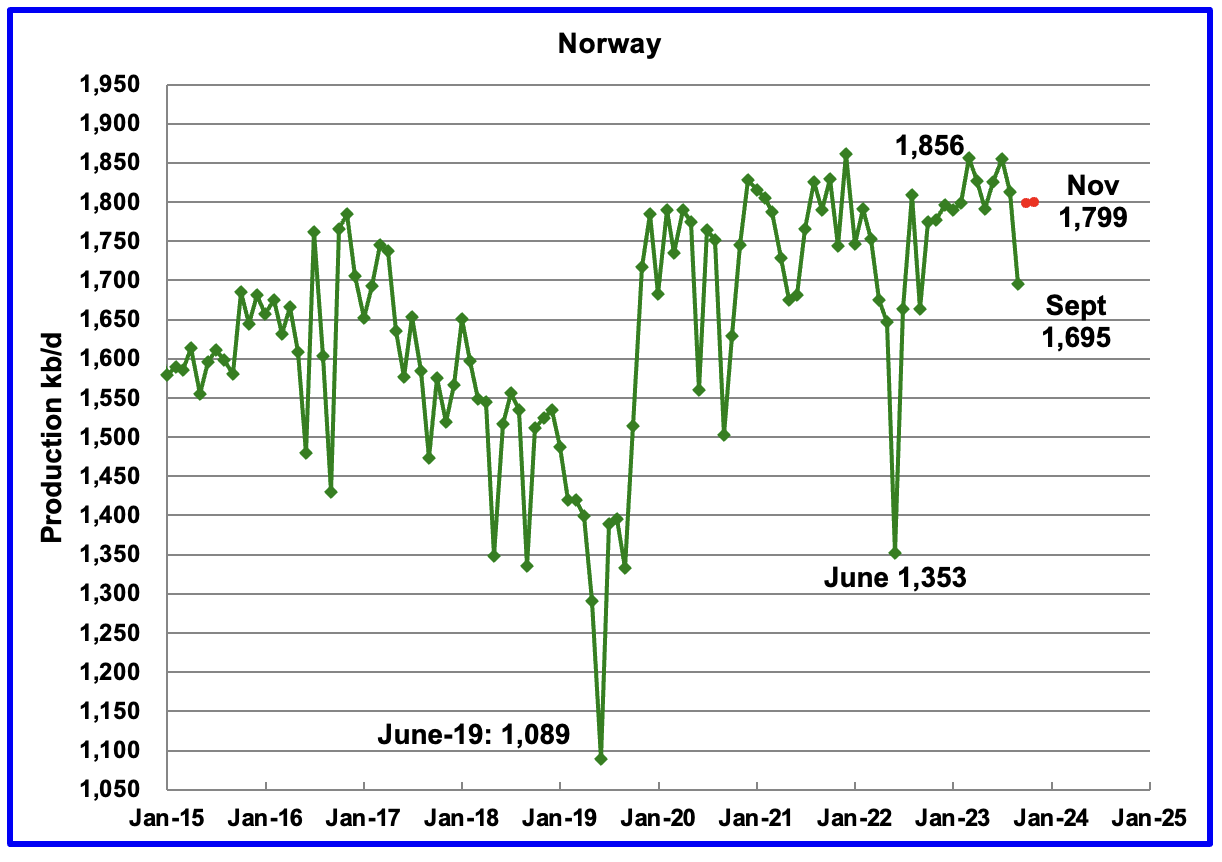
The EIA reported Norway’s September’s production dropped to 1,695 kb/d.
Separately, the Norway Petroleum Directorate (NPD) reported that October’s production increased to 1,798 kb/d and then added 1 kb/d in November 1,799 kb/d, red markers. The October rebound was due to repairs to the equipment failures experienced on a number of platforms in September.
According to the NPD: “Oil production in November was 3.1 percent lower than the NPD’s forecast and 0.9 percent lower than the forecast so far this year.”
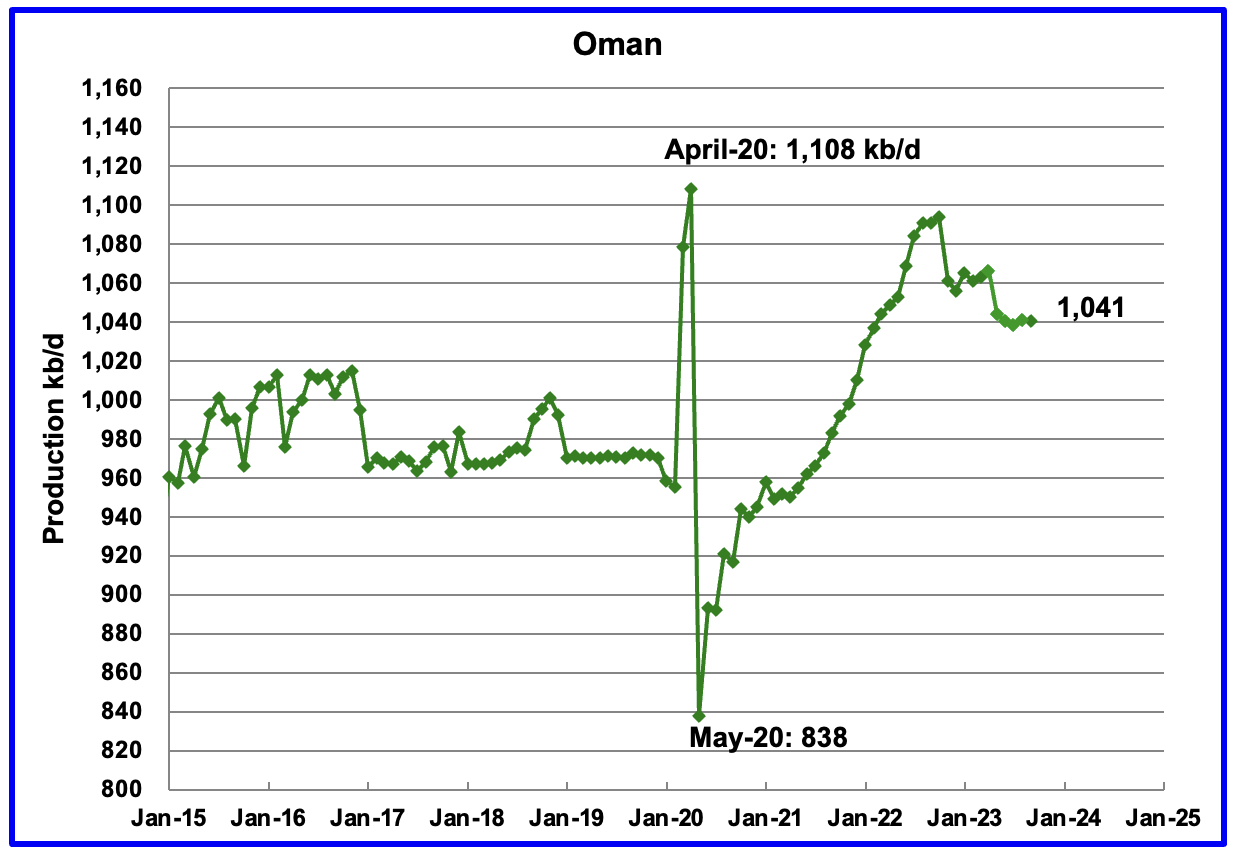
Oman’s production rose very consistently since the low of May 2020. However, production began to drop in November 2022. According to the EIA, September’s output was unchanged at 1,041 kb/d.
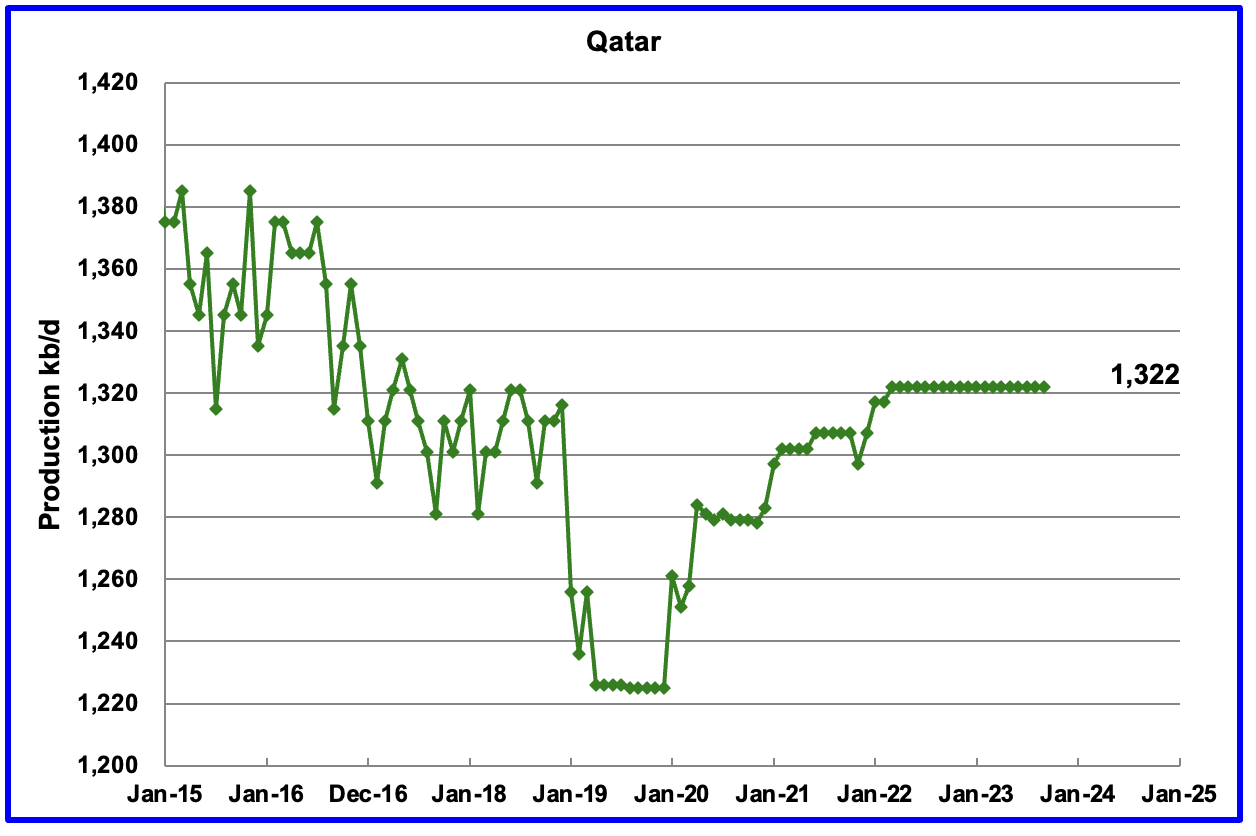
Qatar’s September output was unchanged at 1,322 kb/d, possibly due to a lack of updated information.
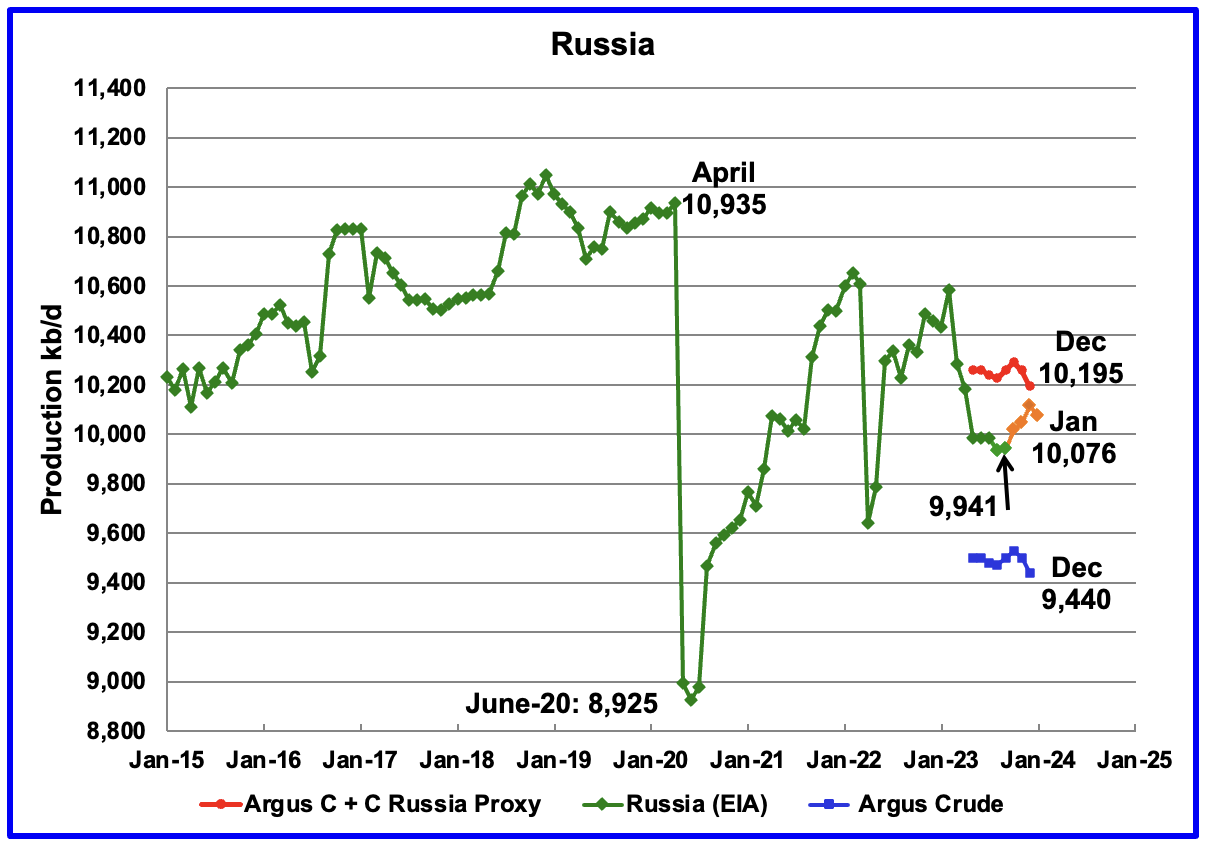
The EIA reported Russia’s September C + C production rose by 6 kb/d to 9,941 kb/d. Using data from the January STEO report, Russian output is expected to increase to 10,076 kb/d by January 2024, orange markers. If the projection is correct, this indicates that there is no sign that Western sanctions are affecting Russian oil production at this time.
According to this source, Russian Crude Flows Exceed OPEC+ Target. (A very long article).
“(Bloomberg) — Russia’s seaborne crude shipments shrugged off attacks on shipping in the southern Red Sea to register gains in the latest week, as Moscow failed to match export cuts that it pledged to its OPEC+ allies.
About 3.43 million barrels a day of crude were shipped from Russian ports in the four weeks to Jan. 14, tanker-tracking data monitored by Bloomberg show. That was up by 94,000 barrels a day from the period to Jan. 7.
The more volatile weekly average rose by 166,000 barrels a day to 3.45 million. While that was 134,000 barrels below the average export level seen by Bloomberg during the benchmark months of May and June, it was still less than half the cut Moscow pledged to its OPEC+ partners for the first quarter of 2024.”
Using data from Argus Media reports, Russian crude production is shown from May 2023 to December 2023. For December, Argus reported that Russian crude production was 9,440 kb/d, a decrease of 60 kb/d from November, blue markers. Adding 8% to Argus’ November crude production provides a C + C production estimate of 10,195 kb/d, which is a proxy for the Pre-War Russian Ministry estimate, red markers.
Comparing the Argus crude data with the latest STEO projection indicates that the EIA estimate for Russian C + C is between the Argus estimates for Crude and C + C. Prior to the war, the Russian Ministry estimate was always 404 kb/d higher than the EIA estimate for C + C. The current December Russia Proxy output is 119 kb/d higher than the EIA’s estimate.
The January IEA OMR reports that Russian crude production in December was 9,480 kb/d, very close to the Argus report. Note the trend difference between the EIA and Argus after October. Is this an indication EIA’s estimate for Russian C + C is too high?
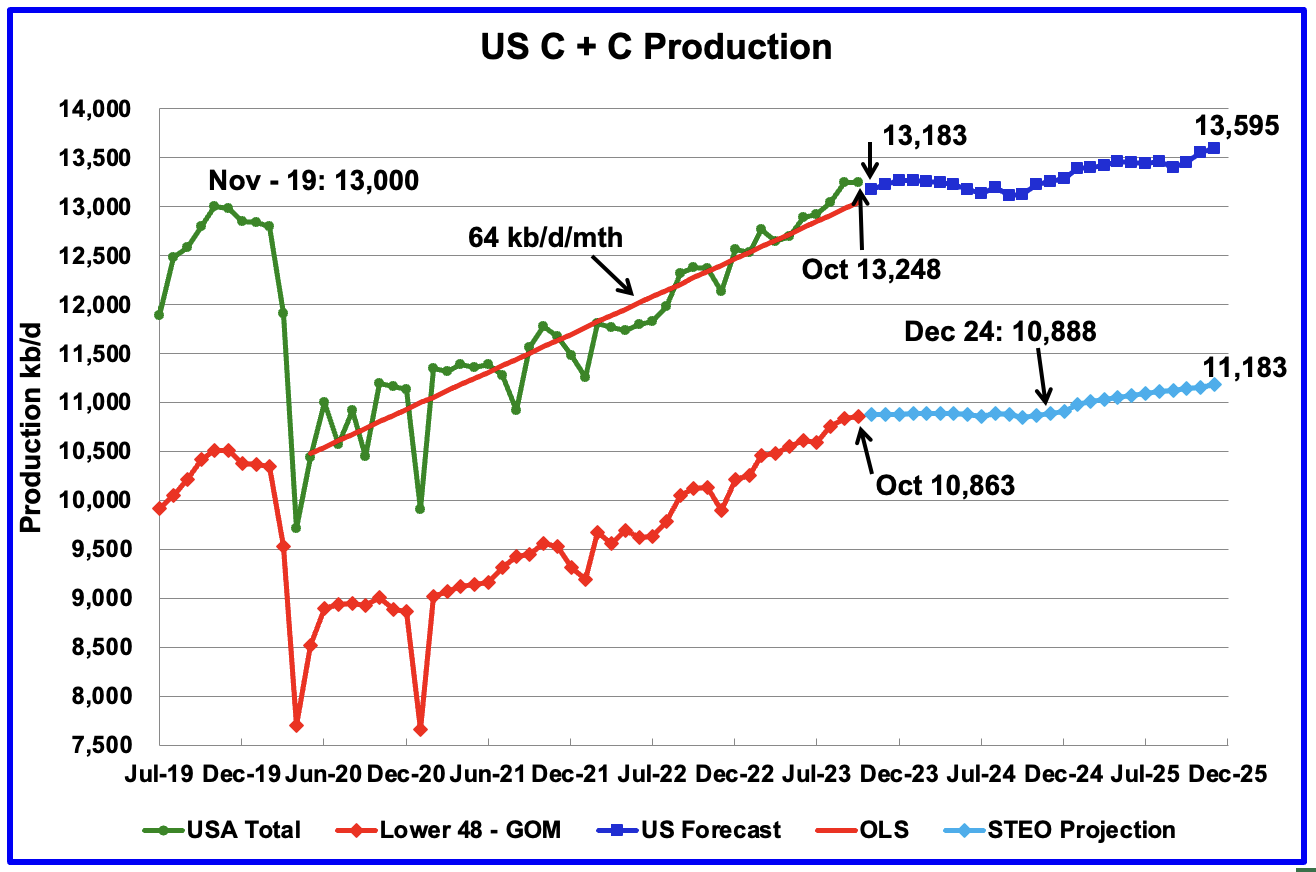
U.S. October oil production decreased by 4 kb/d to 13,248 kb/d. The decrease was primarily due to decreases in the GOM and North Dakota being partially offset by increases in Texas and New Mexico.
The dark blue graph, taken from the January 2023 STEO, is the forecast for U.S. oil production from November 2023 to December 2024. Output for December 2025 is expected to reach 13,595 kb/d.
The light blue graph is the STEO’s projection for output to December 2025 for the Onshore L48. For 2024, the STEO is showing essentially no growth in the L48 states. From October 2023 to December 2024, production growth is 25 kb/d. This is consistent with the DPR model, which has been showing a slow growth in production trend for the last few months. Not clear on the source of the 300 kb/d production increase for 2025.
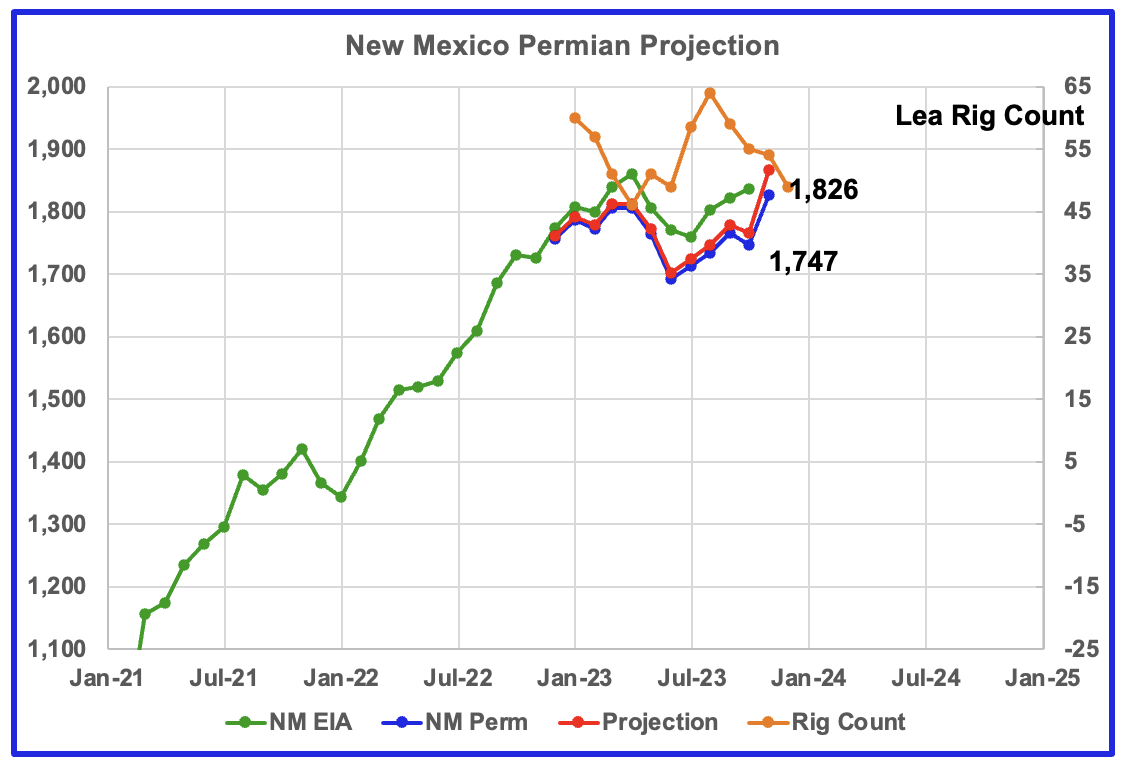
This chart reports on October oil production for New Mexico according to the EIA and November production from the New Mexico Oil Conservation Division (OCD). The blue graph is monthly data as published by the OCD and is the total oil production for the Lea and Eddy counties. The red graph is a projection for what the OCD could be reporting about a year from now for November 2023 production.
The raw data from the OCD is indicating an increase of 79 kb/d (Lea 59 kb/d, Eddy 20 kb/d) from October to November, which translates to 101 kb/d in the projection.
Such a large increase in production was an unexpected surprise. The Lea County rig count has been added to the chart, and it provides a possible clue to the surprise increase. Note that the rig count began to rise in June 2023. Allowing for an average delay time of four to six months to bring wells online, the November increase may be the first batch of those wells starting production. If correct, production increases in New Mexico could continue for a few more months.
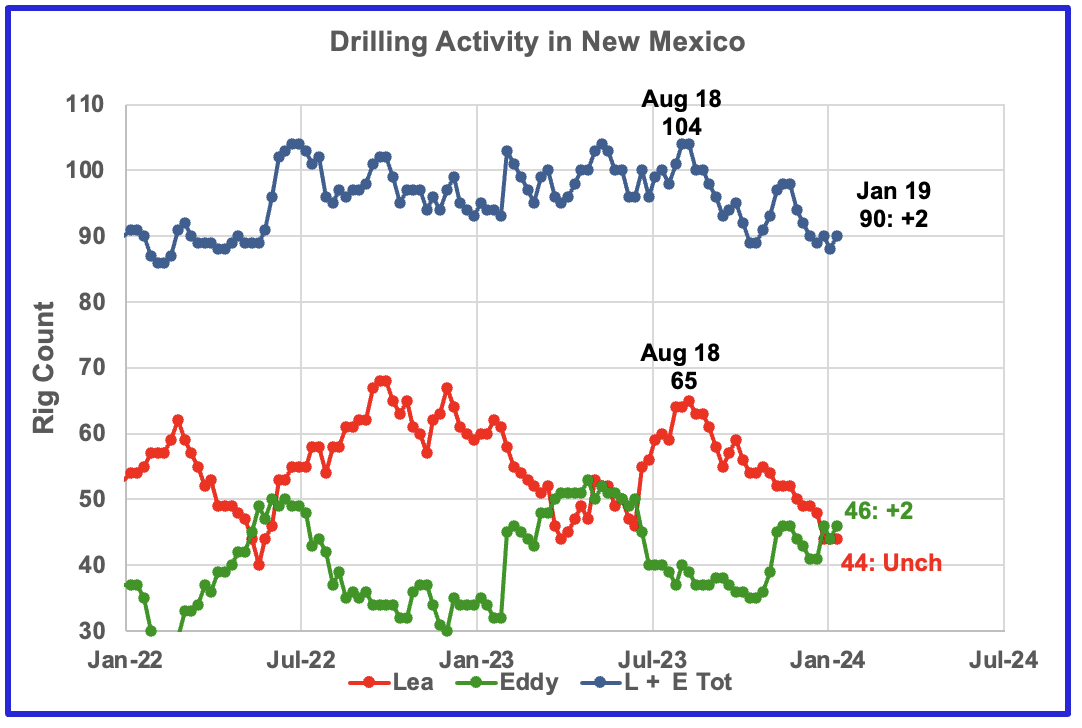
This rig count chart has been added to show the rig count for the New Mexico Permian. While the rig count for Lea County started to increase in June, the opposite occurred with Eddy. However, even though the rig count began to drop in Eddy County in June, production rose by 20 kb/d in November.
For the week ending January 19, Eddy added 2 rigs to 46, while Lea was unchanged at 44. Lea’s rig count is down 19 rigs from the 65 operating in the week ending August 18.
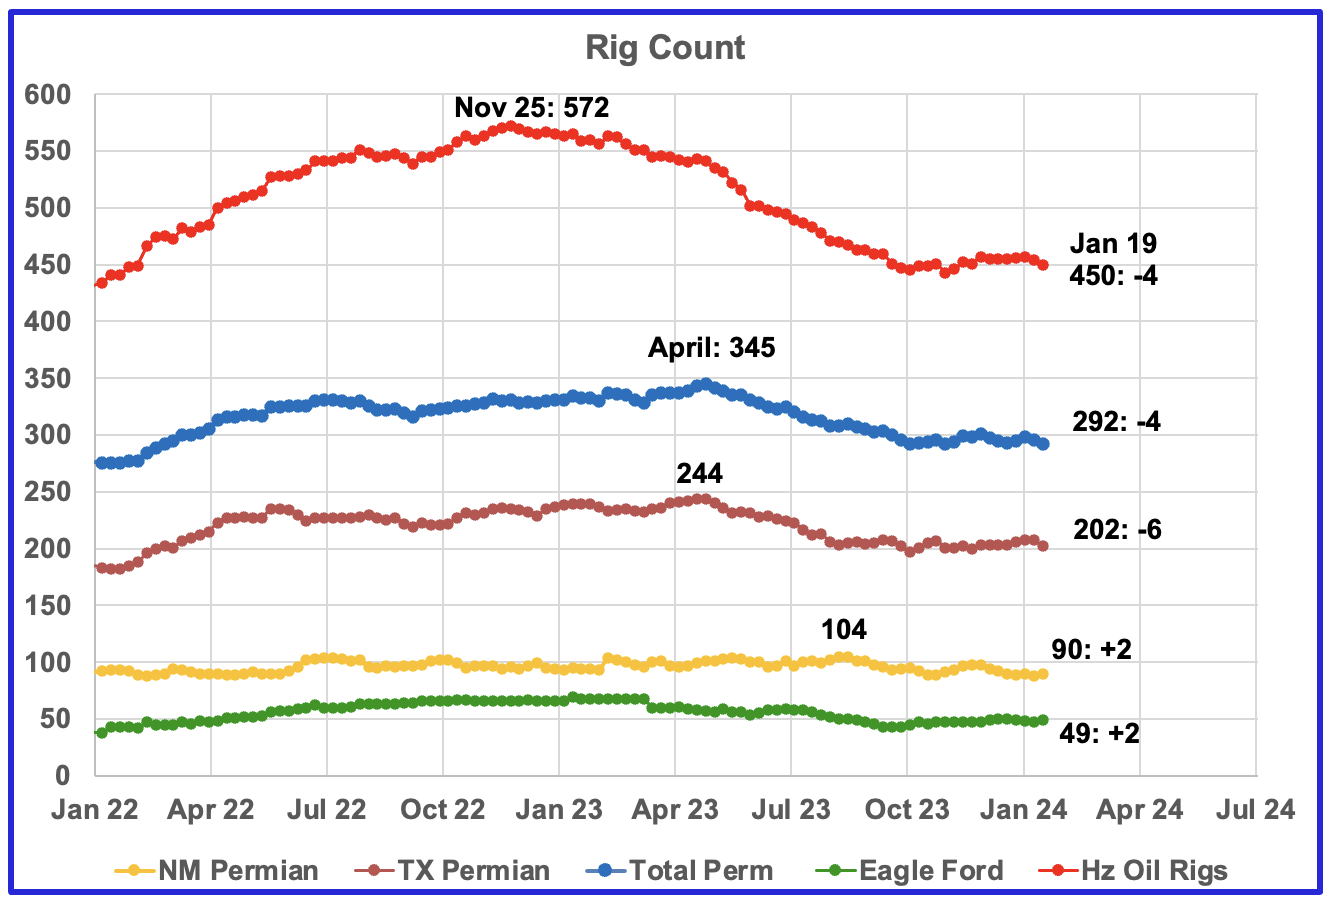
Rig report for the week ending January 19
– US Hz oil rigs decreased by 4 to 450, the lowest count over the past ten weeks and down 118 since November 25, 2022. The rig count has been close to 450 since the beginning of October.
– Permian rigs were down 4 to 292. Texas Permian was down 6 at 202, while NM was up 2 to 90. In New Mexico, Lea County was unchanged at 44 while Eddy added 2 to 46.
– Eagle Ford added 2 to 49.
– NG Hz rigs added 3 to 109 (not shown)
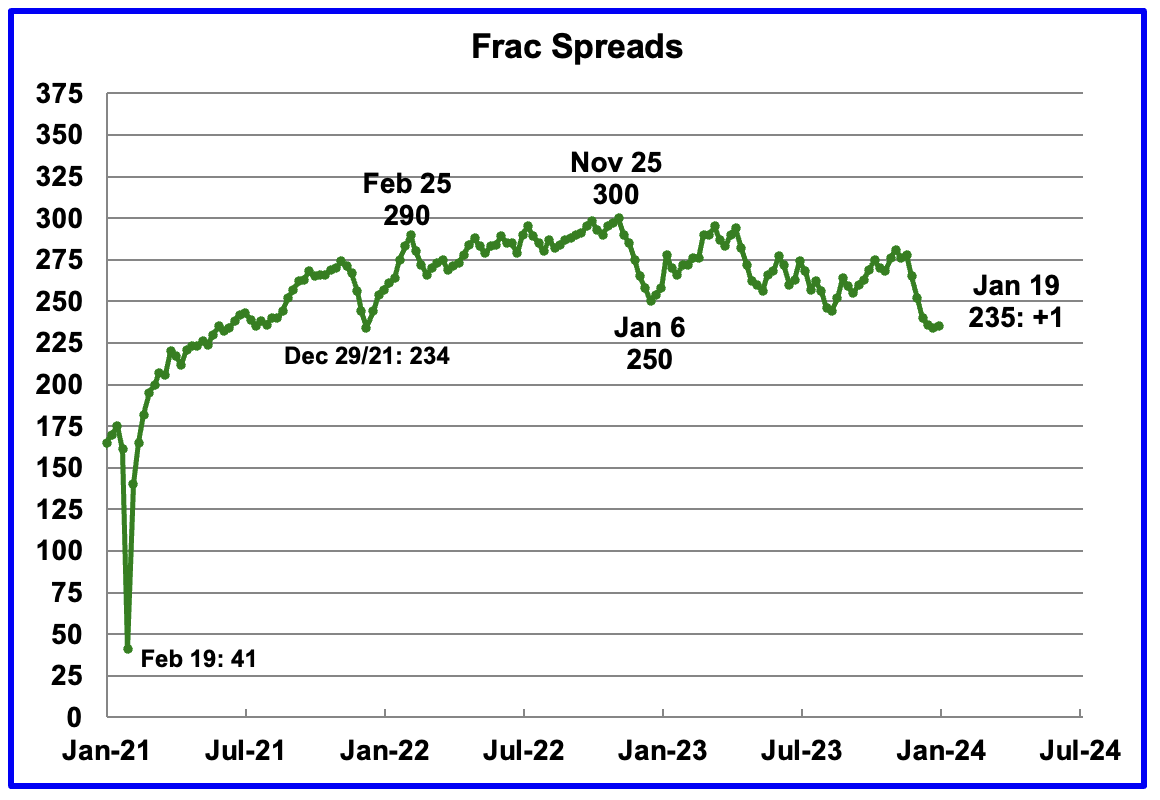
Frac Spread Count for the Week ending January 19
The frac spread count was up 1 to 235, up 1 from the previous low of 234 on December 29, 2021.
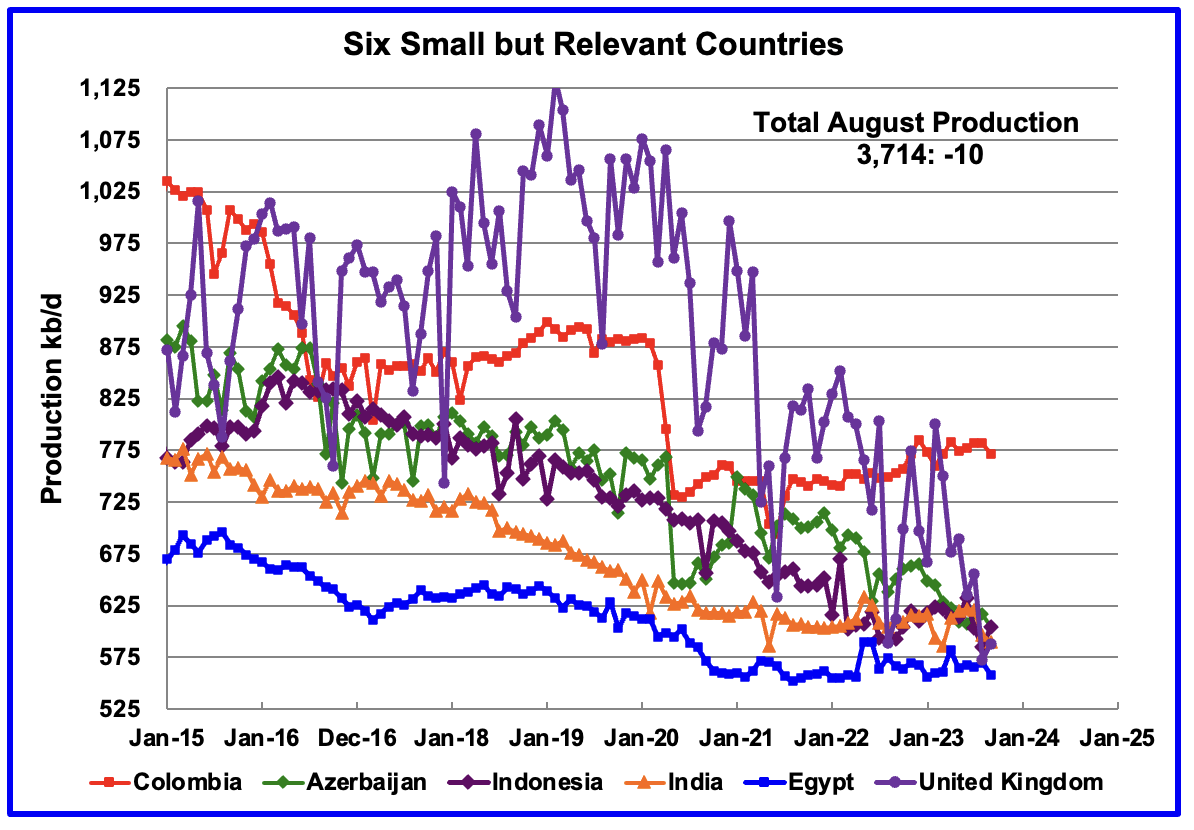
These six countries complete the list of Non-OPEC countries with annual production between 500 kb/d and 1,000 kb/d. Note that the UK has been added to this list since its production has been below 1,000 kb/d since 2020 and fell to a new low of 573 kb/d in August. September added 15 kb/d.
Their combined September production was 3,714 kb/d, down 10 kb/d from August.
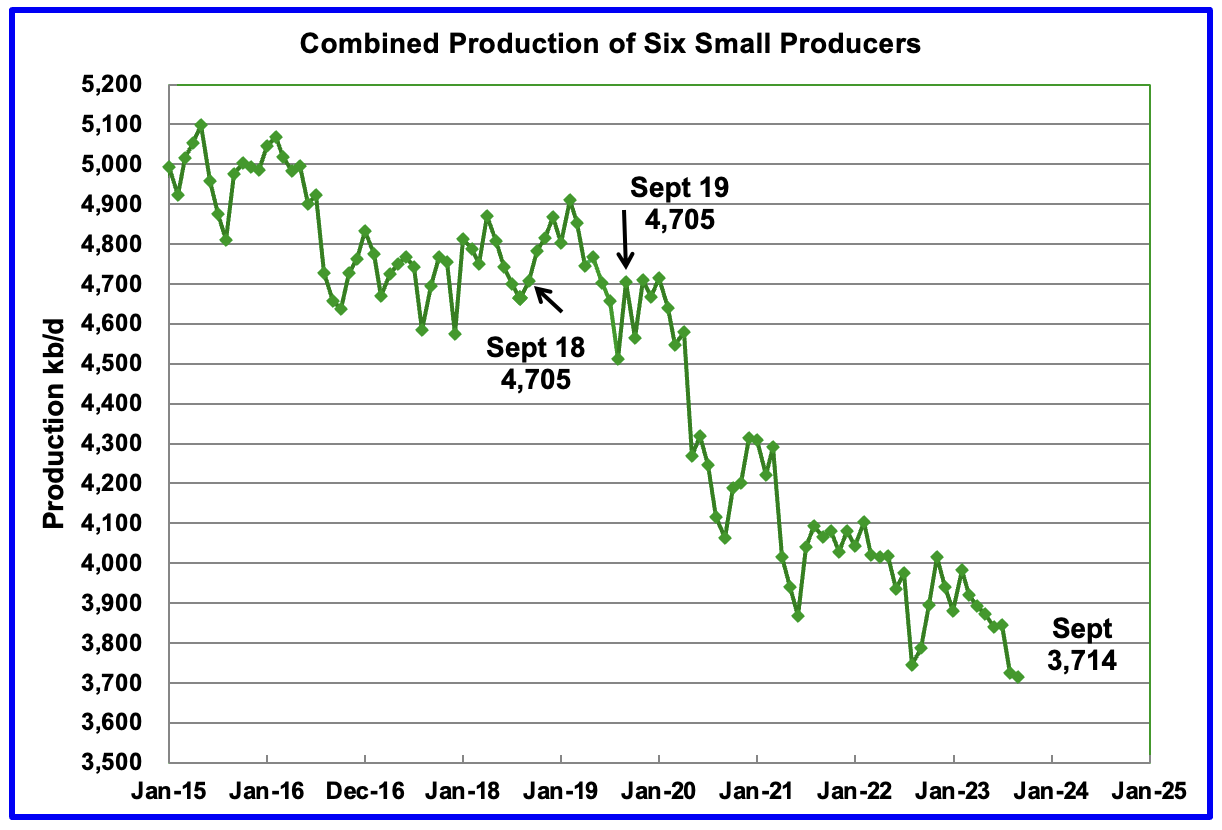
The overall output from the above six countries has been in a slow, steady decline since 2014 and appears to have accelerated after 2019.
The decline from September 2018 or September 2019 to September 2023 is essentially 1,000 kb/d. This means that the combined average decline rate for these six countries is somewhere between 200 kb/yr and 250 kb/yr.
Editor’s Note: The summary bullets for this article were chosen by Seeking Alpha editors.

 Q2 2024 Earnings Call Transcript")

