Wachiwit/iStock via Getty Images
Investment Thesis
Sealed Air Corp (NYSE:SEE) is a global provider of packaging solutions. Over the past 6 years, revenue only grew at 3.1 % CAGR. This was despite having both organic and acquisition growths. At the same time, the global packaging sector is also not a high-growth one.
Despite being a low-growth company, SEE was able to deliver double-digit operating returns. It also led its peers when it came to ROA. It may not be a wonderful company when looking at how it performed under its 2018 Reinvent SEE strategy. But this was looking at improvements from a high starting bar.
The market price has declined since Q1 2022. But I think it had overshot on the way down as there is currently more than a 30% margin of safety. It is an investment opportunity.
Business background
The company was founded in 1960 with the BUBBLE WRAP® brand as the company’s signature brand. The company has since grown such that by the end of 2022, it had 97 manufacturing facilities serving 120 countries/territories.
The company described itself as a leading global provider of packaging solutions. SEE designs and delivers packaging solutions that preserve food, protect goods, automate packaging processes, and enable e-commerce and digital connectivity for packaged goods.
The company today has 2 reportable segments:
- Food. Food solutions are utilized by food processors, food service businesses (such as restaurants), and food retailers (such as supermarkets). These are largely sold directly to customers by SEE’s sales, marketing, and customer service personnel throughout the world.
- Protective. Protective packaging solutions are utilized across many global markets to protect goods during transit. These are sold through a strategic network of distributors as well as directly to end customers.
Note that the current reporting segment started in 2018 after the sale of its Diversey, Food Hygiene, and Cleaning businesses.
The Food segment is the biggest revenue contributor accounting for an average of about 59% of the company revenue from 2018 to 2022. In terms of geographic regions, the Americas was the biggest revenue contributor accounting for about 2/3 of the 2022 revenue. Refer to Chart 1.
Chart 1: Segment Revenue (Author)
Notes to Chart 1:
Americas = North America and South America.
EMEA = Europe, Middle East and Africa.
APCA = Asia, Australia and New Zealand.
Thrust of my analysis
In 2018, the company introduced the Reinvent SEE strategy that “…focuses on 4 key initiatives:
- Speed to Market on Innovations. This is expected to accelerate Sealed Air’s innovation rate over the next five years.
- SG&A Productivity. Simplify structure to create a more nimble and efficient organization.
- Product Cost Efficiency. Expand SEE Operational Excellence…Drive continuous improvement…across… areas such as procurement, conversion cost productivity, materials yield, and network efficiency.
- Channel Optimization and Customer Service Enhancements…to drive market share in existing and adjacent markets.”
I will assess how well the company has delivered on these strategic initiatives, specifically the second and third bullet points above.
Accordingly, I will look at the trends of the various operating and capital efficiency metrics from 2018 to 2023.
Operating trends
I looked at 2 groups of metrics to get a picture of the operating trends.
- The left part of Chart 2 shows the trends for 3 metrics – revenue, PAT, and gross profitability (gross profits / total assets).
- The right part of Chart 2 shows the trends for 2 return measures – ROA and Operating return (NOPAT / total capital employed). I did not track the ROE as the company had negative equity in 2018 and 2019.
Chart 2: Performance Index and Returns (Author)
Notes to Chart 2:
a) Note to Performance Index chart. To plot the various metrics on one chart, I have converted the various metrics into indices. The respective index was created by dividing the various annual values by the respective 2018 values.
b) The 2023 values were based on the Sep 2023 LTM results.
While revenue only grew at 3.1 % CAGR from 2018 to 2023, PAT grew at a much higher rate of 10.1 % CAGR.
The main reason for this was the higher effective tax rate of 67 % in 2018 compared to the other years which averaged around 29%. If the 2018 tax rate was 29%, there would hardly be any PAT growth between 2018 and 2023.
The trends for the ROA and Operating return showed similar patterns as those for the PAT. Over this period, SEE achieved an average ROA of 6.2 % and an average Operating return of 14.5 %.
I would consider the returns as good. Comparing the Operating return of 14.5 % with its WACC of 8.3 % I would conclude that SEE created shareholders value.
But in the context of the 2018 Reinvent SEE strategy:
- If you ignore the 2018 performance due to the taxes, you will conclude the PAT and returns declined from 2019 to 2023. The PAT in 2023 was lower than that in 2022 due to lower gross profit margins, higher interest charges, and loss from an asset sale.
- The poor performance is supported by the declining gross profitability that went from 30% in 2018 to 23 % in 2023.
I also broke down the operating profits into its components. Refer to the left part of Chart 3. In this part of Chart 3, the gap between revenue and the total costs (fixed and variable) represents the operating profit.
While there was growth in the operating profits, there was no growth in the contribution margin. This meant that profit growth was due to revenue growth rather than productivity or operating efficiency improvements.
A DuPont Analysis showed that from 2019 to 2023 (to ignore the 2018 tax effect), operating margin and asset turnover declined. These are not signs of improving operating efficiencies.
Operating leverage (assets/total capital employed) also deteriorated especially in 2023. This was due to the debt taken to fund the 2023 acquisition.
However, from 2019 to 2023 there was also hardly any growth in the fixed costs implying that there were SGA productivity improvements.
I think the negatives overwhelmed the positives in the context of meeting the 2018 Reinvent See key initiatives.
Chart 3: Operating Profit and DuPont Analysis (Author)
Notes to Op Profit Profile of Chart 3:
I broke down the operating profits into fixed costs and variable costs.
- Fixed cost = SGA, Depreciation & Amortization and Others.
- Variable cost = Cost of Sales – Depreciation & Amortization.
- Contribution = Revenue – Variable Cost.
- Contribution margin = Contribution/Revenue.
Growth
SEE provided data to enable a breakdown of the growth into those due to
- Organic growth vs acquisitions.
- Volume growth vs price growth.
Based on the data from 2018 to 2022, I estimated that during this period, revenue grew by USD 909 million or 4.5 % CAGR. Note that the revenue growth was affected by forex losses as shown in Table 1.
- Acquisitions accounted for about 1/3 of the total growth.
- The balance came mostly from price growth.
- There was hardly any volume growth.
Table 1: Growth components (Author)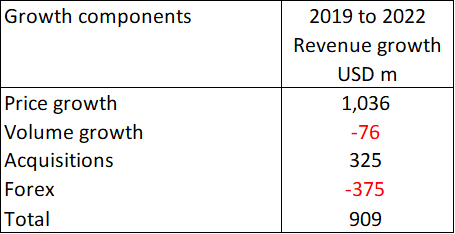
Given the above results, I would not classify SEE as a high-growth company despite its history of acquisitions. To be fair, this is not a high-growth sector as reported by several market research companies:
“The Packaging Market… growing at a CAGR of 3.89% during the forecast period (2024-2029)” Mordor Intelligence.
“The global packaging market… estimated annual growth rate during 2023–2028 is on average +4%.” Metsa Group.
If SEE revenue growth only matches those of the market, can you conclude that it gained market share? Consider this in the context of the Channel Optimization and Customer Service Enhancements part of the 2018 See Reinvent strategy.
Financial position
SEE had a mixed financial position. While it has some positive points, they were offset by the negative ones. The position points included the following:
- From 2018 to 2023, it generated positive cash flow from operations every year. In total, it generated USD 3.5 billion in cash flow from operations compared to the net income of USD 2.3 billion. This is a good cash conversion ratio.
- As of the end of Sep 2023, it had USD 281 million in cash. This was about 3.8 % of its total assets.
- Over the past 4 years, it achieved an average return on capital of 20 %. This is much higher than its WACC of 8 % implying that it was able to create shareholders’ value.
The negative points included the following:
- It has a 91 % debt-capital ratio as of the end of Sep 2023. This is high compared to the sector debt-capital ratio of 38% (based on the Damodaran Jan 2023 dataset).
- I worry about its capital allocation plan. It was able to cover its CAPEX and acquisitions with the cash flow from operation. However, it incurred debt to cover its dividends and share buybacks. Refer to Table 2.
Table 2: Sources and Uses of Funds 2018 to 2023. (Author)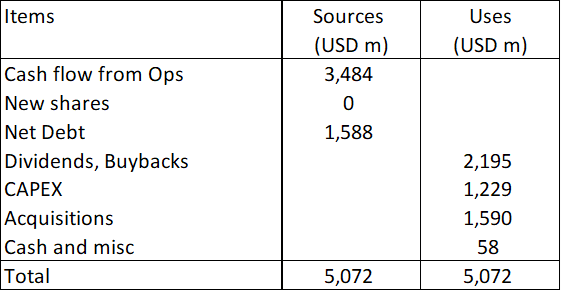
Q4 2023 results
The company is due to report its Q4 2023 results at the end of the month. In my analysis, I have used the Sep 2023 LTM performance to represent the 2023 performance.
Accordingly, the revenue for 2023 was projected to be USD 5.5 billion. This meant a reduction in revenue of about 2% compared to that of 2023.
Note that my projection is within the USD 5.4 billion to USD 5.6 billion range projected by the company in its Q3 2023 Earnings and 2023 Outlook presentation.
Technically there was a bigger reduction in revenue as there was a decline in “organic growth” that was offset by the growth from the acquisition of Liquibiox.
If nothing else, it supports my contention that SEE is not a high growth company despite its history of acquisitions. But more importantly, I don’t see the Q4 results affecting my analysis and valuation of SEE.
Valuation
I estimated the intrinsic value of SEE to be USD 69 per share compared to its market price (13 Feb 2024) of USD 36 per share. As such there is more than a 30% margin of safety.
Given its low revenue growth history, I valued SEE based on a single-stage growth Free Cash Flow the Firm (FCFF) model.
My financial model was based on the operating profit model illustrated in the left part of Chart 3.
Operating profit = Revenue X Contribution margin – Fixed costs
Free cash flow to the firm = NOPAT X (1 – Reinvestment rate)
The Reinvestment rate was determined from the fundamental growth equation where growth = Return X Reinvestment rate.
Return = after-tax operating profit / Total capital employed.
The total capital employed was derived based on capital turnover.
Value of equity = Value of firm + cash – Debt – Minority interests
Table 3 illustrates the calculation for SEE.
Table 3: Valuation of SEE (Author)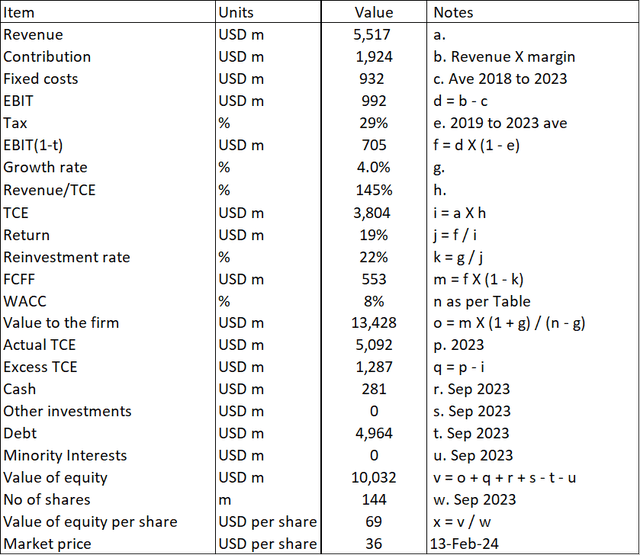
The WACC was derived as per Table 4 from a Google search for the phrase “Sealed Air Corporation WACC”.
Table 4: Estimating the WACC (Various)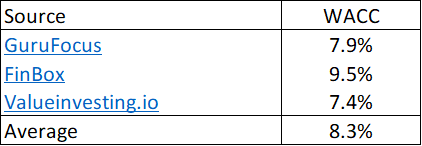
Risks and limitations
It would help if you considered the following when looking at my valuation
- Peer comparison.
- Valuation model.
While I have shown that SEE did not deliver many of its 2018 Reinvent SEE initiatives, you must not look at its performance in isolation. Over the past couple of months, I have covered several US packaging companies.
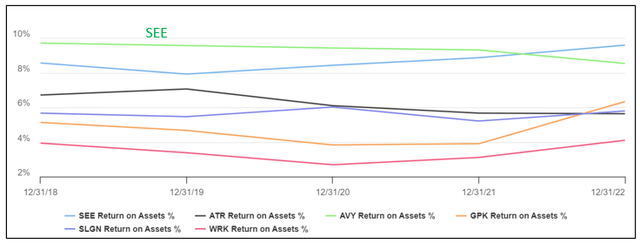
When I compared SEE’s return on assets with these companies as shown in Chart 4, SEE did very well. It was the top performer most of the time. Even when its returns declined in 2022, it was the second-best performer.
SEE was trying to improve its performance when it embarked on the 2018 Reinvent SEE strategy.
- So do not be mesmerized by my focus on the company’s performance relative to its 2018 Reinvent SEE strategy.
- If the company had met the strategic initiatives, I would have valued SEE using a 2-stage growth model. This would have resulted in a higher intrinsic value.
Notes to Chart 4.
- ATR = Aptar
- AVY = Avery Dennison
- GPK = Graphic Packaging
- SLGN = Silgan
- WRK = WestRock
I chose the single-stage growth model due to its historical low growth rate. When I reverse-engineered the market price, I found that it was equal to the Earnings Power Value. In other words, the market is pricing SEE as if there would not be any future acquisitions. Looking at the history of the company, this is not a true picture.
Secondly, I have taken a conservative approach in my valuation model by assuming the contribution margins and capital turnover based on the 2018 to 2023 average values. Even then there is a more than 30% margin of safety.
Conclusion
There is no clear-cut evidence that the company delivered all 4 key initiatives of the 2018 Reinvent SEE strategy. While it achieved the SG&A Productivity initiative, there were more negatives than positives:
- It failed on the Product Cost Efficiency initiative. There were no improving trends for contribution margin, gross profitability, or asset turnover. Consequently, returns declined.
- I don’t think it achieved its Channel Optimization and Customer Service Enhancements initiative in the context of increasing its market share.
Although I focused on the 2018 Reinvent See strategy, you should remember that it was in the context of starting from a high bar. SEE was trying to improve on a performance that was already better than its peers.
Having said that, I still would not consider it a wonderful company in the Warren Buffett sense. But it is a profitable one with returns greater than its cost of funds.
The market price has declined since the first quarter of 2022. I suspect that this was due to the poor 2023 performance. But I think the market has overshot on the way down so that today there is a margin of safety based on its Earnings Value. I would consider SEE an investment opportunity.
