contrastaddict
Those who know me well know that I am a huge fan of chess. I no longer play in over-the-board tournaments, but I do play online several times per week. One thing that I have come to realize is that you only get better by looking at the mistakes you have made along the way. And I believe that the same method of learning is imperative to make yourself a better investor. Over the past year or so, I have become stricter when it comes to the companies that I allow myself to be bullish about. Prior to that, there were some companies that I became overly optimistic about. And the end result of that has often been disappointment.
A great example of this can be seen by looking at the ‘buy’ rating that I assigned Saul Centers (NYSE:BFS) back in December of 2022. For those who don’t know, Saul Centers is a REIT that focuses on owning and leasing out shopping centers. Despite continued growth, shares of the company are not exactly cheap. In fact, relative to similar firms, I would argue that the stock is a bit pricey. But at the time, while even recognizing that it was not a value play, I believed that the company could offer some decent prospects to investors. Fast forward to today, and while the S&P 500 has jumped 19%, shares of this particular prospect have generated a return for investors of only 0.3%. Applying the more restrictive attitude that I have developed over the past year, I have now decided that it would be appropriate to downgrade the business to a ‘hold’.
When growth isn’t worth it
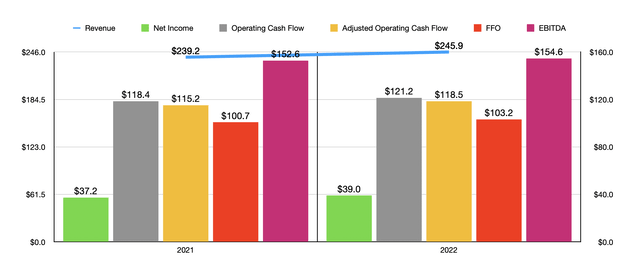
While I do have an appreciation for REITs in general, I am not much of a fan of any companies that are overly dedicated to the retail space. This is a highly competitive market and it is difficult to achieve attractive growth in it. But one firm that has managed to continue growing despite these troubles is Saul Centers. For instance, let’s look at the 2022 fiscal year. During that time, revenue came in at $245.9 million. That represents an increase of 2.8% over the $239.2 million generated one year earlier. With that increase in revenue came higher profits as well. As you can see in the chart below, net profits, operating cash flow, adjusted operating cash flow, FFO (funds from operations), and EBITDA have all increased year over year.
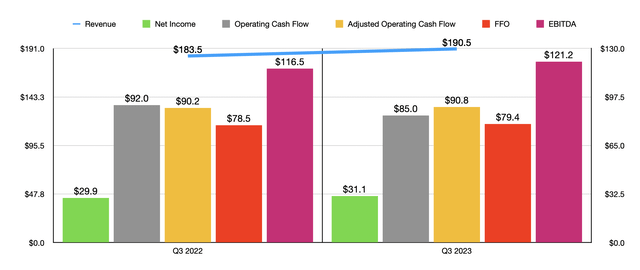
I could dedicate a good part of this article to talking about the 2022 data in depth. But given that we are now in early 2024, I think that our time would be best used focusing on more updated results. That would include the first three quarters of the 2023 fiscal year relative to the same time of the 2022 fiscal year. During the first nine months of 2023, revenue for Saul Centers came in at $190.5 million. That’s an increase of 3.8% over the $190.5 million generated for the first nine months of 2022. $5.7 million of the $7,000,000 year-over-year increase was attributable to a rise in base rent. This was driven by higher commercial base rent of $3.2 million and higher residential base rent of $2.5 million.
What makes analyzing the business for this window of time easy is that it made no acquisitions and no asset sales during this window of time. So all of the increase in revenue was driven by properties that the company owned during each window of time. This also means that the vast majority of the increase in sales was driven by an increase in how much the company is charging its tenants. However, it is worth noting that there are different types of properties under the firm’s umbrella. The largest chunk of revenue, for instance, comes from its shopping centers. From the first nine months of 2022 to the first nine months of 2023, revenue associated with these assets increased by 2.8% from $128.6 million to $132.2 million. The rest of its assets, meanwhile, consisted of mixed-use properties. These reported a 6.2% rise in revenue, but from a much smaller $54.9 million to $58.3 million. And while some of this rise was attributable to the office mixed-use properties, the vast majority of the increase can be chalked up to the residential ones.
Steady revenue growth for a REIT almost always translates into steady profit and cash flow growth as well. That is exactly the case that we see here. Net profits rose from $29.9 million to $31.1 million. It is true that operating cash flow pulled back from $92 million to $85 million. But on an adjusted basis, it expanded from $90.2 million to $90.8 million. FFO managed to grow from $78.5 million to $79.4 million. And lastly, EBITDA for the firm expanded from $116.5 million to $121.2 million.
Management has not provided any real guidance for the year. But if we assume that the final quarter of 2023 will end up looking like the first nine months did, then we should anticipate adjusted operating cash flow of around $119.3 million, FFO of around $104.4 million, and EBITDA of $160.8 million. Now before I move on, the first thing I need to mention is that there are some adjustments that should be made here. For both adjusted operating cash flow and FFO, investors would be wise to remove from those figures the distributions that the company made to non-controlling interests. And for adjusted operating cash flow on its own, it would be wise to remove the roughly $11.2 million in preferred distributions that the business makes each year.
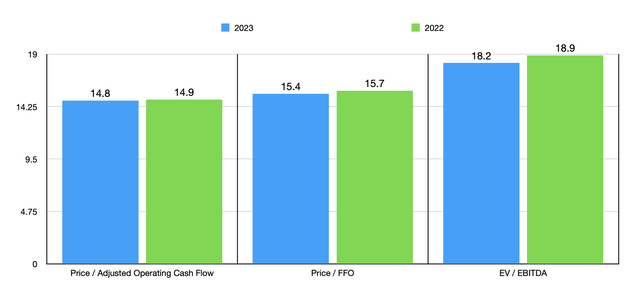
After making these adjustments, I was able to value the company as shown in the chart above. The stock is not cheap, but it’s not exactly pricey either. I then took two of the three metrics and compared the enterprise to five other firms that are similar to it. Those results can be seen in the table below. As you can see, in both cases, four of the five companies I compared it to ended up being cheaper than it. So even relative to comparable firms, units are a bit pricey.
| Company | Price/Operating Cash Flow | EV/EBITDA |
| Saul Centers | 14.8 | 18.2 |
| Alexander’s (ALX) | 12.4 | 9.2 |
| Getty Realty (GTY) | 14.0 | 15.1 |
| NETSTREIT (NTST) | 17.9 | 24.1 |
| InvenTrust Properties (IVT) | 13.7 | 16.5 |
| CBL & Associates Properties (CBL) | 4.1 | 6.1 |
While the stock might not be the cheapest, one thing that investors likely appreciate is the rather hefty yield. As of this writing, the yield stands at 6.03%. The good news is that this yield seems to be quite stable. Even though the company has a rather large amount of net debt, the rest of the enterprise is lean enough to comfortably cover distributions. Even if you take adjusted operating cash flow and strip out both non-controlling interest payments of $21.5 million and preferred distributions of $11.2 million, you still end up with common distributions requiring only 65.9% of what is left in order to remain unchanged.
| 2023 | 2022 | |
| Adjusted Op. Cash Flow | $119.3 | $118.5 |
| Less: Preferred Distributions | $11.2 | $11.2 |
| Less: Non-controlling Interests | $21.5 | $21.5 |
| Excess Cash Flow | $86.6 | $85.8 |
| Common Distributions | $57.1 | $55.5 |
| Common Distributions/Excess Cash Flow | 65.9% | 64.7% |
Takeaway
While I once was bullish on Saul Centers, I no longer feel that way. The company is a fine operator, but growth is only modest. Cash flows are attractive and are enough to cover distributions. However, they aren’t robust enough to make the company attractively priced, either on an absolute basis or relative to similar firms. Given these factors, I do believe that a more appropriate rating for this candidate is a ‘hold’ rating to reflect my belief now that the stock is unlikely to outperform the broader market for the foreseeable future.


