Andrii Yalanskyi/iStock via Getty Images
Thesis
We recently wrote a piece on the iShares Core S&P MidCap ETF (IJH), a large ETF representing a cornerstone of investing in the mid-cap space. Today we are going to follow-up on that theme with another name, more specifically the Invesco S&P MidCap 400 Revenue ETF (NYSEARCA:RWK).
RWK represents a take on IJH, more specifically it represents a targeted mid-cap exposure. Via its build, the exchange traded fund aims to track the performance of the S&P MidCap 400 Revenue-Weighted Index:
The S&P Revenue-Weighted Indices measure revenue-weighted performance of stocks across various segments of the U.S. equity market. Constituents’ weights are determined by dividing the constituent’s revenue by the total revenue of the index, with the majority of the indices subject to a single constituent weight cap of 5%
RWK therefore parses out IJH by its components, and subsequently allocates capital based on the underlying companies’ revenue, rather than market capitalization. The ETF is a passive one, following an index, thus its portfolio is going to be dependent on the index composition. As per Morningstar its portfolio turnover currently stands at 37%. This fundamental factor is an interesting one, since it utilizes an income statement metric to establish weighting in the ETF.
In this article we are going to take a closer look at RWK within the larger mid-cap theme, its composition and analytics, as well as its historic performance and standing in the current cycle. We like mid-caps at the current valuation levels, and RWK represents an excellent opportunity to get equity exposure in an otherwise stretched market.
Revenue figures as a composition factor
By utilizing revenue figures as a composition factor, the ETF ensures equities with large sales numbers are weighted higher, irrespective of the growth factor allocated to them by the market via capitalization. The results are striking versus IJH:
Holdings Compare (Author/Seeking Alpha)
IJH counts Super Micro Computer (SMCI) as its largest holding at 1.99%, while RWK has the same name only as its 8th largest exposure. As a reminder for readers, SMCI is a semiconductor name that has experienced an explosive growth in market capitalization this year, and is slated to become part of the S&P 500 index, thus leaving mid-cap indices altogether.
This difference is emblematic for the two names – the market is assigning SMCI a high growth factor within the overall AI theme, but the company does not have the largest revenue figure from its cohort. From this angle one can see how RWK tends to focus on more established companies. Its top component is Performance Food Group (PFGC), which sports a $53 billion trailing twelve months revenue figure.
The RWK methodology caps any name at 5% of the ETF, thus ensuring no single company ends up representing a large portion of the fund, irrespective of posted revenues.
Analytics are comparable
RWK sports a standard deviation of 20.2% and annualized volatility of 17.4%, versus a standard deviation of 19.6% and annualized volatility of 16.7% for IJH. From a risk standpoint the two names are therefore very similar. Where RWK excels though is via its performance:
3-Year Performance (Seeking Alpha)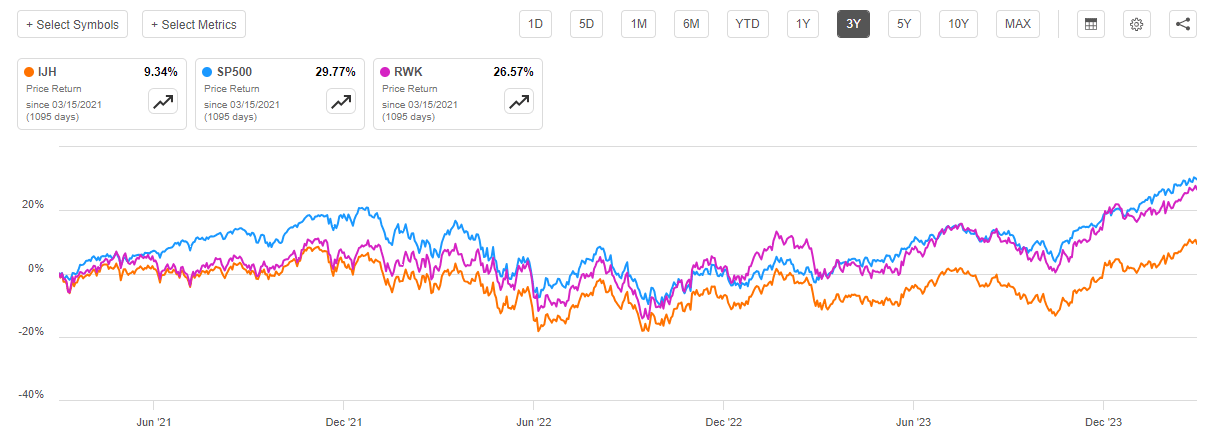
Since the Fed started raising rates, RWK has managed to significantly outperform IJH, and even more importantly, has almost matched the S&P 500 performance. These figures are surprising when considering RWK does not hold any of the large mega cap tech equities which are household names in the S&P 500.
The explanation for this outperformance lies in the RWK composition which favors the more established and larger players in the mid-cap space. Larger companies have been favored this cycle via their attractive funding profile, thus being able to better absorb higher rates. The larger and more established a company, the better able they are to place fixed long term debt. Long dated fixed rate debt issued in 2020/2021 has been a key for low funding levels and high profitability for many corporates.
Expect this trend to continue with the high level of the producer price index on March 14 which you can read about here. A high PPI figure will end up in the CPI, which in turn means the Fed will not be able to cut many times in 2024. High floating rates translates into weakness for small caps, while the more established high revenue mid-caps should profit.
In our initial IJH article we went into details regarding valuations and why we find mid-caps attractive at this stage in the cycle. Since RWK contains the same names, we are not going to re-hash the same analysis, just present a visual guide for why mid-caps are attractive:
P/E Ratios (ratios)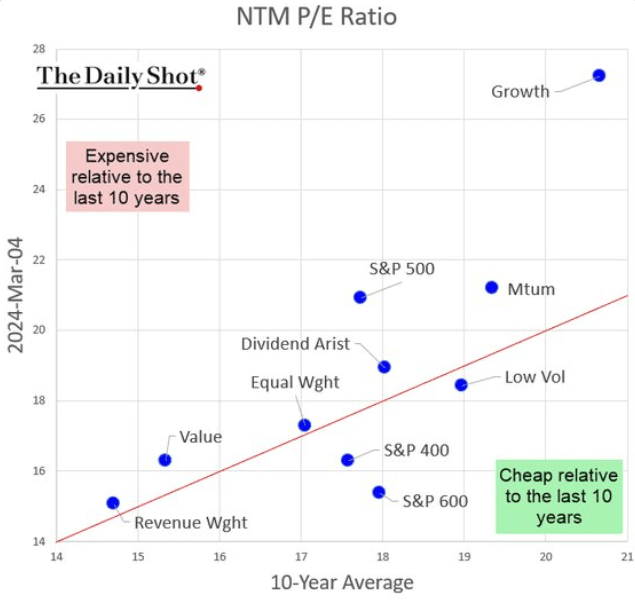
At any stage of a macro cycle, starting valuations when entering a position are important. The S&P 500 is stretched as per the above historic regression, while mid-caps are attractive.
When looking at the fund valuation metrics they look favorable when compared with the wider market:
Valuation Metrics (Morningstar)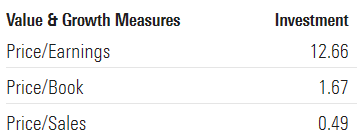
The fund’s P/E ratio is at a mere 12.6x, while the S&P 500 one is at 20x. RWK has a low P/B ratio of 1.6 and shockingly a P/S ratio of 0.49. As a reminder, the market darling Nvidia (NVDA) has a P/S ratio of 35.4.
As a rule of thumb, when compared to the SPY, P/E levels below 15x are favorable for the fund, especially in light of its composition which emphasizes well-established, revenue rich corporates.
RWK contains the best of both worlds – attractive valuations from a P/E perspective, and attractive funding levels via the build that emphasizes larger companies with high revenue figures. RWK therefore represents an attractive targeted mid-cap take. We fully expect RWK to keep outperforming IJH in this ‘higher for longer’ environment.
Risks to the thesis
The main risk for a long position in RWK is represented by a hard landing. A hard landing references a scenario where the ‘higher for longer’ rates environment ends up hurting the economic growth via a depleted consumer. We have seen delinquencies creep up on auto loans and credit card debt, but they are still within historic norms. If a scenario materializes where the consumer is not able to spend anymore and the unemployment rate spikes, we could get such hard landing.
In such an instance profitability will be hurt across the board, thus hurting earnings for mid-caps and pulling prices down, even with the same overall P/E levels. The market currently assigns a low probability to this scenario.
Analytics
- AUM: $0.75 billion.
- Sharpe Ratio: 0.5 (3Y).
- Std. Deviation: 22 (3Y).
- Yield: 1.05%.
- Premium/Discount to NAV: n/a.
- Z-Stat: n/a.
- Leverage Ratio: n/a.
- Expense Ratio: 0.39%
- Composition: Equities / Mid-Cap
Conclusion
RWK is an equity ETF. The fund represents a take on IJH, parsing mid-cap holdings via their revenue figures rather than market cap. This targeted take contains a fundamental factor as a filter, and ends up representing a winning formula. RWK has outperformed IJH in the past three years, matching the S&P 500 performance, without any tech mega-caps in its holdings. The driver behind this outstanding performance is represented by the better funding profile of the selected names, versus a market weighted capitalization version. With rates higher for longer, expect this theme to persist.

 Q2 2024 Earnings Call Transcript")

