Oil prices declined at the beginning of trading on Tuesday, settling at $73.40 per barrel. This comes in conjunction with no new developments in the Red Sea and the opening of Libya’s largest oil field to date.
This indicates an increase in supply and an additional production of 270,000 barrels per day, bringing the total production for the OPEC member state to over a million barrels per day, almost restoring supply to pre-OPEC+ cuts levels.
At the same time, the U.S. Dollar Index (DXY) is facing some selling pressure from a technical perspective. The index recorded lower highs and lower lows on the daily chart, suggesting that the U.S. dollar may soon weaken.
In terms of economic data this week, traders will be awaiting the U.S. Gross Domestic Product (GDP) reading, the Federal Reserve’s preferred inflation indicator, and the Personal Consumption Expenditures (PCE) price index. These releases are expected to cause significant market volatility.
I believe the resumption of production at the Libyan oil field, after a two-week halt, will reintroduce over a million barrels per day into the markets, significantly increasing supply and potentially causing a sharp decline in prices.
Chinese oil data shows that Russia has become the primary supplier to the Asian country, potentially weakening Chinese demand due to its relative satisfaction with Russian oil, further supporting a medium to long-term price decrease.
This comes after a Chinese demand increase of 8.6% to 14.24 million barrels per day. Following China’s decision to keep its key lending rates unchanged yesterday and market expectations for more easing to support the economy, oil demand may decline in the coming months, supporting further market declines.
Brent crude oil prices are experiencing a moderate increase at the beginning of the week, currently approaching $78.40 per barrel. This upward trend is primarily influenced by evolving energy demand expectations. Recent overall economic data has cast some doubts on future demand, partially offsetting factors that previously supported prices, such as tensions in the Middle East.
From my perspective, Brent crude seems poised for a phase of sideways to downward movement within a defined price range. Despite some current downward pressures, ongoing geopolitical tensions in the Red Sea and the Gulf of Aden maintain significant risk premium support for oil prices.
The price movement in the market is also reflected in the spread between the current Brent price and its futures contracts for the next six months, indicating expectations of potential oil supply constraints in the future.
Technical analysis of the oil (WTI) prices
Crude oil prices are once again challenging one of OPEC’s members, namely Saudi Arabia, regarding the production cuts it has implemented.
Russia has already violated its production cut commitments, and Libya is adding more supplies with the resumption of its largest oil field, bringing the country’s production back to over a million barrels per day. This situation puts pressure on OPEC’s efforts to control production levels and stabilize oil prices.
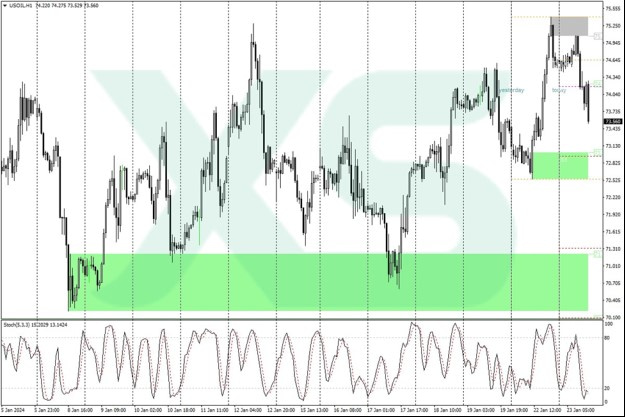
Oil (WTI) Prices Chart –-XS.com MT4.
In an upward scenario on the chart, the $74 level continues to act as a strong resistance after the failed breakout above it last Friday. However, the $80 level could be achieved if geopolitical tensions escalate, the resistance is breached, and the price consolidates above it with a full daily candle. Once the $80 level is broken, the next target would be $84 as a potential upward objective.
In a bearish scenario, if the price remains below $74, the $67 level will remain a key support, aligning with the triple bottom since June. If this triple bottom is breached, the price could decline to a new low at $64.35, the lowest level since May and March 2023, serving as the last support line. However, the $57.45 level would be the next level if prices decline sharply and breach the support convincingly.
Support Levels: $73.00 – $72.50 – $71.60
Resistance Levels: $74.60 – $75.50 – $76.20

 Q2 2024 Earnings Call Transcript")

