I-HWA CHENG/AFP via Getty Images![]()
In our prior analysis, we identified several key strengths of Nvidia Corporation (NASDAQ:NVDA), encompassing its impressive performance metrics, extensive product range, cost-effectiveness, and a steadily expanding brand presence. Notably, Nvidia has positioned itself as a frontrunner in the AI landscape, boasting a comprehensive approach with a diverse suite of AI products tailored for various industries. We attribute part of Nvidia’s competitive edge to strategic partnerships in the AI realm. Our assessment of the bullish scenario hinged on awaiting Nvidia’s AI developments and relying on certain assumptions. We concluded Nvidia to be the King of Data Centers given its strategic focus on that data center end-market.
In the interim since our last coverage, Nvidia’s projected revenue growth for FY2024 has surged to an estimated 118.1%, significantly outpacing our initial base case projection of 28.7% and even surpassing our optimistic bull case of 56.9%.
Consequently, our scrutiny now centers on evaluating whether Nvidia is effectively leveraging the AI opportunity. Firstly, we delve into the company’s recent product advancements to determine if it maintains a competitive edge in the AI domain. Additionally, an in-depth analysis of the performance of its segments in 2023 is undertaken to identify the primary drivers of its growth. Finally, a comprehensive examination of its profitability is conducted, allowing for a comparison with our earlier forecast.
Continuous Product Developments in Data Center Segment
Firstly, we examined the company’s new product developments over the past 2 quarters including its latest product roadmap, AI foundry service, Spectrum-X Networking, GH200 Superchips and NVIDIA TensorRT-LLM.
Product Roadmap
Nvidia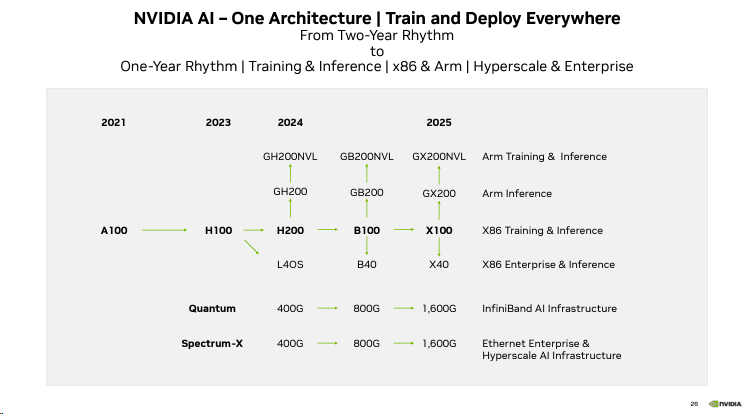
Based on Nvidia’s latest product roadmap for its Data Center segment, the company highlighted planned new products launched throughout 2024 until 2025. In our latest analysis of Advanced Micro Devices, Inc. (AMD), we highlighted that all 3 companies, including Nvidia, AMD, and Intel Corporation (INTC), have an advantage in certain areas. However, Nvidia’s GPU product roadmap includes the anticipated H200 data center GPU which is the successor to its current H100 chip. Nvidia claims that its H200 will offer 2x LLM inference performance and a reduction in energy consumption and TCO by 50% compared to H100. Following that, the roadmap shows the launch of B100 in 2024 which “will offer more than 2x the AI performance of Hopper GPUs” according to Nvidia. Furthermore, the company’s subsequent model generation will be the X100 by 2025.
In addition, the company plans to launch its GH200 superchip in 2024 with an NVL model variant followed by future generations beyond 2024. We explained more about the GH200 chip below.
Additionally, the company’s roadmap shows the L40S GPU in 2024, designed for AI inferencing. Compared to its Hopper series GPUs, the L40S is based on its Ada Lovelace architecture and its specifications are considerably lower than its Hopper series GPUs as seen below. However, the chip costs are lower.
Also, within networking which includes its Quantum InfiniBand and Spectrum products, the company’s roadmap shows its plans for future generations offering higher performance through 2025. In comparison, Intel also highlighted its roadmap for its next-gen Gaudi3 GPUs whereas AMD had recently launched its new MI300X GPUs in December 2023, highlighting competition for Nvidia.
AI Foundry Service
NVIDIA’s AI foundry service combines Nvidia’s AI Foundation Models (such as NVIDIA Nemotron-3 8B models), NeMo framework, and DGX Cloud AI supercomputing services to offer a complete solution for customers to building custom generative AI models. It includes pre-trained models for high performance, a cloud-native framework for development, and an AI-training-as-a-service platform. The company has a partnership with Microsoft, leveraging its cloud. Its customers already include SAP SE, Amdocs and Getty Images. For example…
SAP plans to use the service and optimized RAG workflow with NVIDIA DGX Cloud and NVIDIA AI Enterprise software running on Azure to help customize and deploy Joule®, its new natural language generative AI copilot. – Nvidia
The benefit highlighted through this partnership involves a complete stack of software (NeMo) and hardware (DGX Cloud) offered on Microsoft Azure, as well as cross-selling opportunities between Microsoft and Nvidia as highlighted below.
For the first time, this entire process with all the pieces that are needed, from hardware to software, are available end to end on Microsoft Azure. Any customer can come and do the entire enterprise generative AI workflow with Nvidia on Azure. They can procure the required components of the technology right within Azure. Simply put, it’s a co-sell between Nvidia and Microsoft, – Manuvir Das, VP of enterprise computing at Nvidia.
Nvidia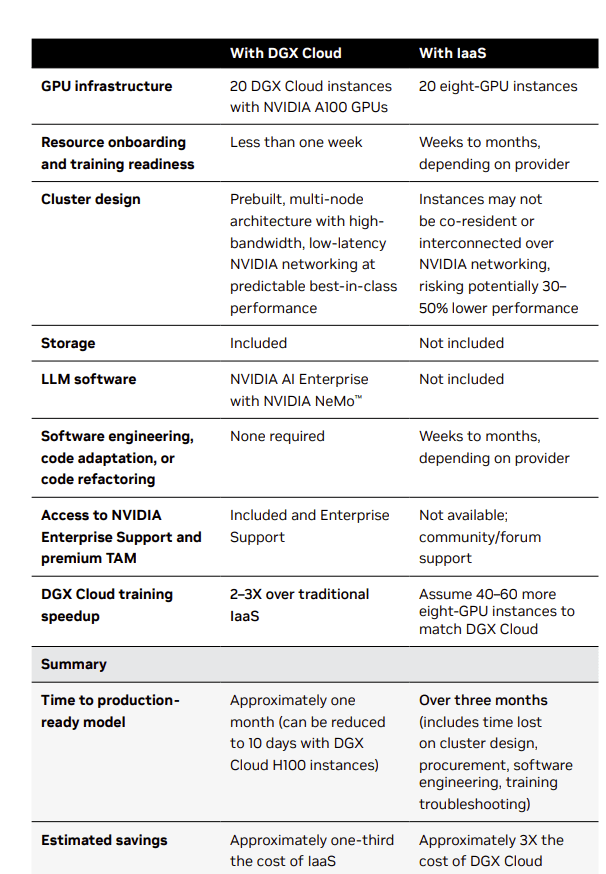
Overall, the benefits of DGX compared to traditional cloud service IaaS are shown above according to Nvidia, including higher performance, speed and cost savings.
Spectrum-X Networking
In our previous analysis of AMD, we compared the product breadth of Nvidia with AMD and Intel and determined that “all 3 companies also have DPUs and networking interconnect.”
According to the company, its new Spectrum-X networking platform features its “Nvidia’s 51.2Tbit/sec Spectrum-4 Ethernet switch and BlueField-3 data processing unit (DPU)” products. Nvidia claims to boost generative AI performance by 1.7x compared to traditional fabrics, offering improved multi-tenant performance, enhanced scalability, faster network setup, and higher resiliency. Spectrum-X ensures standard Ethernet connectivity, increased power efficiency, and secure infrastructure, leveraging RoCE extensions for optimized networking, NCCL integration for AI cluster performance, and very low latency. The company stated that it is collaborating with servers from Dell Technologies Inc. (DELL), Hewlett Packard Enterprise Company (HPE), and Lenovo Group Limited (OTCPK:LNVGF).
Through our collaboration, Dell Technologies and Nvidia are providing customers with the infrastructure and software needed to quickly and securely extract intelligence from their data, – Michael Dell, Dell Chairman and CEO.
With the Spectrum-X, Nvidia would be competing against Broadcom’s ethernet switches such as its Tomahawk and Jericho chips which we previously highlighted for AI applications. According to Broadcom Inc. (AVGO), Nvidia’s Spectrum-X is a vertically integrated Ethernet platform aimed at minimizing congestion and enhancing AI job completion times, comparable to Broadcom’s strategy with Tomahawk5 (51.2 Tbps) and Jericho3-AI switch ASICs.
There’s nothing unique about their device that we don’t already have, – Ram Velaga, SVP of Broadcom’s core switching group.
Overall, we believe the Spectrum-X highlights product integration opportunities Nvidia is capitalizing on with its networking interconnects and DPUs.
GH200 Superchips
Furthermore, the company has launched its GH200 chips which are a combination of its GPUs and CPUs for data centers. According to Nvidia, the GH200 is a versatile computing platform by integrating the NVIDIA Hopper GPU with the NVIDIA Grace CPU in a single superchip, connected through the high-bandwidth and memory-coherent NVIDIA NVLink-C2C interconnect. This interconnect offers up to 900 GB/s of total bandwidth, enabling oversubscription of GPU memory and direct utilization of the NVIDIA Grace CPU’s memory, supporting up to 480GB of LPDDR5X CPU memory per GH200. With the Grace CPU delivering 2X performance per watt, featuring 72 Neoverse V2 Armv9 cores, and the H100 Tensor Core GPU providing ninth-generation performance, the GH200 ensures a balanced and efficient system. Coherent memory benefits enhance developer productivity, and the GH200 offers class-leading performance for HPC and AI workloads. For example, customers such as AWS have unveiled new EC2 instances with GH200 superchips and Nvidia DGX Cloud on Amazon.com, Inc.’s AWS (AMZN) leverages GH200 NVL32 for AI training.
However, in terms of competition, AMD has recently announced its MI300A, the first data center APU for AI and HPC workloads which includes 24 CPU cores and 228 CDNA 3 GPU compute units. Additionally, Intel had previously indicated in its roadmap to merge high-performance CPUs and GPUs into an XPU called Falcon Shores by 2024, potentially challenging Nvidia.
NVIDIA TensorRT-LLM
The TensorRT-LLM by NVIDIA is an open-source library created to optimize the performance of substantial language models, such as Meta’s Llama 2, when running on NVIDIA GPUs. It streamlines LLM inference, making it faster and more accessible while reducing TCO and energy consumption. For example, the company claims that it enables twice the performance for inferencing on GPT-J and 1.8x higher performance on Llama2 with TensorRT-LLM for its H100 GPUs. The library supports various LLMs, excelling in tasks like article summarization and offering advanced techniques like in-flight batching. TensorRT-LLM also supports quantization for memory efficiency. It includes ready-to-run versions of popular LLMs and, on Windows PCs, accelerates generative AI up to 4 times faster, leveraging NVIDIA GPUs with Tensor Cores for enhanced performance.
Moreover, both Intel and AMD also provide software tools for optimizing AI workloads. For example, Intel provides the Extension for Transformers toolkit, optimizing Transformer-based models on platforms like Intel Gaudi2, CPU, and GPU. Meanwhile, AMD’s open-source ROCm 6 platform optimizes HPC and AI workloads, supporting AMD Instinct MI300 accelerators and various frameworks.
Outlook
Overall, we believe these product developments highlight the rapid pace of product development of Nvidia within its data center segment, which is its largest, accounting for 75% of its total revenues, such as with the recent development and launch of data center CPUs integrated with its GPUs, expansion of its networking portfolio as well as new software solutions supporting its hardware performance. Additionally, based on its product roadmap, we believe this further emphasizes the company’s commitment to continue expanding its product portfolio with the upcoming releases of GPUs, superchips and networking products through 2025.
In comparison, AMD has recently released its MI300x and has not updated a product roadmap while Intel only highlighted the launch of its next-gen Gaudi-4 in 2024, thus we believe Nvidia’s rapid product developments could allow it to be more competitive in the data center chip market due to its continuous product developments which are expected to lead to performance improvement with its next-gen chips and expand its product breadth which we believe are some key competitive factors in the market.
Does It Have an Advantage Over Competitors?
Furthermore, in our previous analysis of AMD, we analyzed the partnerships, product breadth and performance of Nvidia, AMD and Intel. We determined that each company has its own competitive strengths and withheld from assigning a competitive factor score for any one company. We reexamined and updated our comparison of their partnerships by examining key partnerships announced in 2023. Then, we updated our comparison of their product breadth as well as a performance comparison within the data center segment.
Partnerships
As highlighted in the previous point, Nvidia has entered into a partnership with Microsoft to leverage Microsoft Azure with its AI foundry service featuring an end-to-end platform of hardware (DGX) and software (NeMo and Nvidia AI Foundation Models) to enable customers to create and deploy AI models on Azure. Furthermore, Nvidia had also entered into a partnership with Azure to integrate its AI Enterprise Software suite in Azure “using the more than 100 NVIDIA AI frameworks and tools”. Besides that, ServiceNow and Nvidia had partnered to develop custom LLMs on its ServiceNow Platform which in turn is “also helping NVIDIA streamline its IT operations with these generative AI tools, using NVIDIA data to customize NVIDIA NeMo foundation models running on hybrid-cloud infrastructure.” Additionally, another key partnership is with Dell as a “joint initiative” to make servers integrated with Nvidia NeMo frameworks and GPUs.
In comparison, AMD and Intel’s partnerships that were announced throughout 2023 had been general partnerships. For example, AMD announced that it made deals with cloud service providers such as AWS, Alibaba Group Holding Limited (BABA) and Microsoft and Oracle Corporation (ORCL) to incorporate its new EPYC server CPUs. Intel announced a collaboration with BCG to leverage its Gaudi and Xeon CPUs to enable BCG to “to deliver enterprise-grade, secure generative AI to customers” as well as its new Xeon processors to be available on Google Cloud. Additionally, Nvidia has general partnerships as well such as its expansion of partners offering new H100 products to AWS, Alphabet Inc. (GOOG), (GOOGL) and Microsoft Corporation (MSFT).
Product Breadth
|
Data Center Portfolio |
Nvidia |
AMD |
Intel |
|
CPU |
Yes (Grace) |
Yes (EPYC) |
Yes (Xeon) |
|
GPU |
Yes (H100, H200, L40S, B100, X100) |
Yes (MI300X) |
Yes (Gaudi) |
|
DPU |
Yes (BlueField) |
Yes (Pensando) |
Yes (‘IPU’) |
|
Integrated CPU and GPU |
Yes (GH200) |
Yes (MI300A) |
Expected in 2024 |
|
Networking Interconnects |
NVLink (Quantum & Spectrum) |
Infinity Fabric |
CXL Interconnect |
|
Software |
Yes (Nvidia TensorRT-LLM, Nvidia AI Foundry Service, NeMo) |
Yes (‘ROCM’) |
Yes (OpenVino, Extension for Transformers) |
Source: Company Data, Khaveen Investments.
Based on our updated table comparison of the product breadth offering of Nvidia with its competitors, we see that Nvidia has made significant progress in expanding its product breadth. For example, the company stated in its latest earnings briefing that it has launched its Grace CPU along with its integrated product featuring its CPU and GPU which “are ramping into a new multi-billion dollar product line”. Furthermore, the company announced that its next-gen Hopper GPU will be launching in Q2 2024 followed by the subsequent releases of the B100 and X100 GPUs by 2025. Additionally, the company offers a broader portfolio of networking interconnects following its launch of the new Spectrum networking platform integrating its DPU and Infiniband technologies, compared to AMD and Intel which only have their Infinity Fabric and CXL Interconnect respectively. Finally, the company also expanded its software offering breadth compared to AMD and Intel, such as Nvidia TensorRT-LLM to optimize its Hopper GPU performance for AI as well as AI foundry services leveraging its DGX solution.
Performance
|
Data Center GPU Comparison Metrics |
AMD (MI300x) |
Nvidia (H100 NVL) |
Nvidia (H100 SXM) |
Nvidia (H200) |
Intel (Gaudi 2) |
|
Process |
5nm (TSMC) |
4nm (TSMC) |
4nm (TSMC) |
4nm (TSMC) |
7nm (TSMC) |
|
Transistors (‘bln’) |
153 |
160 |
80 |
80 |
>100 |
|
Engine Clock Peak |
1.700 GHz |
1.98GHz |
1.98GHz |
– |
– |
|
FP16 Peak (Teraflops) |
1,532 |
3,958 |
1,979 |
1,979 |
839 |
|
INT 8 (Teraops) |
3,064 |
7,916 |
3,958 |
3,958 |
1,628 |
|
Texture rate |
1,496 |
– |
1,045 |
– |
– |
|
Memory Clock |
1.9GHz |
5.1GHz |
1.3GHz |
– |
1.56Ghz |
|
Memory Capacity |
192GB HBM3 |
188GB |
80GB HBM3 |
141GB HBM3E |
96GB |
|
Memory Bandwidth |
5.2TB/sec |
7.8TB/s |
3.35TB/s |
4.8TB/s |
2.45TB/sec |
|
Interconnect Bandwidth |
896 GB/sec |
600GB/s |
900GB/s |
900GB/s |
100GB/s |
|
Max Power Consumption |
700W |
800W (2x400W) |
700W |
700W |
600W |
Source: Company Data, Khaveen Investments.
Firstly, in terms of specs, Nvidia’s new H200 generally has higher specifications compared to AMD and Intel, in terms of FP16 Peak and INT 8. That said, AMD’s latest MI300x has a higher memory capacity and bandwidth compared to the Nvidia H200. Whereas in terms of interconnect bandwidth, Nvidia’s H200 edges out AMD and Intel. However, we note that Nvidia’s H100 NVL which is a product that features 2 H100 GPUs stacked together edges out AMD and Intel in all areas except in interconnect bandwidth. Thus, in terms of specifications, Nvidia seems to hold a competitive edge compared to AMD and Intel.
Based on AMD’s presentation, AMD did highlight that its inferencing performance compared to Nvidia’s H100 is superior on Bloom and Llama 2 LLMs.
AMD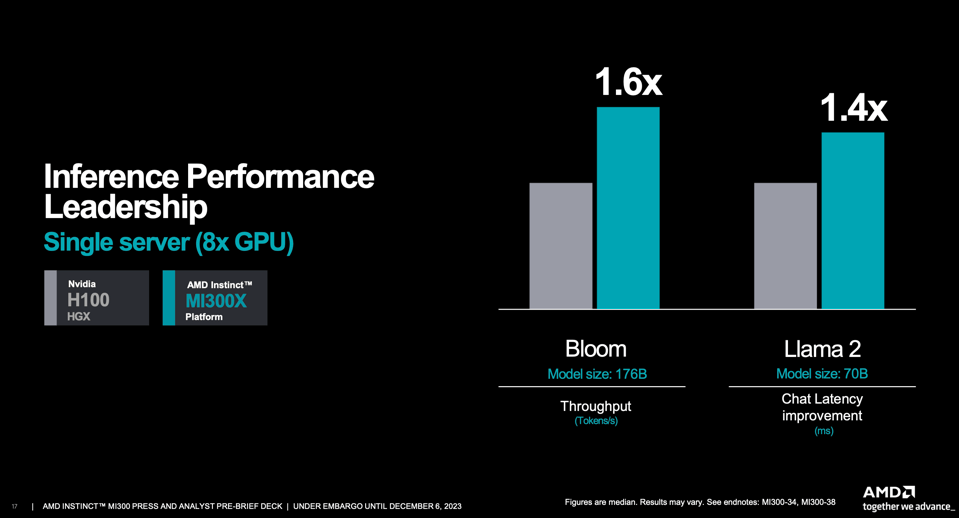
While this may seem advantageous to AMD, Nvidia countered AMD’s performance results, stating that AMD’s comparison featured Nvidia’s H100 hardware which was not optimized with its TensorRT-LLM tool. Nvidia then released new results comparing a similar test with optimized H100 GPUs.
Nvidia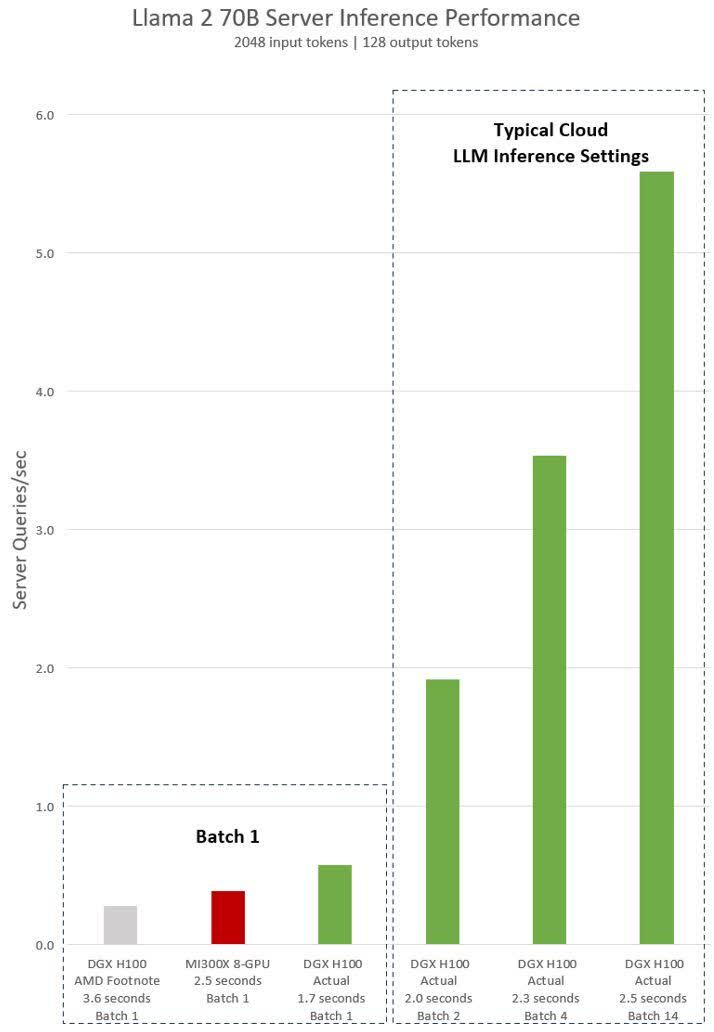
As seen in the chart, for standardized results with a batch size of 1, Nvidia optimized H100 had higher performance than AMD’s MI300x with a lower time of only 1.7 seconds compared to 2.5 seconds for AMD, an improvement of 32% compared to AMD. Also, Nvidia compared its optimized H100 results with the same result AMD conducted using unoptimized hardware, with an improvement of 52% lower time taken.
DGX H100 can process a single inference in 1.7 seconds using a batch size of one-in other words, one inference request at a time. A batch size of one results in the fastest possible response time for serving a model. To optimize both response time and data center throughput, cloud services set a fixed response time for a particular service. This enables them to combine multiple inference requests into larger “batches” and increase the overall inferences per second of the server. Industry-standard benchmarks like MLPerf also measure performance with this fixed response time metric. – Nvidia.
Furthermore, in terms of our benchmark score which we derived in our previous analysis of AMD based on texture rate and floating-point processing power performance in terms of FP16, 32 and 64 operations, we updated our benchmark score calculation to standardize each factor and weighted compiled the average scores for Nvidia, AMD and Intel for their past 4 generations of data center GPUs. For processing power performance, we used normal cores for floating-point processing performance comparison, and not Tensor Cores for a standardized comparison without the impact of software optimization. Furthermore, we adjusted Nvidia’s score for its Hopper series GPUs based on Nvidia’s comparison between its TensorLLM optimized performance with its unoptimized performance above (52%).
Company Data, TechPowerUp, Khaveen Investments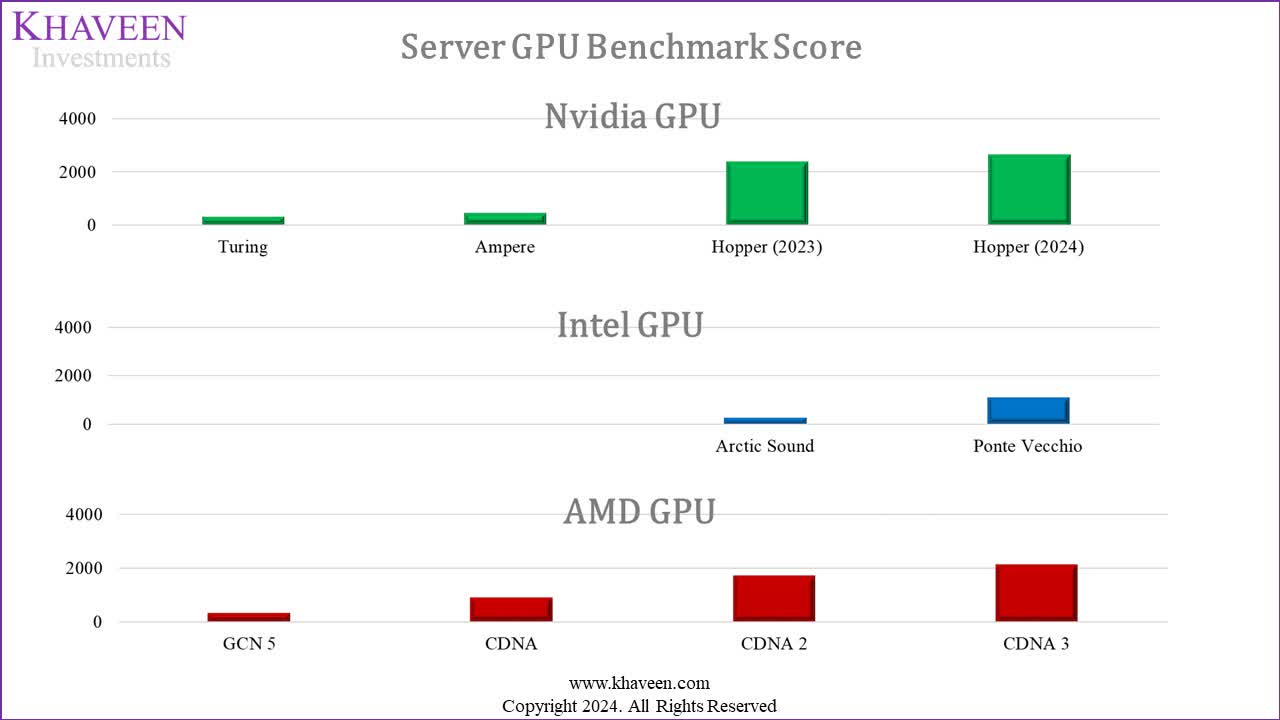
|
Nvidia GPU Model |
Turing |
Ampere |
Hopper (2023) |
Hopper (2024) |
|
Khaveen Investments Benchmark Score |
294 |
440 |
2,380 |
2,632 |
|
Growth % |
49.5% |
440.9% |
10.6% |
|
|
Intel GPU Model |
Arctic Sound |
Ponte Vecchio |
||
|
Khaveen Investments Benchmark Score |
260 |
1,072 |
||
|
Growth % |
312.7% |
|||
|
AMD GPU Model |
GCN 5 |
CDNA |
CDNA 2 |
CDNA 3 |
|
Khaveen Investments Benchmark Score |
332 |
910 |
1,715 |
2,127 |
|
Growth % |
173.9% |
88.5% |
24.0% |
Source: Company Data, TechPowerUp, Khaveen Investments.
Overall, we cannot effectively verify which company’s claim is more truthful, thus we rely on the base estimate that the companies provide. Based on base estimates, Nvidia’s performance is shown as higher than Intel and AMD, accounting for its performance adjustment.
Outlook
To summarize, based on our analysis of a comparison of the key partnerships, product breadth and performance, we believe that Nvidia has an advantage in all 3 areas. In terms of partnerships, we believe its key partnerships with Microsoft (second largest cloud service provider) and Dell (top server maker) could enable the company to leverage its combination of GPU hardware and software products to serve customers looking to utilize its solutions for AI such as AI foundry service and NeMo. Moreover, we believe its product breadth expansion since our last analysis indicates a strength for Nvidia such as its product roadmap offering visibility into its upcoming product launches. In relation, our benchmark scores are higher than Intel and AMD due to our indicators factoring out Nvidia’s optimization impact on performance and that its optimized performance better reflects its capabilities, especially as TensorRT-LLM is a free and open source.
|
Ranking |
Partnerships |
Product Breadth |
Performance |
Average |
Factor Score |
|
Nvidia |
1 |
1 |
1 |
1.00 |
1.5 |
|
AMD |
2 |
2 |
2 |
2.00 |
1.0 |
|
Intel |
2 |
3 |
3 |
2.67 |
0.7 |
Source: Khaveen Investments.
Based on our analysis, we derived a factor score for Nvidia as we believe it has a competitive advantage over AMD and Intel. Based on our ranking for partnerships, product breadth and performance, we derived an average of 1. Based on that, we calculated a factor score of 1.5x which we applied in our updated forecast of our data center projection. Notwithstanding, we believe the market is an oligopoly with few companies as well as highly lucrative and it is at a stage of rapid tech evolution, which makes it hypercompetitive while the pace of innovation is extremely rapid which will result in companies’ products becoming better and better. We expect each company to overtake one another in terms of performance advantage. Regardless, one thing that is definite going forward is the continuous product performance improvement overall.
Explosive Growth Due to Higher Data Center Growth
We examined the factors for the company’s stronger-than-expected growth in 2023. We compared our revenue projections for its Q3 YTD growth with our base and bull case projections for 2023.
|
Revenue Breakdown ($ mln) |
2022 |
Q3 TTM 2023 |
Our Previous 2023 Forecast (Base Case) |
Our Previous 2023 Forecast (Bull Case) |
|
Data Center |
15,005 |
32,737 |
21,161 |
25,286 |
|
Growth % (YoY) |
41.4% |
119% |
41.0% |
68.5% |
|
Gaming |
9,067 |
9,413 |
10,121 |
13,021 |
|
Growth % (YoY) |
-27.2% |
5% |
11.6% |
43.6% |
|
Professional Visualization |
1,544 |
1,316 |
1,724 |
2,217 |
|
Growth % (YoY) |
-26.9% |
-8% |
11.6% |
43.6% |
|
Automotive |
903 |
1,104 |
1,247 |
1,331 |
|
Growth % (YoY) |
59.5% |
67% |
38.1% |
47.5% |
|
OEM & Other |
455 |
300 |
455 |
455 |
|
Growth % (YoY) |
-60.8% |
-40% |
0.0% |
0.0% |
|
Total |
26,974 |
44,870 |
34,708 |
42,310 |
|
Growth % (YoY) |
0.2% |
68% |
28.7% |
56.9% |
Source: Company Data, Khaveen Investments.
Company Data, Khaveen Investments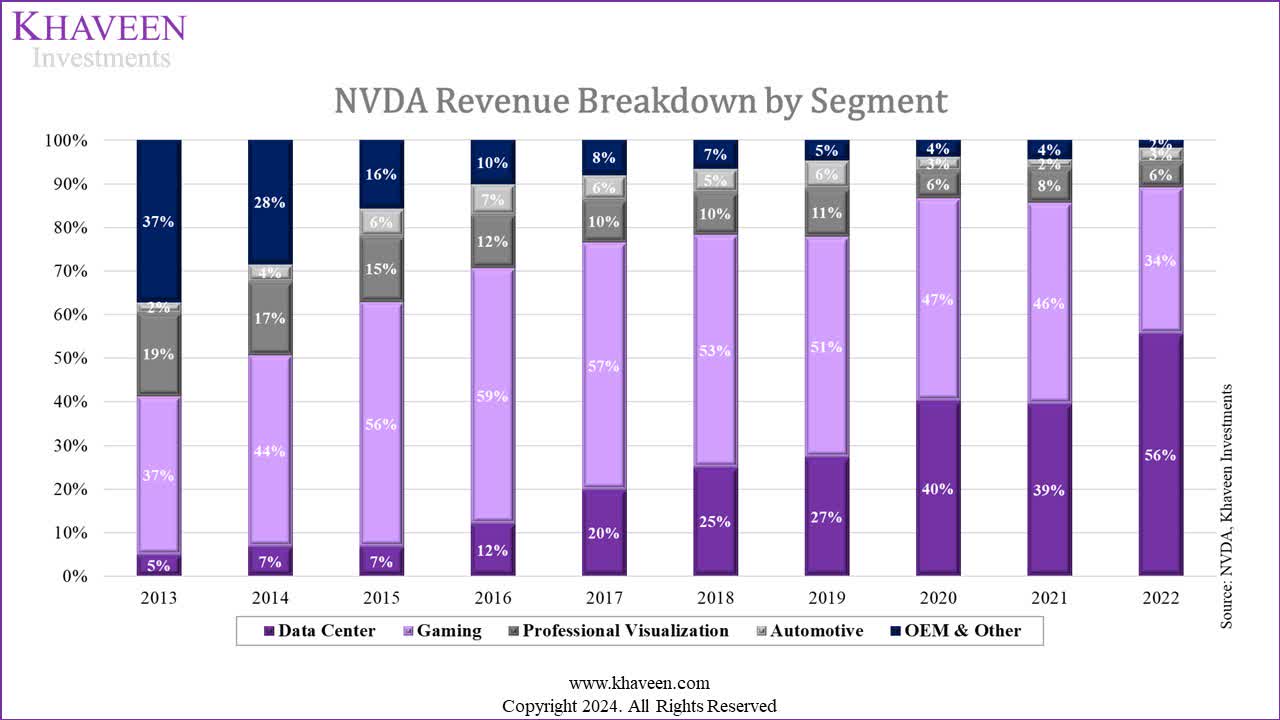
Comparing its Q3 YTD 2023 growth with our base and bull case forecasts for the full year of 2023, we see that its Data Center segment growth had outperformed our expectations significantly with a growth rate of 155.7% compared to our bull case of 68.5%. Moreover, its Gaming segment growth underperformed with a 4.8% growth, which is more in line with our base case. Additionally, Professional Visualization growth is also lower than our forecast with negative growth. Finally, its Automotive growth was also stronger than our projections in both cases. Thus, the main reason for its outperformance is its Data Center segment. We examined its segment performance below.
Data Center
Based on the company’s earnings briefing, the company highlighted the growth in the Data Center segment due to the ramp of its HGX platform and Hopper GPUs as well as networking growth driven by Infiniband growth.
The continued ramp of the NVIDIA HGX platform based on our Hopper Tensor Core GPU architecture, along with InfiniBand end-to-end networking, drove record revenue of $14.5 billion, up 41% sequentially and up 279% year-on-year. – Jensen Huang, CEO.
In October 2022, Nvidia launched its H100 GPUs. As mentioned in the previous point, we believe that one of the advantages of Nvidia is the optimized performance of its H100 as well as key partnerships. According to Omdia, there are estimated orders of 650,000 H100 GPUs for AI and HPC from cloud service providers and social media companies such as Meta Platforms, Inc. (META), Microsoft, Google, Amazon and Oracle, totaling a calculated order value of $20 bln based on the estimated price of an H100 of $30,000. Furthermore, Omdia also highlighted increased demand from Server OEMs such as Dell. Lenovo and HPE but “cannot get enough AI and HPC GPUs to fulfill their server orders yet.” Server ASPs have increased by 30% QoQ due to new high-spec equipment containing GPUs, for example, a server can contain 8 H100 GPUs.
Overall, we believe the company has planned well to capitalize on the data center chip market with its robust product portfolio across various data center types as we previously highlighted such as its server GPUs used across supercomputing, hyperscale, enterprise and cloud data centers.
|
Data Center Market Share |
2019 |
2020 |
2021 |
2022 |
2023 (Q3 YTD) |
|
Intel Revenue ($ bln) |
21.7 |
23.4 |
22.7 |
19.2 |
11.5 |
|
Intel Market Share |
87.9% |
73.6% |
61.3% |
47.7% |
25.6% |
|
AMD Revenue ($ bln) |
0.0 |
1.7 |
3.7 |
6.0 |
4.2 |
|
AMD Market Share |
0.0% |
5.3% |
10.0% |
15.0% |
9.4% |
|
Nvidia Revenue ($ bln) |
3.0 |
6.7 |
10.6 |
15.0 |
29.1 |
|
Nvidia Market Share |
12.1% |
21.1% |
28.7% |
37.3% |
65.0% |
|
Total Revenue ($ bln) |
24.7 |
31.8 |
37.0 |
40.2 |
44.8 |
|
Total Market Share |
100% |
100% |
100% |
100% |
100% |
Source: Company Data, Khaveen Investments.
Company Data, Khaveen Investments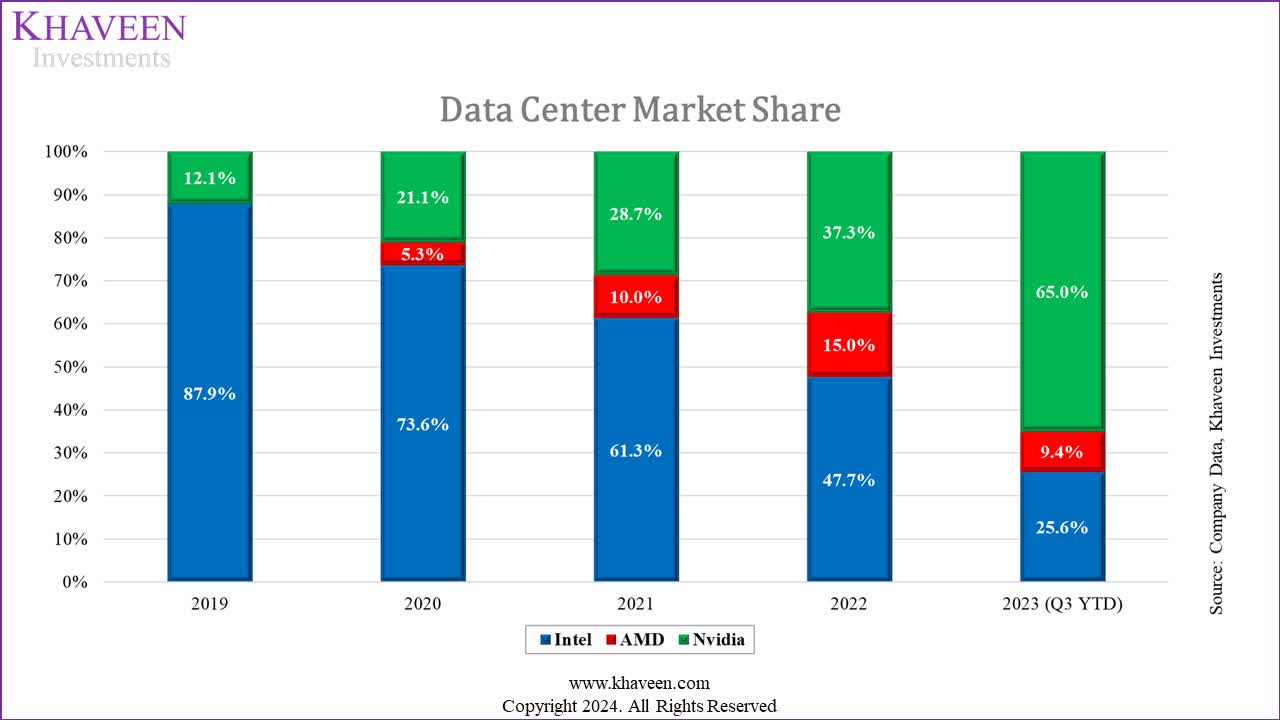
In terms of market share in data center chips, by comparing their segment revenues, Nvidia’s market share had surged rapidly in 2023 to overtake Intel at 65% as of Q3 YTD. However, Nvidia’s market share had been increasing among the 3 companies over the past 5 years, primarily against Intel which had lost market share. This is because Nvidia specializes in data center GPUs while Intel used to be focused on the server CPU market which we previously determined that GPUs have an advantage over CPUs, especially in AI computing.
Company Data, Synergy Research, Khaveen Investments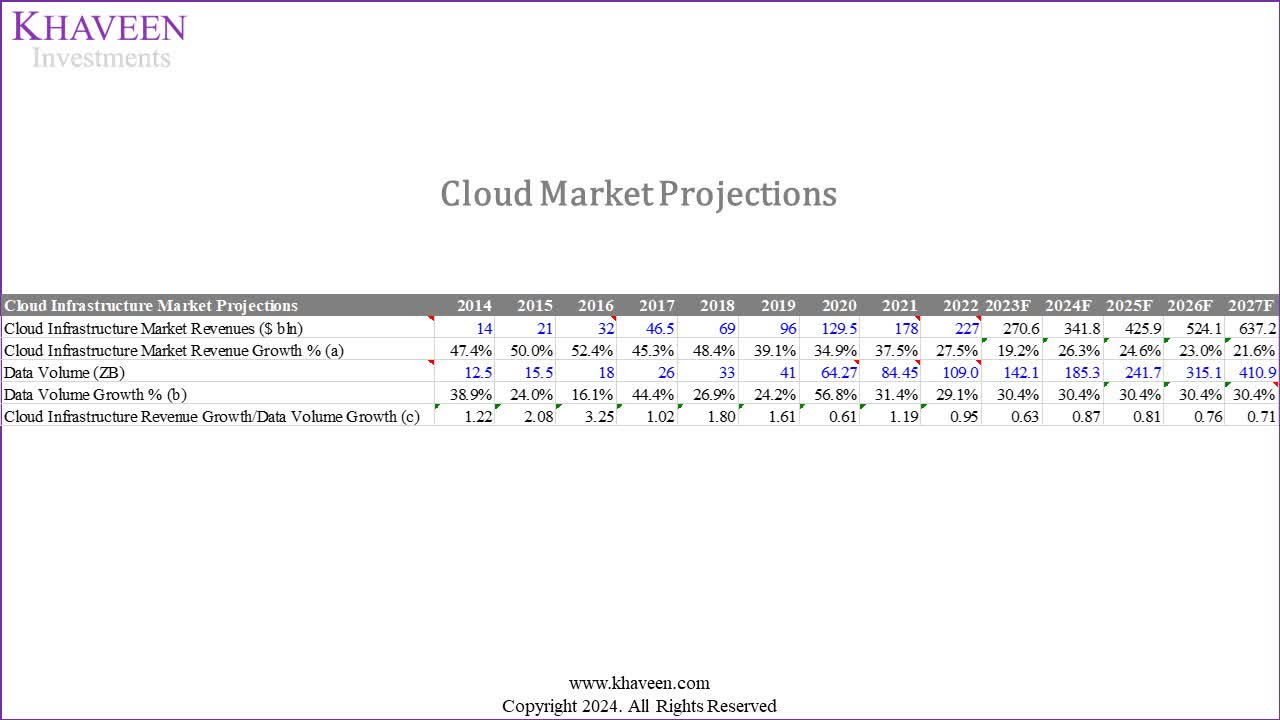
Furthermore, we updated our projections for the cloud market from our previous analysis of Microsoft with a forward average cloud market growth rate of 23%. In our analysis of AMD, we derived an AI growth contribution by estimating the increase in demand for GPUs for AI at 16% per year. As we could not derive an estimate for Nvidia due to a lack of comparison for non-AI GPUs, we used our AMD estimate of 16% to estimate Nvidia’s Data Center segment growth.
Gaming Segment
For its Gaming segment, its growth was affected in the first half of the year as the GPU market declined amid PC market weakness. However, its growth recovered strongly in Q3 2023 with an 80% YoY growth. This is as the GPU market recovered with shipment growth of 16.8% QoQ compared to Q2 2023. Furthermore, this follows after the launch of Nvidia’s next-gen RTX4000 series GPUs in Q2. Additionally, in terms of market share of PC dGPUs, Nvidia’s share had increased in 2023.
|
Discrete GPU Unit Market Share |
1Q22 |
2Q22 |
3Q22 |
4Q22 |
1Q23 |
2Q23 |
|
Nvidia |
78% |
80% |
88% |
85% |
84% |
87% |
|
AMD |
17% |
15% |
8% |
9% |
8% |
10% |
|
Intel |
4% |
5% |
4% |
6% |
8% |
3% |
Sources: JPR, Khaveen Investments.
JPR, Khaveen Investments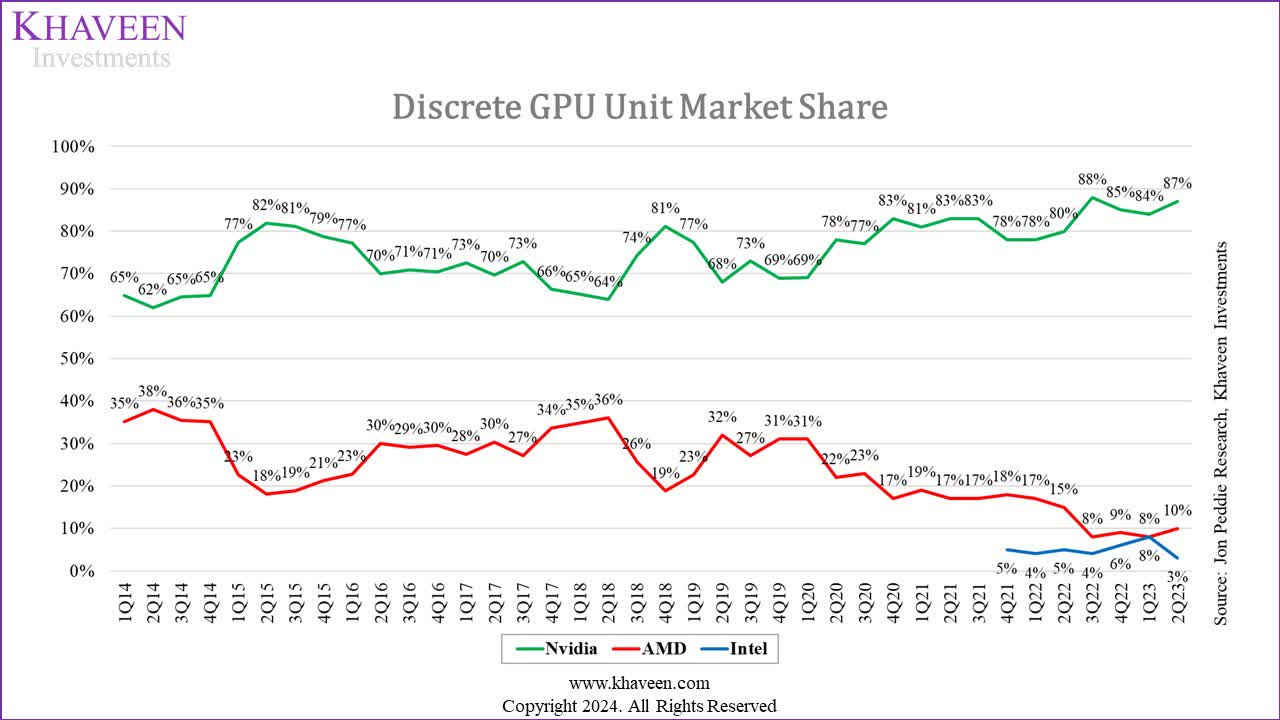
Professional Visualization
Similarly, the Professional Visualization segment growth, which includes GPUs for workstations, was also lower than both our base and bull case projections. According to the company, the segment along with Gaming experienced channel inventory correction but recovered throughout the year with strong QoQ growth from Q1 to Q3 FY2024. In Q3, its Professional Visualization revenue grew by 108% YoY as the GPU market recovered. Furthermore, the company also ramped up its new Ada Lovelace architecture for workstation GPUs with new RTX products launched in Q3, “offering up to 2x the AI processing ray tracing and graphics performance of the previous generations” according to the company.
Automotive
Based on its earnings briefings, Nvidia highlighted its growth in Automotive driven by factors such as the demand for its self-driving platforms and AI cockpit solutions, expansion of its partnership with Foxconn, increased adoption of Nvidia DRIVE Orin in new energy vehicles, partnerships with MediaTek for automotive SoCs. Moreover, the company stated that it has a $14 bln design win pipeline over the next six years. As seen by its market share, Nvidia had been fairly stable in 2023 while Qualcomm had gained share from Intel.
|
Automotive Market Share (%) |
2019 |
2020 |
2021 |
2022 |
H1 2023 |
|
Intel (Mobileye) |
40% |
45% |
47% |
45% |
39% |
|
Nvidia |
32% |
25% |
19% |
22% |
23% |
|
QUALCOMM Incorporated (QCOM) |
29% |
30% |
33% |
33% |
38% |
Sources: Company Data, Khaveen Investments.
Company Data, Khaveen Investments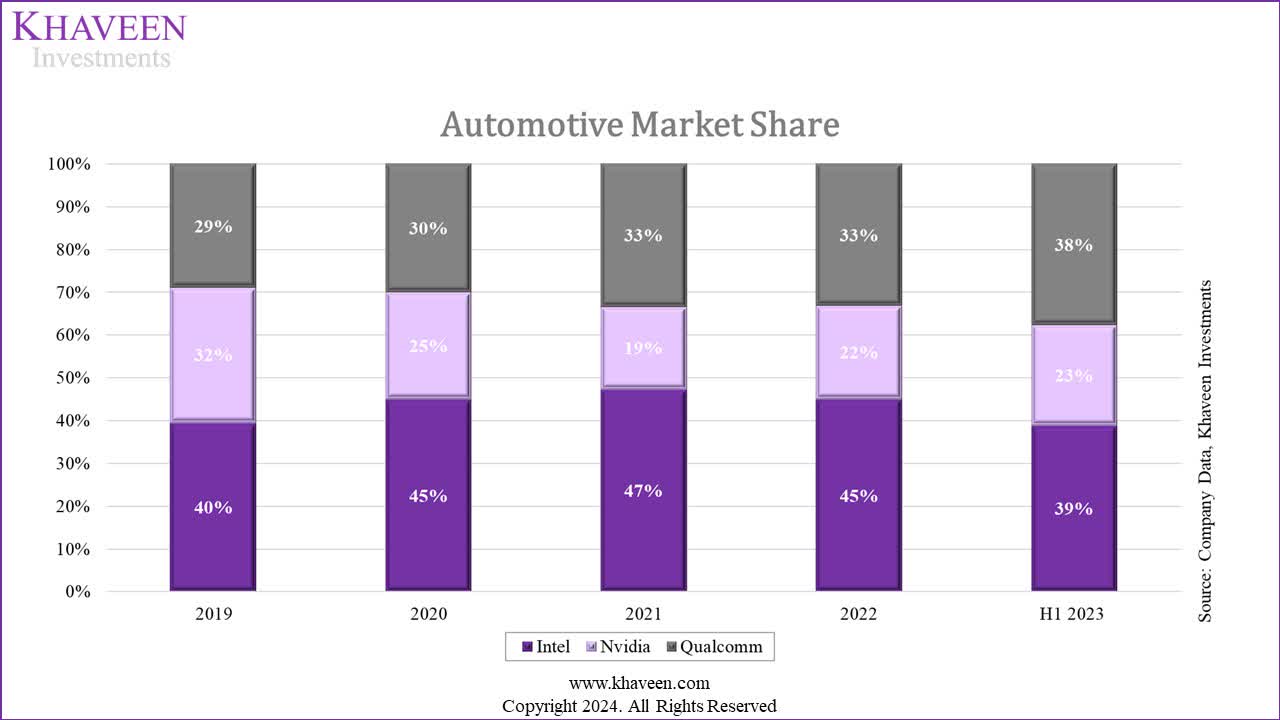
Outlook
All in all, we updated our projections for the company by segment below. For its Gaming, Professional Visualization and Automotive segments, we based our forecast on our previous base case in 2024 and beyond as its growth had been more in line with our forecasts. Whereas for its Data Center segment, we projected it based on our data center market projection which includes our cloud market projections in addition to an AI contribution increase derived from our previous analysis for a total of 42.3% in 2023.
|
Nvidia Revenue Projections ($ mln) |
2022 |
2023F |
2024F |
2025F |
2026F |
|
Gaming |
9,067 |
9,501 |
11,779 |
13,987 |
16,347 |
|
Growth % |
-27.2% |
4.8% |
24.0% |
18.7% |
16.9% |
|
Professional Visualization |
1,544 |
1,277 |
1,583 |
1,880 |
2,197 |
|
Growth % |
-26.9% |
-17.3% |
24.0% |
18.7% |
16.9% |
|
Data Center |
15,005 |
38,367 |
62,694 |
100,867 |
159,907 |
|
Growth % |
41.4% |
156% |
63.4% |
60.9% |
58.5% |
|
Automotive |
903 |
1,201 |
1,659 |
2,291 |
3,163 |
|
Growth % |
59.5% |
33.0% |
38.1% |
38.1% |
38.1% |
|
OEM and Other |
455 |
265 |
265 |
265 |
265 |
|
Growth % |
-60.8% |
-41.8% |
0.0% |
0.0% |
0.0% |
|
Total |
26,974 |
50,610 |
77,979 |
119,289 |
181,880 |
|
Growth % |
0.2% |
87.6% |
54.1% |
53.0% |
52.5% |
Source: Company Data, Khaveen Investments.
Overall, we forecasted the company’s revenue growth at a 3-year forward average of 53%, driven by its Data Center segment growth which we projected at an average of 60.9% and fairly in line with its past 10-year average growth rate of 69% and we see the segment becoming increasingly important for Nvidia with a share of total revenue of 88% by 2026 as its largest segment. We believe our growth projections indicate the strong growth outlook of the company and an acceleration as it is 28% higher compared to its past 10-year average revenue growth rate of 25%.
Risk: China Restrictions
Company Data, Khaveen Investments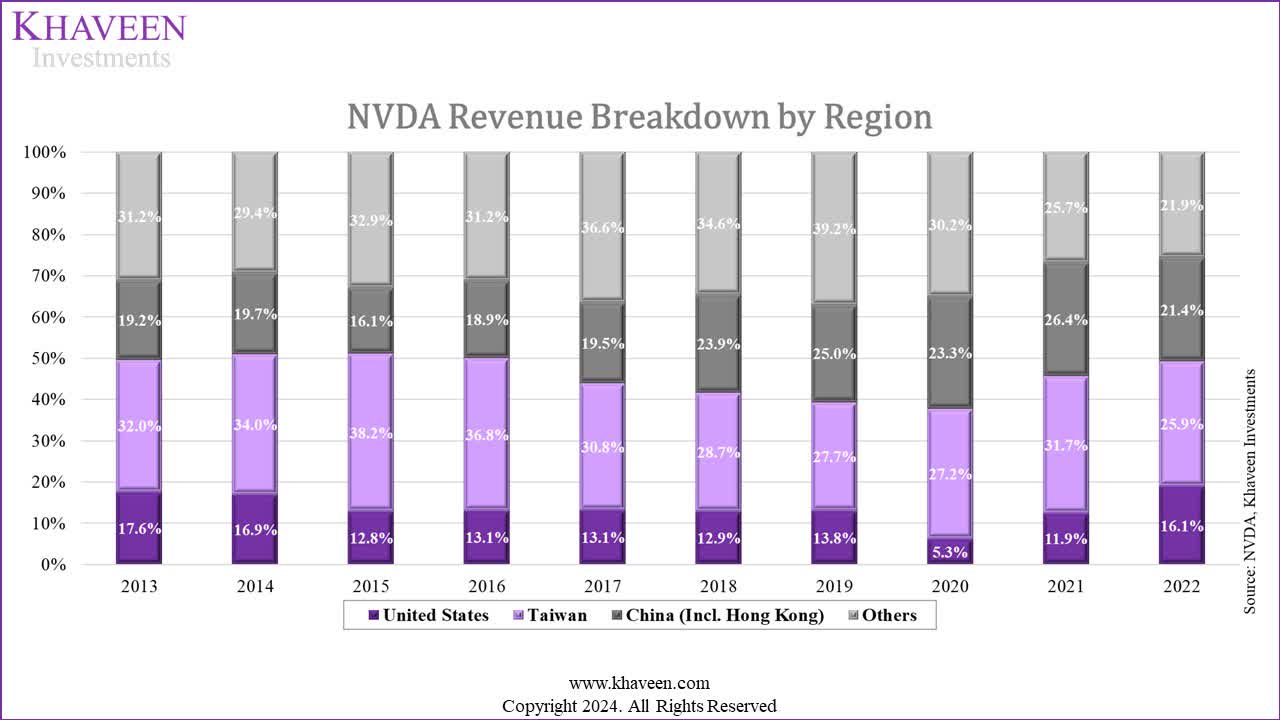
In October 2022, the US Commerce Department imposed restrictions on companies supplying advanced chips and chipmaking equipment to China. Nvidia expected that this regulation would have a significant impact on its revenue, as China’s share of revenue has been the largest in the past ten years, ranging from 26-38%, from the chart above. As Nvidia faced restrictions on its A100 and H100, it subsequently developed the A800 and H800 in March 2023 as substitutes to be able to ship to China. However, in August 2023, the US once again imposed restrictions on the export of A800 and H800 chips to China, which impacted Nvidia’s initial strategy. Nvidia stated in the latest earnings briefing that China and other affected destinations…
…have consistently contributed approximately 20% to 25% of Data Center revenue over the past few quarters. We expect that our sales to these destinations will decline significantly in the fourth quarter. – Colette Kress, EVP & CFO.
Chinese tech giants including Baidu, ByteDance, Tencent, and Alibaba have reportedly spent $1 bln on orders for A800 processors in 2023, but the control could lead to the cancellation of these orders. Furthermore, these companies have invested another $4 bln for GPUs to be delivered in 2024. That said, Nvidia is working to comply with regulations, pursuing licenses, and expanding its product portfolio to circumvent the ban and meet China’s demand for GPUs which could mitigate the revenue impact.
Valuation
Khaveen Investments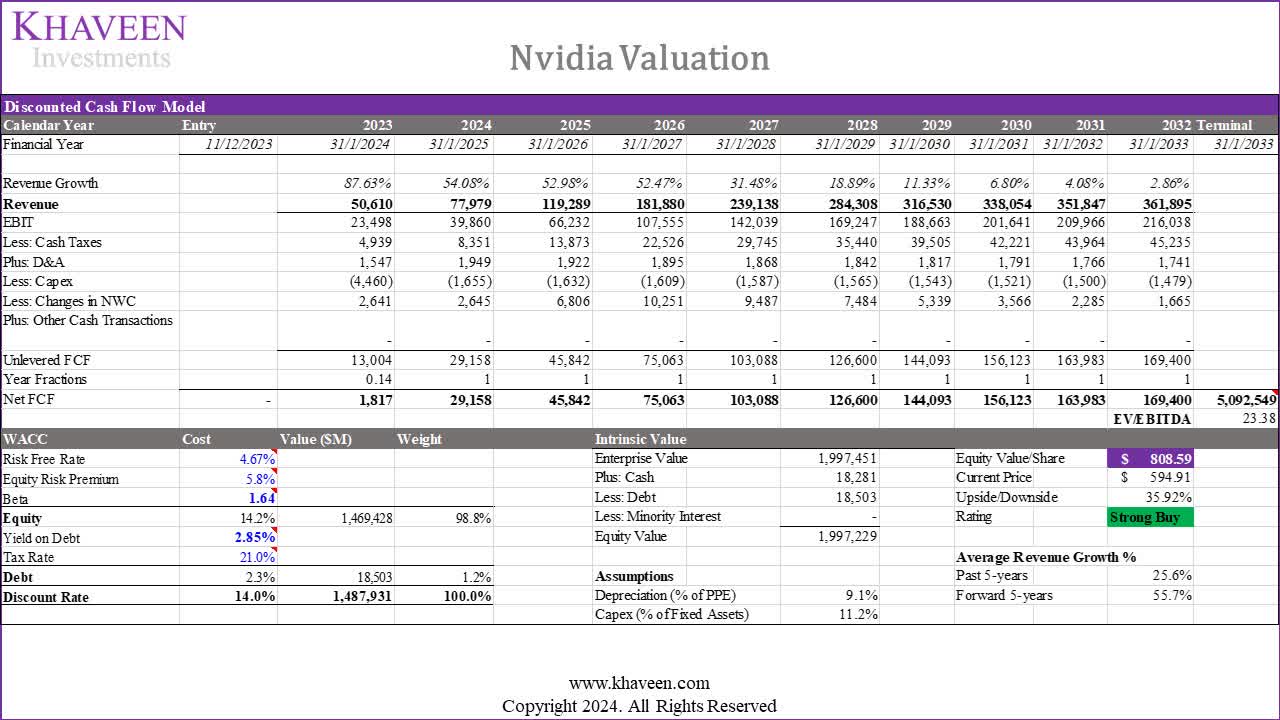
Based on a discount rate of 14% (company’s WACC) and 5-year average EV/EBITDA based on U.S.-only top chipmakers of 23.38x, our model shows an upside of 35.92%.
Verdict
We believe Nvidia’s rapid product developments in the data center segment, representing 75% of its total revenues, underscore its commitment to innovation. This includes recent launches of integrated data center CPUs and GPUs, networking portfolio expansion, and new software solutions. The product roadmap signals ongoing portfolio expansion with upcoming releases of GPUs, superchips, and networking products until 2025. In contrast, AMD’s recent MI300x release lacks a product roadmap update, while Intel’s Gaudi-4 launch is highlighted for 2024. Nvidia’s continuous product developments position it competitively in the data center chip market, emphasizing performance improvements and product breadth expansion.
In summary, our analysis favors Nvidia over AMD and Intel in key areas including partnerships, product breadth, and performance. We believe strategic partnerships with Microsoft and Dell enhance Nvidia’s position, and product breadth expansion strengthens its competitive edge as it has been doing with its portfolio of CPUs GPUs and DPUs and networking interconnect for various data center types. Our benchmark score analysis, adjusted for optimization impact, reflects Nvidia’s capabilities, contributing to our derived factor score of 1.5x. This score guides our optimistic 3-year forward revenue growth forecast of 53%, primarily driven by a 60.9% average growth in the Data Center segment. We project this segment to constitute 88% of total revenue by 2026, showcasing Nvidia’s robust growth outlook, surpassing its past 10-year average growth rate by 28%. Overall, we upgrade Nvidia to a Strong Buy with a higher price target of $808.59, due to our much higher revised revenue growth projections (5-year forward average of 55.7% vs 28.6% previously), to incorporate the bull case scenario of AI contribution to Nvidia’s revenue.

 Q2 2024 Earnings Call Transcript")

