Bloomberg/Bloomberg via Getty Images
Investment Thesis
I last covered the ProShares S&P 500 Dividend Aristocrats ETF (BATS:NOBL) in December, reasoning that its stronger dividend metrics made it a better Dividend Aristocrats choice over KNGZ, which recently changed strategies. Still, the evidence indicates that its 25 years of consecutive dividend increases screen is insufficient to keep poor-quality stocks out, limiting its total return potential. Despite free cash flow margins stuck between 0-5% and the stock underperforming the SPDR S&P 500 ETF Trust (SPY) by 246% from 2014-2023, it took one year of stalled dividend growth for Walgreens Boots Alliance (WBA) to get the boot from the Dividend Aristocrats list in 2024. What followed was management announcing it was slashing its dividend by 48% last month, possibly leading to a second boot from the Dow this year.
In this article, I discuss why NOBL is a sub-optimal choice because it doesn’t prioritize profitability. Instead, the Vanguard Dividend Appreciation ETF (VIG) looks better from a profitability and dividend growth perspective, while the Schwab U.S. Dividend Equity ETF (SCHD) is a superior value option. Either way, I don’t recommend NOBL, and I look forward to explaining why in more detail below.
NOBL Overview
Strategy Discussion
NOBL tracks the S&P 500 Dividend Aristocrats Index, selecting S&P 500 stocks with at least 25 years of consecutive dividend increases. The Index is equal-weighted, and because of the lengthy requirement, only two Technology stocks qualify: Roper Technologies (ROP) and International Business Machines (IBM). This won’t change for at least another 3-4 years when semiconductor stocks like Microchip Technology (MCHP), QUALCOMM (QCOM), and Analog Devices (ADI) can enter.
Until then, NOBL overweights the Consumer Staples and Industrials sectors at 24.67% and 23.31% allocations, respectively. Along with Technology, NOBL also underweights Energy at 2.51%, which also won’t change for a long time. Several companies, like EOG Resources (EOG) and Devon Energy (DVN), are nearly two decades short of qualifying.
ProShares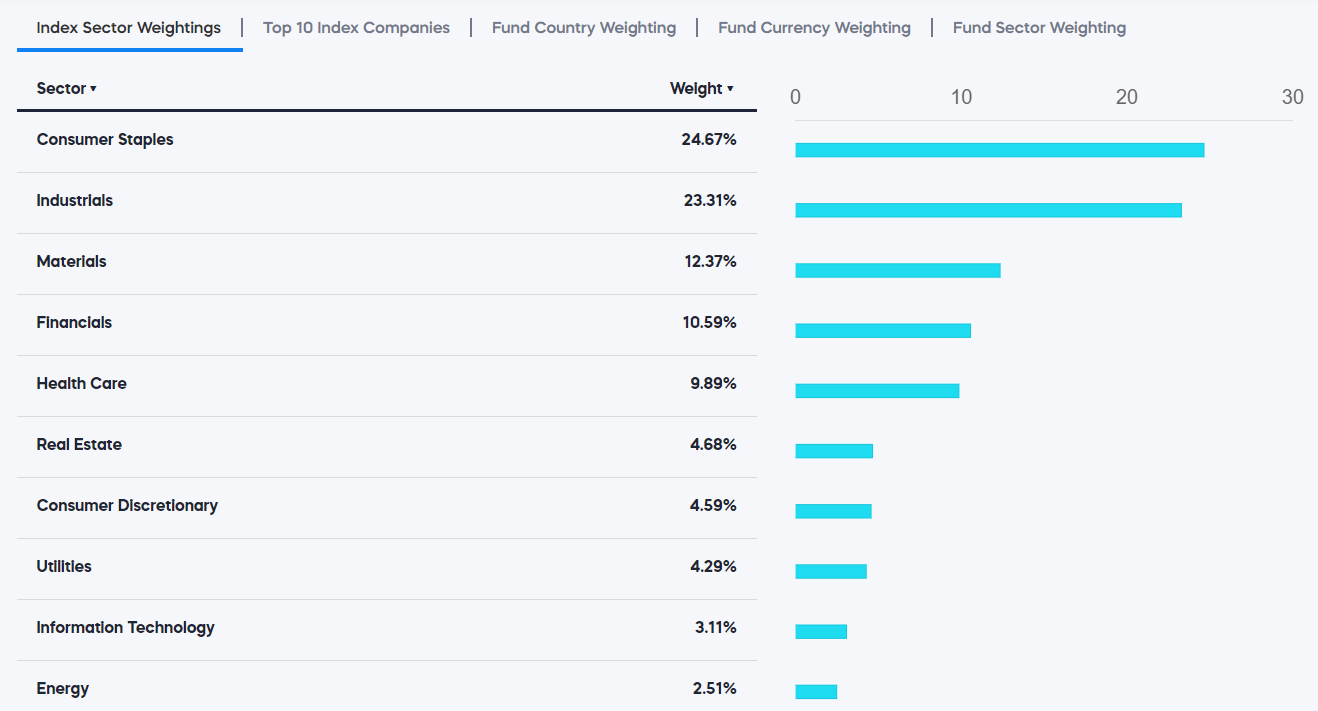
High-Level Performance Attribution
Since these sector exposures are reasonably consistent, we can quickly perform a performance attribution analysis by comparing NOBL’s performance with a portfolio of sector ETFs with these allocations. Below are the results over the last five years:
Portfolio Visualizer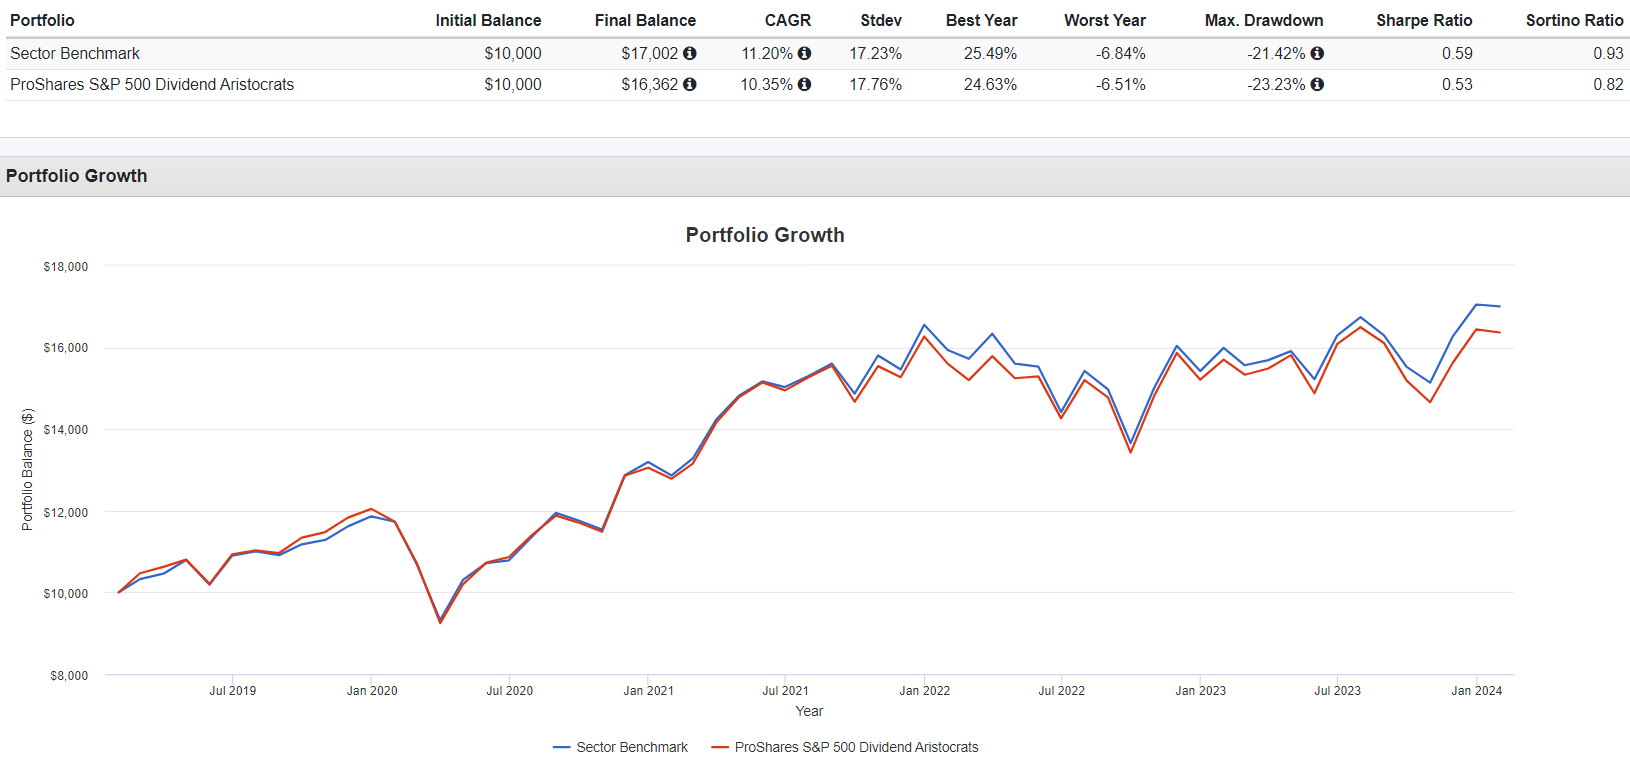
The sector benchmark portfolio, rebalanced quarterly, outperformed NOBL by 0.85% per year. Approximately 0.25% is the difference in expense ratio (0.35% vs. 0.10%), indicating the remainder is due to NOBL’s selections lagging their sector peers. It’s our first clue that the strategy could be better.
S&P 500 Index Profitability By Sector and Size
Seeking Alpha Factor Grades are sector-adjusted, meaning the system compares each company’s fundamentals to their sector peers. The approach makes sense, as low-growth sectors like Consumer Staples should not be penalized by comparing them against high-growth Technology stocks. To make calculations more manageable, I’ve converted each grade to a number on a 1-10 point scale, and I want to illustrate how profitability declines with size among all S&P 500 Index companies.
The Sunday Investor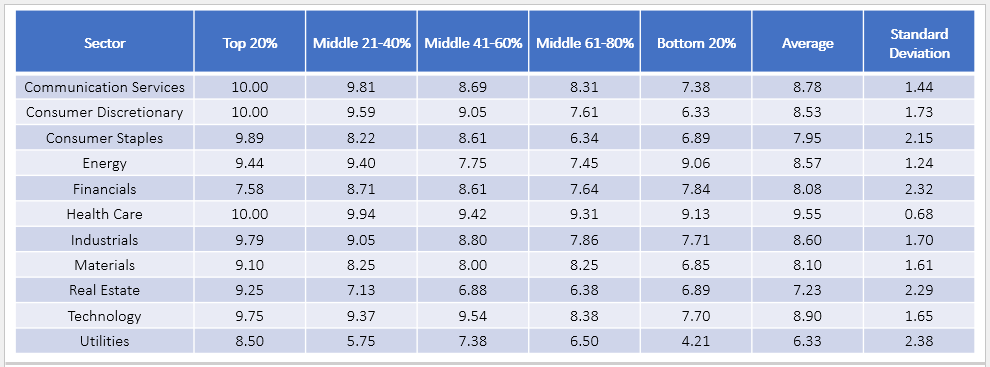
Here are three takeaways from this dataset:
1. Health Care has minimal variability (standard deviation) in profitability, indicating there is little difference in quality between mega-caps like Johnson & Johnson (JNJ) and NOBL’s smallest Health Care stock by market cap, Cardinal Health (CAH). Becton, Dickinson (BDX), and West Pharmaceutical Services (WST) also have strong Seeking Alpha Profitability Grades.
Seeking Alpha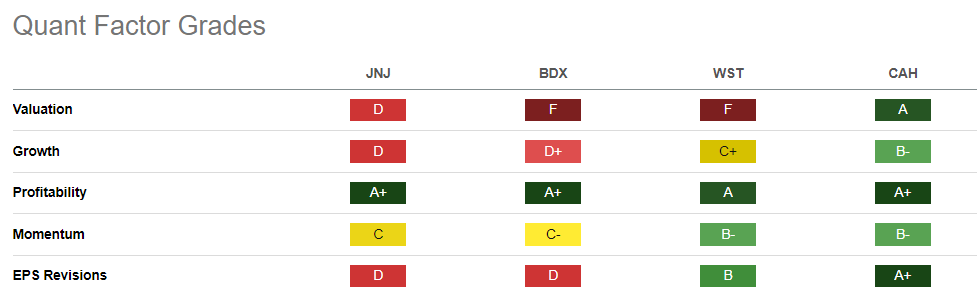
2. In contrast, NOBL’s largest sector, Consumer Staples, has a lot of variability in profit scores, and that’s where we begin to see some issues. Six stocks (CL, WMT, PG, KMB, PEP, KO) have “A+” grades, but five others (BF.B, HRL, ADM, MKC, SJM) have grades “B” or worse. NOBL is up about 28% over the last three years, and not coincidentally, all five have underperformed.
Seeking Alpha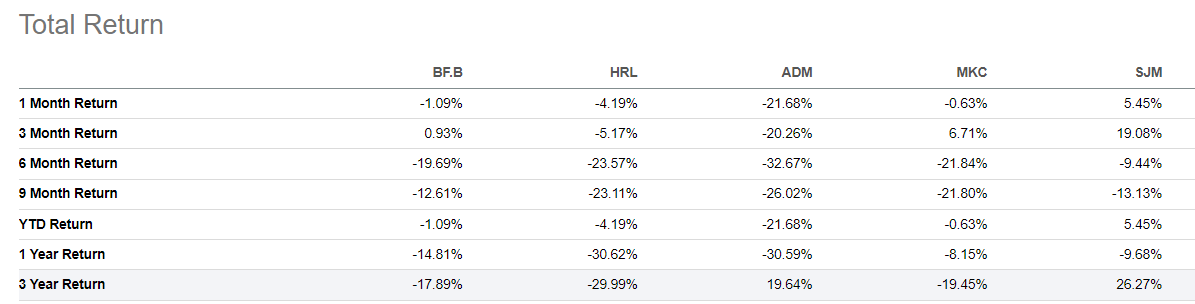
3. To a lesser extent, the same issue exists in the Industrials sector. The top 20% of S&P 500 Index companies have an average 9.79/10 profit score, but the bottom 20% have an average 7.71/10 profit score. NOBL’s selections mirror this composition and include 10/10 stocks (GWW, CAT, ADP, FAST, ITW) but also 3M (MMM) and Stanley Black & Decker (SWK), two stocks down 38% and 43% over the last three years.
Every Index has its fair share of laggards, but NOBL’s equal-weight approach that rebalances quarterly rewards the losers and punishes the winners, meaning it’s effectively anti-momentum. For all their faults, market-cap-weighted ETFs don’t do this, instead choosing to reward the most successful companies with a higher weight. And, as highlighted earlier, these top stocks are the most profitable.
NOBL Analysis
Profitability & Quality
NOBL’s profitability problem is apparent when comparing its weighted average profit score against leading dividend funds like VIG and SCHD, and also SPY. Against these ETFs and the SPDR S&P 500 ETF, NOBL’s 8.84/10 profit score is relatively poor.
The Sunday Investor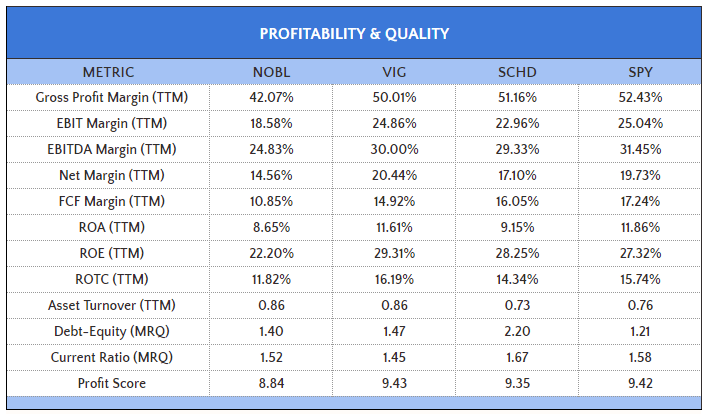
Earlier, I mentioned Walgreens’ weak free cash flow margins, but consider how NOBL’s overall 10.85% margins are 4-6% worse than VIG, SCHD, and SPY. NextEra Energy (NEE) is one source at -58.16%, but nine others (APD, ALB, ED, AFL, BF.B, MMM) have negative free cash margins, and all but ED and AFL have struggled over the last three years.
Fundamentals By Company
Next, below is a summary of NOBL’s fundamentals for its top 25 holdings, totaling 37.00% of the portfolio. Due to the equal-weighting scheme, this makes it the best-diversified company of the three comparators below.
Chart Source: The Sunday Investor; Data Source: Seeking Alpha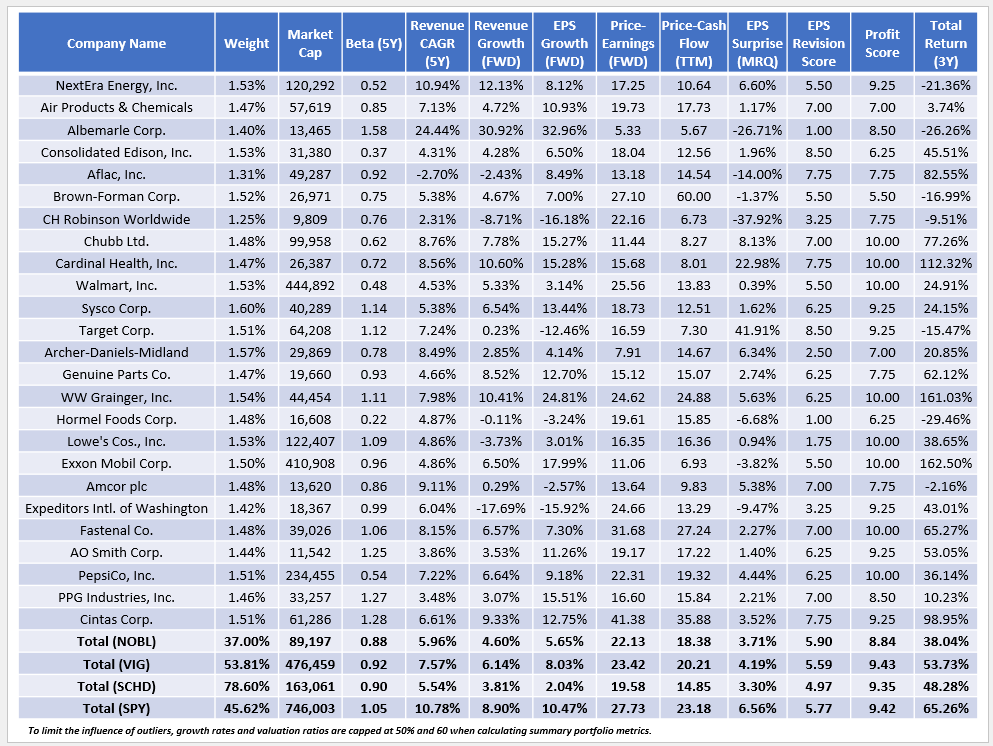
Here are three additional takeaways to consider:
1. NOBL’s $89 billion weighted-average market cap is relatively low, which helps explain its poor profitability metrics. However, one advantage is that its 0.88 five-year beta indicates it’s less volatile than the market. Recently, this has been the case, as for the first nine months of 2022, NOBL declined by 17.48%, or 6.45% less than SPY. SCHD also did well, while VIG is closer to SPY, especially since Apple (AAPL) joined its Index last year.
Portfolio Visualizer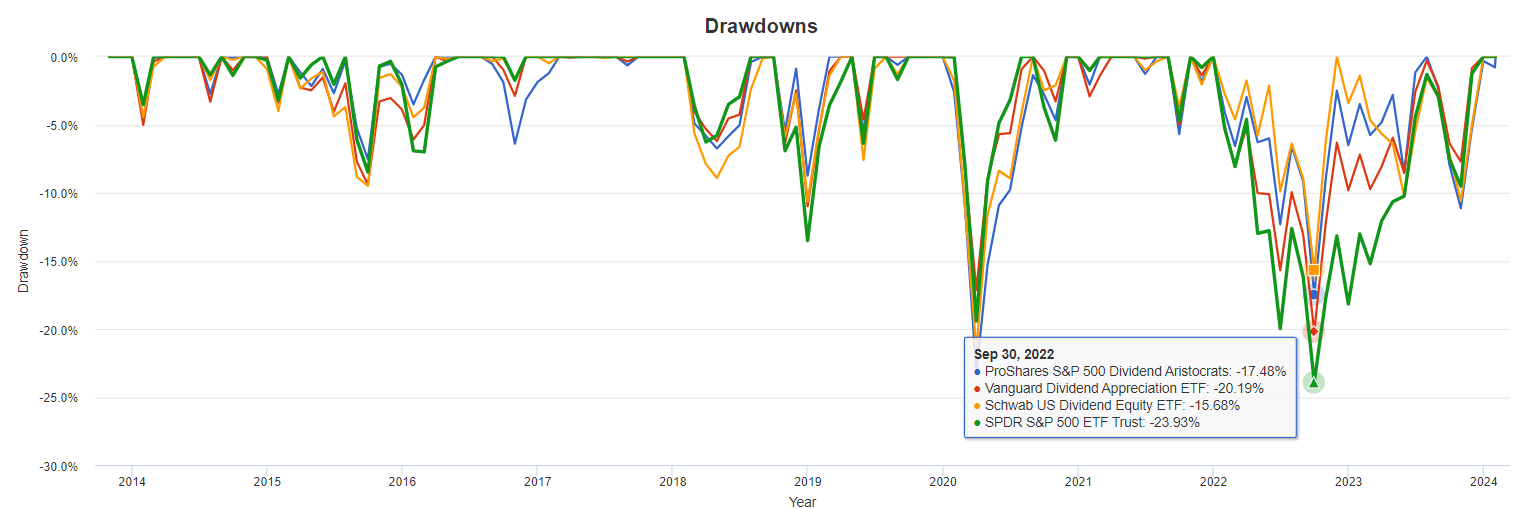
2. As mentioned earlier, NOBL’s equal-weighting scheme rewards losing stocks each quarter. As a result, we see several stocks at the top of the list with poor three-year returns, including NextEra Energy and Albemarle (ALB). Please note that this issue is smaller than the other three ETFs, which all follow some version of a market-cap-weighting scheme. Stocks with negative three-year returns comprise 9.92%, 18.12%, and 14.13%, but 22.18% in NOBL. Therefore, NOBL relies on a good turnaround story, which is the case for most value ETFs, including SCHD. However, the story is much better for SCHD because it trades at a cheaper forward P/E (19.58x vs. 22.13x), and its holdings are more profitable.
3. VIG is a suitable alternative to NOBL. Its valuation isn’t much different, but its sales and earnings growth rates are closer to SPY. It’s a bit more “all-weather, ” and as shown in the table below, its dividend features are better in most cases.
The Sunday Investor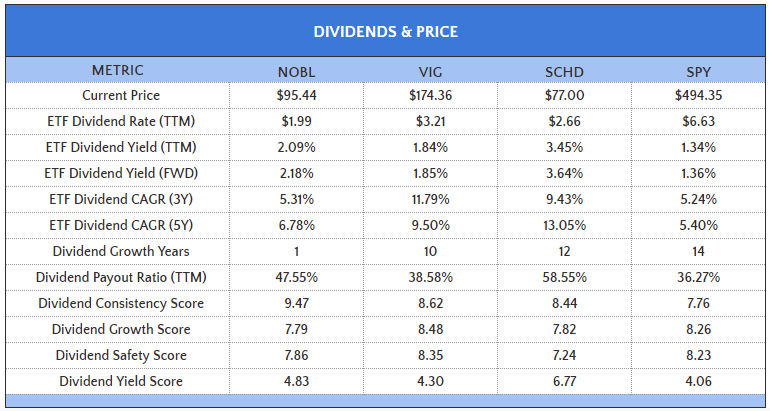
VIG’s estimated dividend yield is 1.85%, which isn’t much lower than NOBL’s 2.18%. Importantly, VIG is on a ten-year dividend growth streak, has a 9% lower dividend payout ratio, and a stronger dividend safety score, which I derived from Seeking Alpha Factor Grades.
Investment Recommendation
I don’t recommend readers buy NOBL. A portfolio of sector ETFs matching NOBL’s allocations has outperformed over the last three years, and I believe that’s attributable to lower profitability and, specifically, lower free cash flow margins. NOBL’s equal-weighting scheme is partially to blame, but its 25-year dividend growth requirement is not the high-quality screen many dividend investors think it is. Rather than screening a company based on results, the Index relies on management’s dividend policy as a proxy for quality, and as we just witnessed with Walgreens, management can be slow to act. That’s not my preferred approach, and since VIG is a low-cost alternative with superior dividend growth and quality metrics, I recommend investors switch to that ETF instead. Thank you for reading, and I look forward to your comments below.

 Q2 2024 Earnings Call Transcript")

