RyanJLane
NextEra Energy Partners (NYSE:NEP) currently has a TTM dividend yield of 12%, the question is whether it is worth the risk?
NEP owns and operates wind and solar projects and to a lesser extent natural gas pipelines (which it has announced a sale in Dec-23) and discloses it has an average contractual commitment of 14 years for its revenues. However, NEP is a relatively complicated case with a complex structure and an alphabet soup of acronyms impacting its value. It’s easy to get lost in arcane details, this article attempts to break down the pros and cons when considering investing in NEP in a simple, easy to understand manner.
1. Historical financials

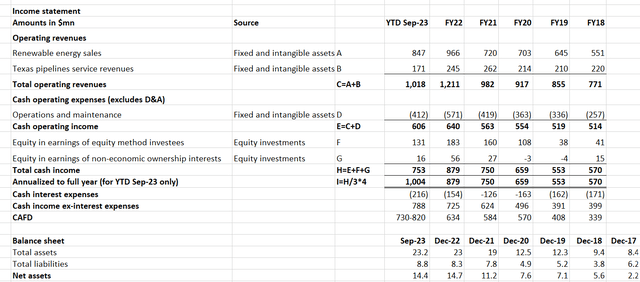
NEP income statement and balance sheet (NEP company filings and author calculations)
Note:
1.cash operating income is calculated by excluding D&A, interest expenses and other income/expenses.
2. Income Tax expenses are assumed to be minimal as after D&A and interest expenses are considered, tax expenses have historically been quite small.
NEP has seen steady growth in its revenues and income from FY18. FY18 revenues were $771m which grew to $1.2bn in FY22 and income has increased commensurately. This was mainly as a result of an expansion its balance sheet as cash-generating assets increased from $9.4 billion at Dec-18 to $23.2 billion at Sep-23.
Note that I have calculated a “cash income” through above method and compared with the cash available for distribution (“CAFD”) disclosed by NEP in each year’s investor presentation. The purpose is twofold:
(i)to understand how the income statement relates to the CAFD and understand the main drivers. It appears “cash income” is largely close to CAFD (with variations mainly arising from miscellaneous items such as loan repayments). For YTD Sep-23, the annualized “cash income excluding cash interest expenses” is USD 788m, which is close to the mid-point of the CAFD estimated by Management (i.e., $775m, the midpoint of $730m to $820m). This suggests that the cash operating income and earnings from equity investments are the main drivers of CAFD.
(ii) to use as a basis for calculating “normalized” CAFD (see further section below) by benchmarking against historical income statement and CAFD.
2. Structure of balance sheet as at Sep-23

NEP balance sheet (NEP company filings and author calculations)
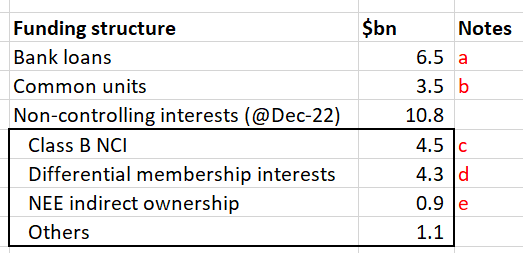
As at September 30, 2023, NEP has $17.7bn of operational assets, $2bn in equity investments, totalling roughly $20 billion in cash-generating assets, which is funded by $6.5bn in bank loans and $14.4bn in equity (other assets and liabilities largely counterbalance each other, so we won’t go into the details of these).
If we consider the income statement and balance sheet holistically, in YTD Sep-23, the above $17.7bn fixed and intangible assets generated $606m cash operating income. The $2bn equity investments and interests generated another $147m. This totals $753m in YTD Sep-23 which is equivalent to $1bn annualized for FY23. So the $20bn cash-generating assets created a cash return of $1bn a year. These $20bn cash-generating assets are funded by $21 billion in bank loans and equity.
3. Structure of funding
NEP has achieved revenue and profit growth in the historical period essentially by buying assets on leverage (either bank loans or other structured means such as CEPFs). The actual and implied cost of capital through leverage was low before the Fed’s tightening cycle as (i) rates were low and (ii) NEP’s stock price was high and appreciating.

NEP funding structure (NEP company filings and author calculations)
Note a: Bank loans are straightforward. Main risk here is that the historical rates were low and going forward if NEP slowly refinances at the new market rates and these rates remain high, then this will be a hit to earnings ( see further section below)
Note b: These represent NEP unitholders.
Note c: These are mainly comprised of CEPFs (Convertible Equity Portfolio Financing) which NEP issued during the process of acquiring projects. Basically NEP either needs to buy out these CEPFs through cash or equity issuance.
These will likely need to be bought out by NEP in cash. Issuing shares to conduct these CEPF buyouts might have made sense when NEP’s stock price was $70+, but now it’s under $30 the dilution to existing NEP unitholders will be very large. Just to illustratively show the impact if 100% of CEPFs (in practice there is an upper limit to how much of the CEPFs are bought out using equity depending on the project) are bought out through equity issuance at current prices:
According to estimates by BofA on Oct 2 2023 (“DPU Succumbs to mounting pressures”), after NEP sells its pipeline assets, it will have another $3.1 bn of CEPFs to deal with after 2026. Based on NEP’s current market cap of $2.7bn, NEP’s market cap would rise to $5.8bn whereas NEP’s distribution to unitholders in FY22 was $254m which is effectively 4.4%, which is not very appealing given the 10 year treasury yield is currently at c.4%, which implies NEP’s unit price would probably see a massive fall before any such equity issuance to buyout CEPF for the math to work out (i.e. for post-CEPF equity issuance yields to be at market levels).
Note d: Differential membership interests, which is mainly tax equity. NEP has some comprehensive slides on what these are, but long story short, I will assume that any outflows that NEP has to pay for these are relatively small (compared to the $4.4bn amount recorded in equity) and payments, if any, will be years into the future. For readers that are interested in this level of detail, they may need to estimate precisely how much this will cost and when.
Note e: This is reflected as NEE’s c.53% interest in NEP Opco. c.53% of NEP Opco’s distributions will go to NEE, with the remaining going to NEP.
4. Assessment of “normalized” CAFD
I think it is meaningful to think of a “normalized” CAFD rather than overly focus on short term CAFD because it is useful for investors to assess what level of distributions NEP can make to unitholders over a long time horizon. Even if NEP yields 10+% in FY23 and FY24, if its ability to make distributions further in the future decreases, then this would be a risk for unitholders to consider.
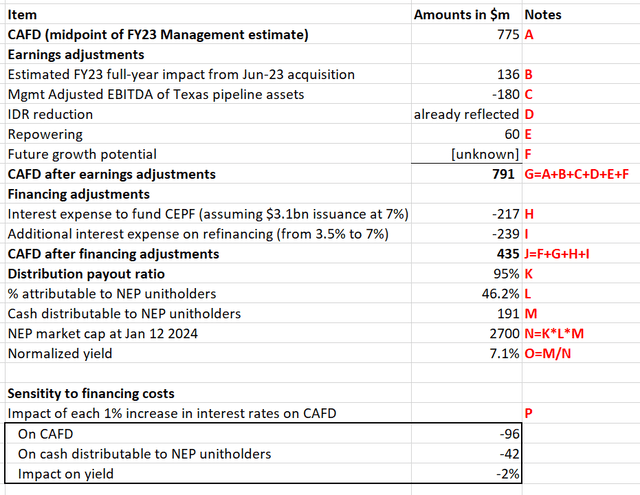
Below I make my own estimate of what a normalized CAFD would be for NEP:

Author estimate of NEP normalized CAFD (NEP company filings and author calculations)
Note A: This comes from NEP Management’s FY23 investor presentation
Note B: This is author’s estimate, based on Q3-2023 report, which disclosed the pro forma financials had the new acquisition (which occurred in Jun-23) been in place at the start of the year, the YTD Sep-23 pro forma operating income would be $159m. Assuming D&A is fixed and intangible assets at their PPA value (disclosed in the same report totalling $905m) and are depreciated over 15 years, then the D&A would be $60m. Assuming 2H-23 financials are reflected in CAFD already, then the full year impact of (estimated operating income + D&A) for 1H-23 would be (159*4/3+60)/2=136m, to reflect what the CAFD would be on an annualized basis had the acquisition taken place on Jan 1 2023.
Note C: On the balance sheet side, sale of pipeline assets will take care of roughly $1.5bn in CEPFs. Management’s estimate of the adjusted EBITDA of the Texas pipeline assets that were announced in Dec-23 to be sold (source FY23 investor presentation page 29)
Note D: NEP announced in May-23 that IDRs payments to NEE would cease from Jan 1 2023 to Dec 31 2026. However it appears this should already be fully reflected in YTD Sep-23 financials (and presumably Management’s estimate of FY23 CAFD). I’m assuming that IDR suspensions are perpetual as I’m assuming 0 potential future growth other than some moderate wind repowering. To the extent IDR suspensions are limited to only 2023-26, then this would be additional downside.
Note E: NEP Management states on page 31 that repowering wind projects would be one way for NEP to achieve growth. However, Management stated intentions of repowering wind projects of 740 MW up through 2026. Note that NEP currently has a portfolio of roughly 10GW at Sep-23, so repowering would only be equivalent to 7% of current capacity. Given the 10GW generate about $600m in cash operating income in YTD Sep-23, I assume repowering’s contribution to cash operating income would be (600*4/3*740/10000).
Note F: Future growth potential assuming limited balance sheet growth is uncertain. Management cut its guidance for DPU growth to 5-8% through 2026 in Sep-23 while only less than 4 months ago it was providing guidance of 12-15% growth in DPU through at least 2026 in May-23 Given the abrupt cut and uncertainty how the CEPFs will be bought out, for the purposes of this calculation I would err on the side of caution and assume 0 growth.
Note H: Assuming NEP raises financing at 7% interest rate to buyout $3.1bn in CEPFs. 7% is used as a baseline estimate as NEP recently issued senior unsecured notes in Dec-23 at 7.25%
Note I: Calculating additional interest expense if average borrowing rates were 7% of latest bank loan figures minus previous years. While some Seeking Alpha contributors argue that NEP will only have to refinance at higher rates over the next few years, I would tend to take a longer term view rather than just P&L and DPU over the next year or two as even at c.10%, an investor will need a decade of steady payouts before recouping his initial investment in NEP.
Note K: Assuming 95%, recent equity research reports estimate mid to high 90%.
Note L: From FY22 annual report
Note O: The result is that a normalized yield is about 7.1% on an ongoing basis assuming NEP is able to obtain average financing cost of 7% in the long run.
Note P: However, the really worrying factor is for every additional 1% in the average cost of funding above 7%, then the impact on NEP’s financials are dramatic as the dividend yield will fall by 2%. So to the point that other Seeking Alpha authors have made, NEP is to some extent a leveraged bet on interest rates. This is also a very real risk that the higher debt financing for CEPF buyouts may cause the interest rate premium to increase for NEP, even if market interest rates are unchanged.
Summary of main risks:
1.Unclear how NEP plans to grow without its previous leverage and structured instruments
2.Refinancing at higher interest rates in next few years.
3.$3bn of CEPFs to payoff – unclear how and at what cost. If through debt financing, then yields will be further depressed.
4.Sensitive to future financing cost changes.
Conclusion
After digging into NEP, I decided against buying any NEP at the current prices. Based on the above analysis, even if NEP pays out a hefty dividend yield this year, the long-term dividend yield looks like it will erode due to higher financing costs, unless NEP is able to somehow find an engine of growth without raising debt financing.


