Koh Sze Kiat/E+ via Getty Images
It’s hard today for a value investor to find cheap stocks, what with the current record high market valuations. So when this value investor spied Ally Financial (NYSE:ALLY), a stock that reached $57 in ’21, selling at $33 (now $37 after its ‘Q4 EPS), he figured it was worth taking a harder look.
So I did take that harder look, using math. Yes, math. Don’t panic, I did the work, so you can just sit back and hopefully enjoy the ride. My math journey concludes that Ally is undervalued at present, but I’d wait a bit because management seems somewhat optimistic.
My first two numbers are:
- 8-9 P/E average over the past decade for Ally. Pretty low, but Ally’s consumer finance industry is only a modest cyclical grower.
- $5.46 average expected ’25 EPS by Wall Street analysts, as reported by Seeking Alpha, with a wide range of $3.70 to $7.40.
These two numbers together – a 9 P/E and the $5.46 EPS – suggest a target price of $49, or up 30%. With a 3.3% dividend while you wait. That’s pretty attractive. But my math doesn’t make me that confident that Ally can meet or beat that $5.46 ’25 EPS estimate.
Ally’s two primary earnings drivers
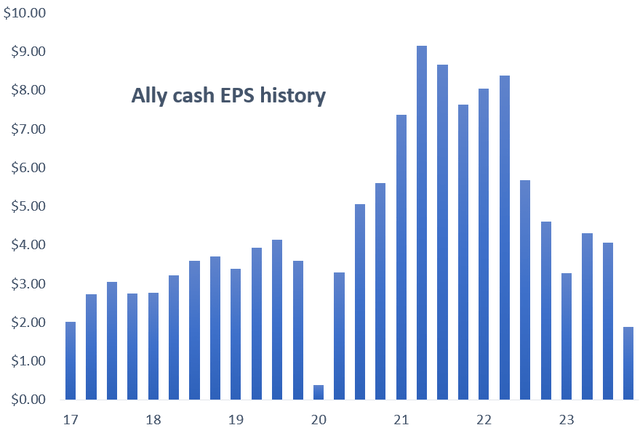
Ally’s “cash” EPS (using actual loan charge-offs and not loan loss provisions) was quite volatile over the past seven years, as this chart shows:
Sources – Ally financial statements
Ally’s earnings have a lot of moving parts:
- Multiple loan products – Not just Ally’s core retail auto loans, but loans to auto dealers, corporate loans to private equity and mid-sized companies, and credit card and home mortgage loans.
- Insurance products for auto dealers.
- Retail online banking, including deposit-taking as well as brokerage and investment products.
- Operating expenses.
- Capital management, including historically large share repurchases.
Estimating earnings therefore seems like a daunting task. But using math gives us a short-cut: 87% of Ally’s cash EPS volatility shown on the above chart is explained by changes in two pieces of data, according to a regression analysis:
- The retail auto loan charge-off rate
- Ally’s net interest margin (NIM)
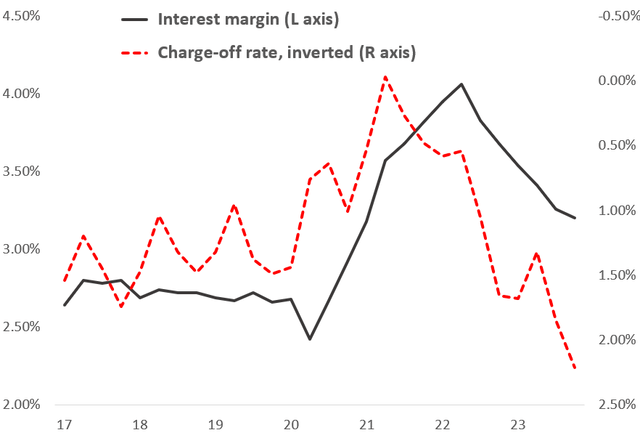
Here is a history of the two data series since 2017:
Sources: Ally financial statements
This chart shows that Ally’s:
- Q1 ’20 EPS plunged due to a COVID-driven rise in charge-offs.
- ‘20/’21 subsequent EPS surge was due to a sharp increase in its NIM plus a steep decline in charge-offs when the COVID checks started rolling in.
- ‘22/’23 subsequent EPS plunge was due to sharp reversals in both the NIM and charge-offs.
Now in turn we have to drill down into what drives charge-offs and the NIM. Let’s go!
Charge-off drivers, and my 2025 outlook
Ally’s retail auto loan charge-off rate is very largely driven by:
- The unemployment rate
- Used car prices
- Ally’s underwriting standards
Surprisingly to me, the most important driver over the past seven years was used car prices, which explained about 60% of the variance in the charge-off rate, as this chart shows:
FRED and Ally financial statements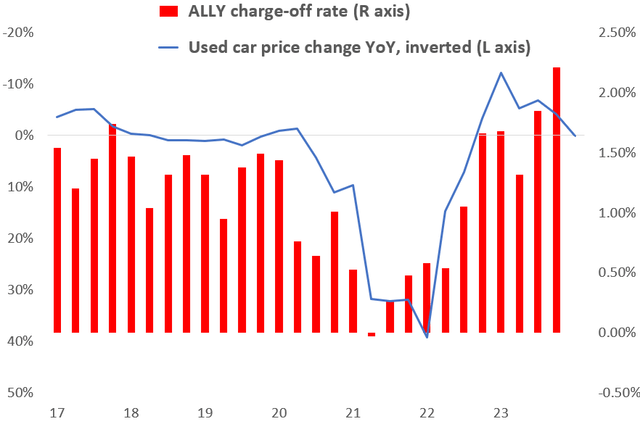
Sources: FRED (used car prices), Ally financial statements
My charge-off outlook. Starting with used car prices, here is what Ally’s management had to say during its Q4 earnings call:
“We assume another 5% decline in 2024 with much of that decline occurring in the first half of the year. That would result in a total decline from peak levels of just over 30%. We continue to expect used values will stabilize and ultimately settle around 20% higher than pre-pandemic levels. With new vehicle production below pre-pandemic levels for nearly four years, used supply will remain 15% below historical norms over the next several years and provide structural support for used values.”
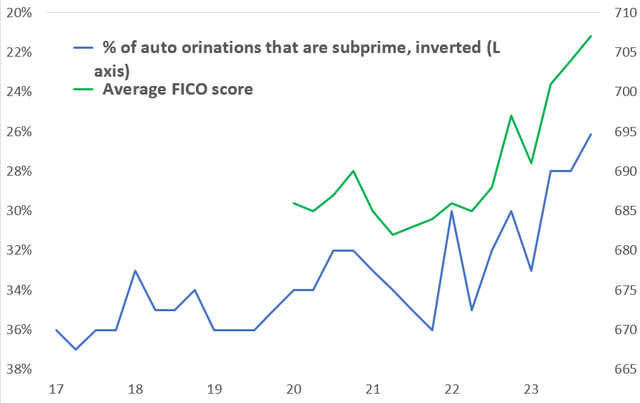
That makes sense. Another positive is that Ally has tightened up its lending standards, as this chart shows:
Sources: Ally financial statements
Ally’s average FICO score has been steadily rising, and its share of subprime credit scores (below 660) has been falling. Ally did say that its ’22 car loan originations haven’t performed well, but that year’s losses should be fading by ’25.
The only material challenge ahead is a likely rise in the unemployment rate. For example, the Congressional Budget Office forecasts that the unemployment rate will rise from 3.7% at present to 4.7% by the end of this year and will average 4.5% in ’25.
In sum, Ally expects its charge-off rate to stay flat this year and trend down next year. I assume a 1.5% rate in ’25.
Interest margin drivers, and my forecast
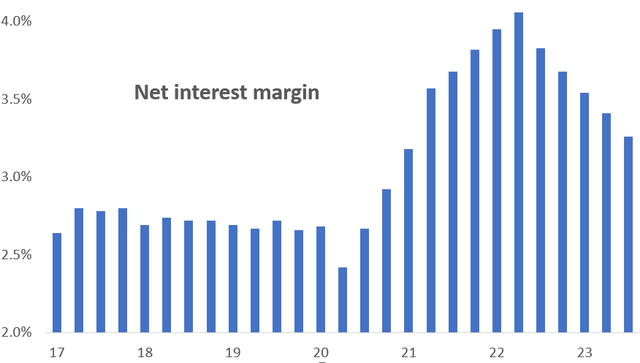
Here is a history of Ally’s net interest margin (NIM):
Sources: Ally financial statements
The chart shows that Ally’s NIM pre-COVID averaged 2.7%. It then surged to 4.0%, benefitting from the Federal Reserve’s dramatic rate cuts after COVID hit. The NIM then fell to 3.2% this past Q4 as fed funds rose past 5%. One would expect a return to the pre-COVID normalcy of 2.7%. Management is much more optimistic, according to this quote from the Q4 earnings call:
“We see a clear path to a 4% net interest margin…”
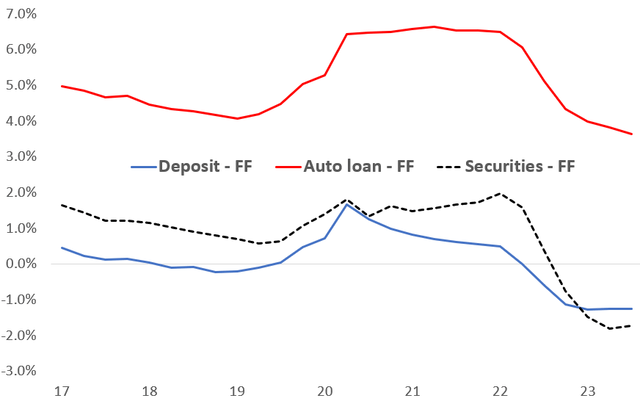
How is that possible? I again start with math. These three factors explain a full 97% of the variance in Ally’s NIM since 2017:
- The retail car loan yield
- The securities portfolio yield
- The deposit cost
Here is a history of all three, compared to the fed funds rate:
Sources: Ally financial statements
I’ll forecast each NIM factor assuming that fed funds averages 4% in 2025 (based on the forward fed funds curve).
Deposit costs minus fed funds. Ally’s Q4 deposit cost of 4.0% should rise modestly this year, based on its current money market rate offering of 4.4%. If fed funds drifts down to the expected 4.0%, so should Ally’s deposit funding costs. I expect flat deposit to fed funds in ’25.
Securities yield minus fed funds. Ally’s securities portfolio is largely fixed rate mortgage-backed securities, which the company is letting run down. Its average yield of 3.7% during Q4 ’23 should rise modestly going forward, reaching about 4.0% next year. Again, I assume flat to the fed funds rate.
Retail car loan yield minus fed funds. The current yield of this portfolio is 9.0%, and Ally is currently making new car loans at about a 10.7% yield, up nearly 2.5 percentage points from a year ago. Management believes that car lending competition has eased, which has improved Ally’s pricing flexibility. In sum, I expect Ally’s car loan portfolio to rise to a 9.7% yield in ’25, or 5.7 percentage points greater than fed funds.
Finally, a factor not captured in my math model is Ally’s planned asset mix shift that it described on its Q4 earnings call:
“Looking forward, we expect earning assets to be generally flat but with favorable mix dynamics as lower yielding mortgage and securities are running off and being replaced by higher returning retail auto, corporate finance and credit card assets.”
Net/net, despite my reasonably optimistic forecasts for the NIM factors, I don’t quite reach a 4.0% NIM for next year; more like 3.6-3.7%.
My earnings model therefore gives me a $5.50 EPS estimate for ‘25.
That’s about where Wall Street is, as I noted above. I don’t believe that’s not enough to get the stock to $50 over the next year. But we’re close – wait for a dip below $35.
