onurdongel
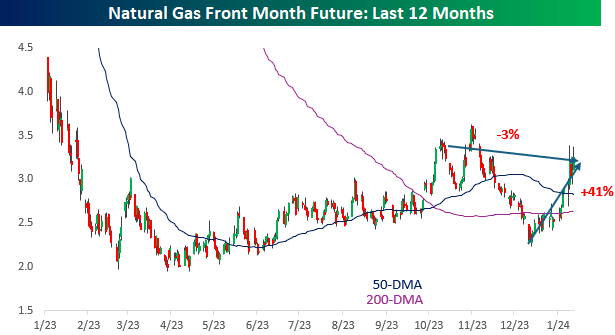
Even for a commodity like natural gas, the last three months have been incredibly volatile.
Think about this; over the last month, front-month natural gas futures are up over 40%, but over the last three months, they’re actually down.
A 40% rally and it’s still in the red over the last three months. Incredible.
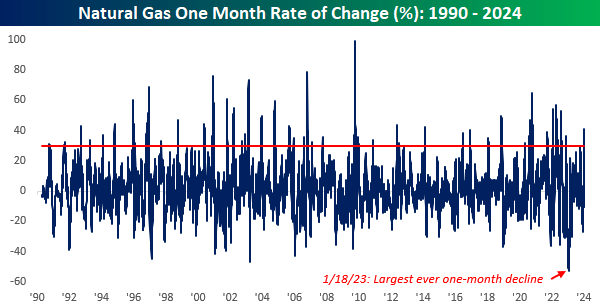
Below we show the one-month rate of change in natural gas over time, and anything over the red line indicates a rally of more than 30%.
While there have been plenty of other periods where natural gas rallied a lot more than it has over the last month, the recent move ranks as the largest since late 2022.
It’s also a far cry from where the market was a year ago, when the commodity was in the middle of its largest ever one-month decline (-52.4%).
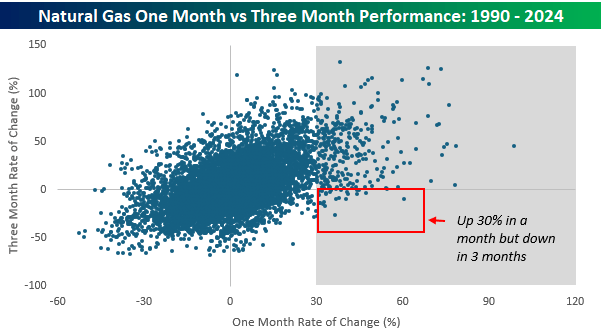
The scatter chart below compares rolling one-month moves in natural gas to rolling three-month returns.
As you would expect, the relationship is positively correlated – if natural gas is up over the last three months, it’s probably also up over the last month and vice versa.
That’s what makes the current performance stick out so much. In the chart below, we have drawn a red box around all the different occurrences where nat gas rallied at least 30% in a month but was down over the prior three months, and there weren’t many.
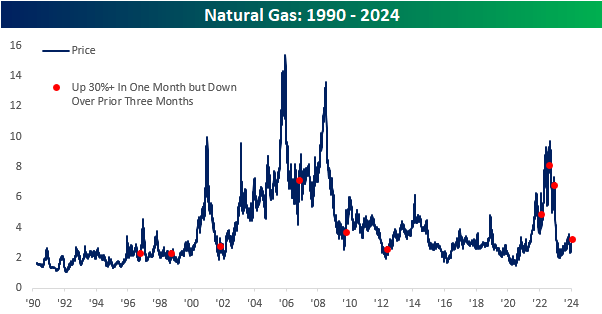
In the long-term chart of natural gas below, we have included red dots for each of those occurrences when it was up at least 30% in the prior month but down over the prior three months.
While there were sporadic occurrences from the late 1990s through 2012, there was nearly a ten-year lull from May 2012 up until 2022 at which point there have been several additional occurrences.
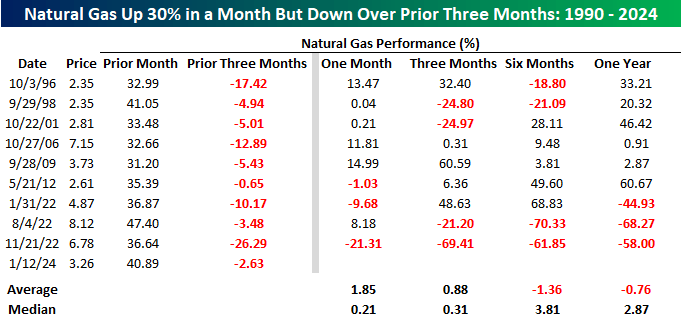
In terms of performance following these periods of extreme divergences between one and three-month returns in natural gas, overall, there hasn’t been much of a clear trend.
Before the three most recent occurrences since the start of 2022, the commodity’s performance was generally positive going forward. In the three most recent occurrences, though, natural gas experienced declines of over 40% each time.
Just to illustrate once again how volatile natural gas is, check out the performance following the January 2022 occurrence.
While natural gas was up nearly 70% after six months, a year later it was down 44.9% for an overall performance shift of over 110 percentage points!
Editor’s Note: The summary bullets for this article were chosen by Seeking Alpha editors.


