
jzabloski
Summary
Seeking Alpha Quant rates iShares MSCI USA Momentum Factor ETF (BATS:MTUM) as a buy. MTUM has performed very well during this stock market rally and is expected to continue outperforming for at least another year. I agree with the Seeking Alpha Quant and rate MTUM as a buy.
MTUM iShares MSCI USA Momentum Factor ETF
Fund Profile
iShares Trust – iShares MSCI USA Momentum Factor ETF is an exchange traded fund launched by BlackRock, Inc. It is managed by BlackRock Fund Advisors. The fund invests in public equity markets of the United States. The fund invests in stocks of companies operating across diversified sectors. The fund invests in momentum stocks of companies across diversified market capitalization. It seeks to track the performance of the MSCI USA Momentum SR Variant Index, by using representative sampling technique. iShares Trust – iShares MSCI USA Momentum Factor ETF was formed on April 16, 2013.
Fund Details
Fund Type Sector Equity
Issuer iShares
Inception 04/16/2013
Expense Ratio 0.15%
AUM $9.12B
Top 10 Holdings
Broadcom Inc (AVGO) 5.80%
NVIDIA Corp (NVDA) 5.50%
Meta Platforms Inc Class A (META) 5.20%
Eli Lilly and Co (LLY) 4.72%
Microsoft Corp (MSFT) 4.77%
Amazon.com Inc (AMZN) 4.72%
Adobe Inc (ADBE) 4.23%
Advanced Micro Devices Inc (AMD) 3.00%
Alphabet Inc Class A (GOOG) 2.57%
Netflix Inc (NFLX) 2.59%
Total 43.11%
# of Holdings127
*Holdings as of 2024-01-25
Investment Thesis
I rate MTUM as a BUY.
There are a number of factors that support the thesis.
On the fundamental side, the market expectation of the Fed starting to cut interest rates in 2024 has created favorable conditions for a sustained market rally. Lower interest rates will lead to improved earnings and increased stock prices. MTUM invests in selected, most profitable companies of the MSCI USA Index. Those companies are well positioned to maintain their high profitability in 2024.
On the technical side, MTUM has been in a strong uptrend since October 27, 2023. It has been one of the strongest performers during the latest market rally, over the past three months. After a long period of underperformance relative to the broad market, MTUM turned around in July 2023 and started increasingly outperforming. We think that the relative strength of MTUM versus S&P 500 will increase at least for another year.
Analysis.
Currently, MTUM’s price is above its 50 and 200-days moving averages. Both the 50-day and the 200-day MAs are sloping upwards since December 2023.
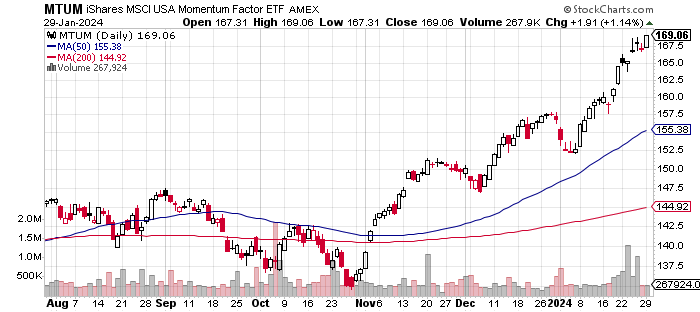
stockcharts.com
MTUM has stronger momentum than the broad market ETF SPY. See the chart below. Returns from 10/27/2023 to 1/29/2024: MTUM (25.16%), SPY (20.11%)
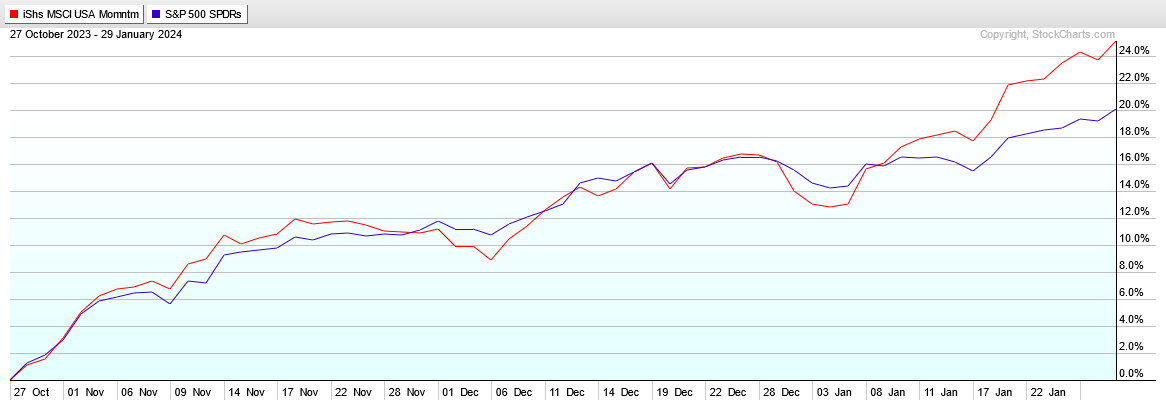
stockcharts.com
The relative strength of MTUM vs SPY has declined for about two and a half years, until July 2023. Since then, the relative strength of MTUM started increasing.
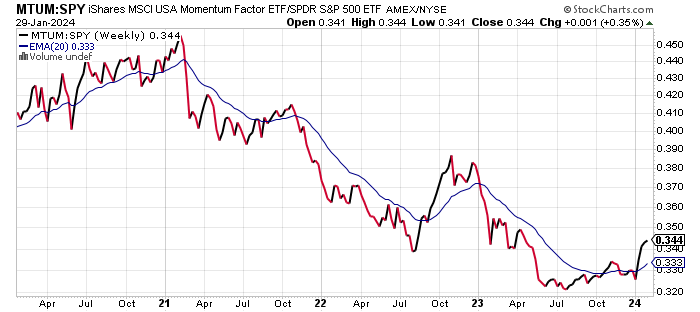
stockcharts.com
The top ten holdings of MTUM are some of the most profitable large cap companies. Nine out of 10 hold the highest profitability rating of A+ by the SA Quant. Only Advanced Micro Devices has a profitability rating of B+.
The performance of all top ten holdings has been stellar over the most recent three months.
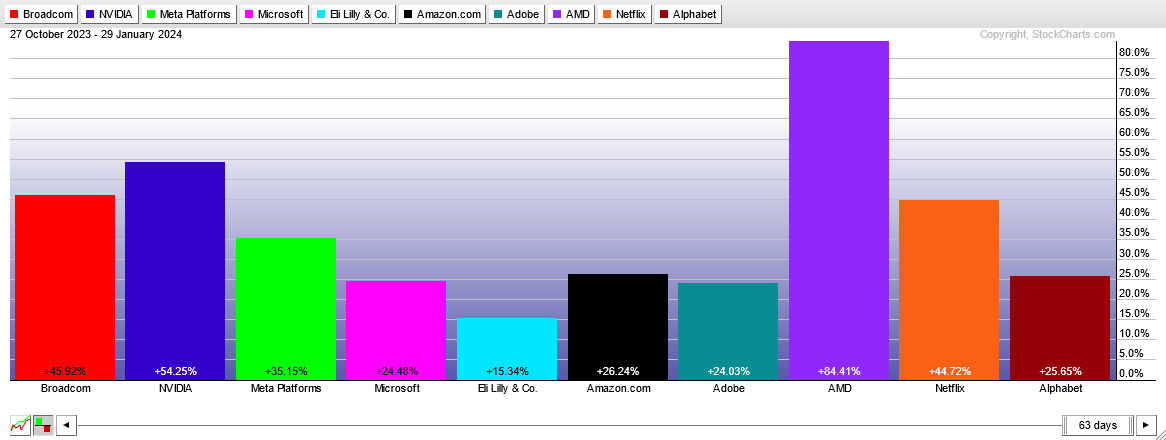
stockcharts.com
Their 3-month returns range from 15.32% (LLY) to 84.41% (AMD). Over the same interval, MTUM returned 25.16%. All top ten holdings are, currently, in a sustained uptrend.
MTUM Long-Term Underperformance
MTUM tends to outperform during strong market uptrends. But, it also underperforms heavily during market sell-offs. Overall, in aggregate, MTUM lags the broad US market as represented by S&P 500.
The chart below shows the total returns since the MTUM inception.

stockcharts.com
Returns from 18 April 2013 to 29 January 2024: MTUM (280.42%), SPY (287.86%)
Market State
To determine the state of the market we compute the difference in total returns of the following four ETF pairs: (DBB, UUP), (XLI, XLU), (SLV, GLD) and (XLC, XLV) over an evaluation period. The evaluation period is variable. It is a function of market volatility.
Currently the evaluation period is 79 trading days and three of the four pairs indicate risk-on. Only one pair (SLV, GLD) indicate risk-off.
The market state is supportive of a continuation of the rally. The prevailing market expectations are for the FED to stop raising interest rates and start cutting rates by the summer of 2024. Declining interest rates are very beneficial for the broad market and the technology stocks.
Risks
The current market rally may stumble for many reasons. During any market selloff, the high momentum stocks are penalized more heavily than the broad market.
The holdings of MTUM have lofty valuations at this time. In fact, all ten top holdings have a SA Quant “Valuation” of D to F. If the broad market enters a correction period, the MTUM holdings are likely to suffer heavy losses.
The BUY rating of MTUM applies for as long as the broad market is in risk-on mode. Alternatively, we watch that MTUM price stays above the 50-day moving average.
Conclusion
I rate MTUM as a BUY for the following reasons:
The broad market is in risk-on mode. MTUM has a strong momentum and is outperforming the broad market during the current rally. The top holdings of MTUM are highly profitable and are expected to continue to be so, over the long term. Seeking Alpha Quant has a high BUY rating of MTUM (4.31/5).

 Q2 2024 Earnings Call Transcript")

