J Studios
Introduction
I have often found that high-quality stocks, despite appearing expensive relative to peers of lower quality, nevertheless keep outperforming by a significant margin. In this context, while evaluating a gold miner, high quality can relate to many different aspects. For example, the asset itself could be superior, because of its overall size, the safety of the jurisdiction, or its higher grades, lower costs, and thus higher margins. Arguably, however, the most important variable in my evaluation framework is the management team. A superior management team shows a consistent track record of underpromising and overdelivering. Guidance is routinely met or beat. Communication is transparent. Strategy is clearly set. Focus is put on shareholder returns and value creation. The management team often holds a significant stake in the company, so incentives are aligned. There is no history of dilution under unfavorable conditions, or a blow-up in production costs.
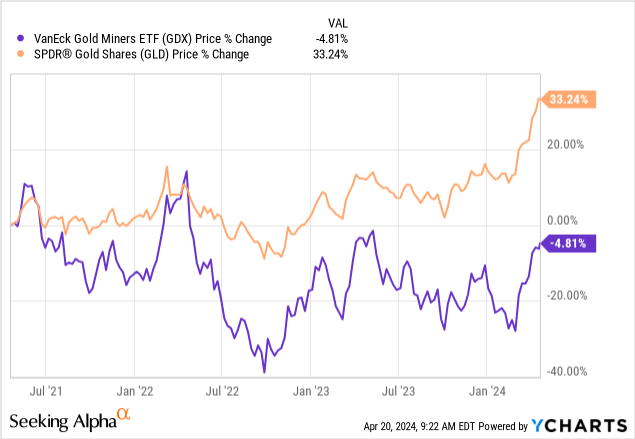
This last fact is especially important, given the trend of production costs rising faster than gold prices over the last few years, which partly explains the current historic divergence between gold prices and gold miners. As the following picture shows, the VanEck Gold Miners index (GDX) has lost almost 5% over the last 3 years, while gold prices have rallied by more than 33%. This divergence creates opportunities.
While in aggregate, gold miners have been value destroyers, there are many hidden gems. Such companies trade at a cheap valuation, because of their correlation with the overall sector. Sometimes, they even trade at a discount because of factors like jurisdictional risk or being single-asset. At the same time, they produce some of the highest free cash flow yields available in the overall stock market. Currently, these hidden gems can mostly be found in the group of intermediate gold producers, often in non Tier-1 jurisdictions, and Lundin Gold (OTCQX:LUGDF) is one of them.
Why quality matters
Quality is, ceteris paribus, one of the best predictors of future returns. For example, given two miners with roughly the same reserve bases, the one of superior quality is likely to outperform, both in bear and bull markets. In bear markets, the superior miner is more likely to be able to control costs and thus preserve margins, offering downside protection. In bull markets, while lower-quality names may temporarily outperform higher-quality names because of their higher leverage, higher-quality names are still able to outperform in the long term because of their superior capital allocation strategy.
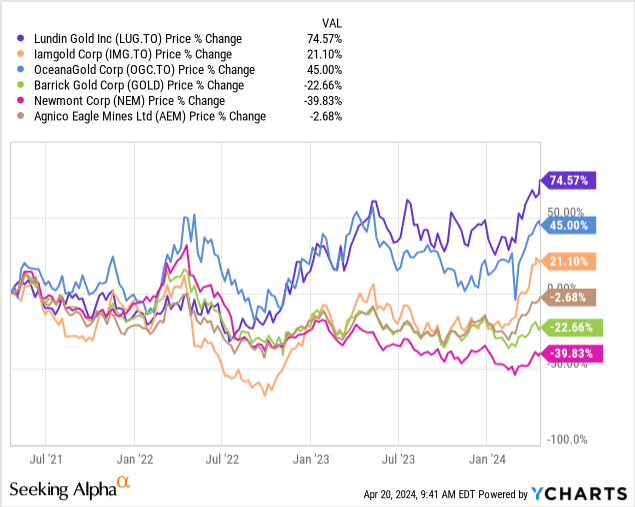
Over the last 3 years, while gold majors are roughly flat (i.e., Agnico Eagle) or have lost a considerable fraction of their market capitalization (i.e., Barrick, Newmont), some selected miners have managed to achieve significantly better returns, outperforming by a large margin both their peers and the metal.
Lundin Gold is clearly in this group. In this article, I will argue that Lundin Gold possesses all the markings of a superior gold mining stock. More importantly, despite looking expensive, I will argue it is actually not so expensive, all things considered, and likely to continue outperforming in the future.
Gold miners: trading sardines vs. compounders
Gold mining is a very difficult business. In appearance, this sector currently offers excellent margins: a gold price of $2400 and an industry-average AISC of $1400 per ounce imply a $1000 per ounce margin. However, the picture is far more nuanced. Even at the record prices of the last three years, many miners have not been able to create substantial value. The reasons are manifold. AISC is a somewhat misleading metric that does not include all real expenses, such as interest payments, exploration costs, and administrative costs. A gold miner is constantly faced with the challenge of replenishing its reserve base, and while sustaining costs should be accounted for in the computation of AISC, this is not always done transparently. Inflationary pressure can squeeze profit margins and cause a blowout in capital expenditures.
As a result, some investors treat gold stocks simply as derivatives on the gold price. If this were true, gold stocks could not be more than trading sardines. They could not be treated as long-term investments. I do not agree with this view. While it is true that gold companies offer leveraged exposure to gold prices, this is not the whole picture. Some, admittedly very rare, gold companies can be treated as long-term investments. This is proven by the fact that some stocks have an incredible track record of value creation. Invariably, such companies are also the ones that exhibit the characteristics of quality discussed before. I therefore believe that investors should treat gold miners not as gold derivatives but as normal companies. In which case, metrics such as free cash flow yield should be paramount to establishing value.
Why is Lundin Gold a high-quality gold miner?
Lundin’s single asset is the world-class Fruta del Norte mine, located in southeast Ecuador. Fruta del Norte is one of the highest-grade, lowest-cost gold mines in the world. In the following table, I have collected the reserve grade and overall contained gold for comparable peers. As it can be seen, Fruta del Norte ranks very competitively; it is the second largest one in terms of contained gold.
| Operating Mine | Owner | Reserve Tonnes (kt) | Reserve Grade (g/t) | Contained Gold (koz) |
| Fruta del Norte | Lundin Gold | 21,700 | 7.9 | 5,500 |
| Macassa | Agnico Eagle | 5,067 | 13.1 | 2,136 |
| Segovia | Aris Mining | 3,531 | 11.6 | 1,320 |
| Island | Alamos Gold | 5,210 | 10.3 | 1,725 |
| Obuasi | Anglo Gold Ashanti | 22,830 | 9.7 | 7,110 |
| Mponeng | Harmony | 6,000 | 9.2 | 1,779 |
| Pogo | Northern Star | 5,867 | 8.6 | 1,618 |
| Bruceiack | Newmont | 14,000 | 8.4 | 3,700 |
| Driefontein | Sibanye Stillwater | 11,600 | 7.9 | 2,900 |
| Mayskoye | Polymetal | 8,576 | 7.0 | 1,753 |
| Red Lake | Evolution | 7,740 | 6.9 | 2,748 |
| Fosterville | Agnico Eagle | 12,400 | 6.1 | 1,682 |
In addition to owning a unique asset, Lundin Gold can also count on one of the most experienced and skilled management teams in the sector. Evidence is provided by the consistent track record of surpassing guidance and delivering on projects ahead of schedule and under budget.
Phase 2 Expansion Project set to increase throughput and improve recoveries
In the near future, the company aims to sustain production of around 500,000 ounces per year. This is only marginally up compared to production of 480,000 ounces in FY 2023. However, two considerations should be made in this regard.
The first is that production is likely to surprise to the upside, as the company has a history of beating its own guidance. For example, in 2023, the company had to revise its guidance upwards and still ended up very close to the upper range of the revised guidance range of 450,000 to 485,000 ounces.
The second consideration is that costs are coming down. AISC was around $860 per ounce in 2023. It should remain roughly stable in 2024 (guidance between $820 and $890 per ounce). After a modest increase in 2025 (guidance between $840 and $910 per ounce), due to higher sustaining capital expenses, AISC will decline to the range of $780 and $850 per ounce going forward.
Company’s Presentation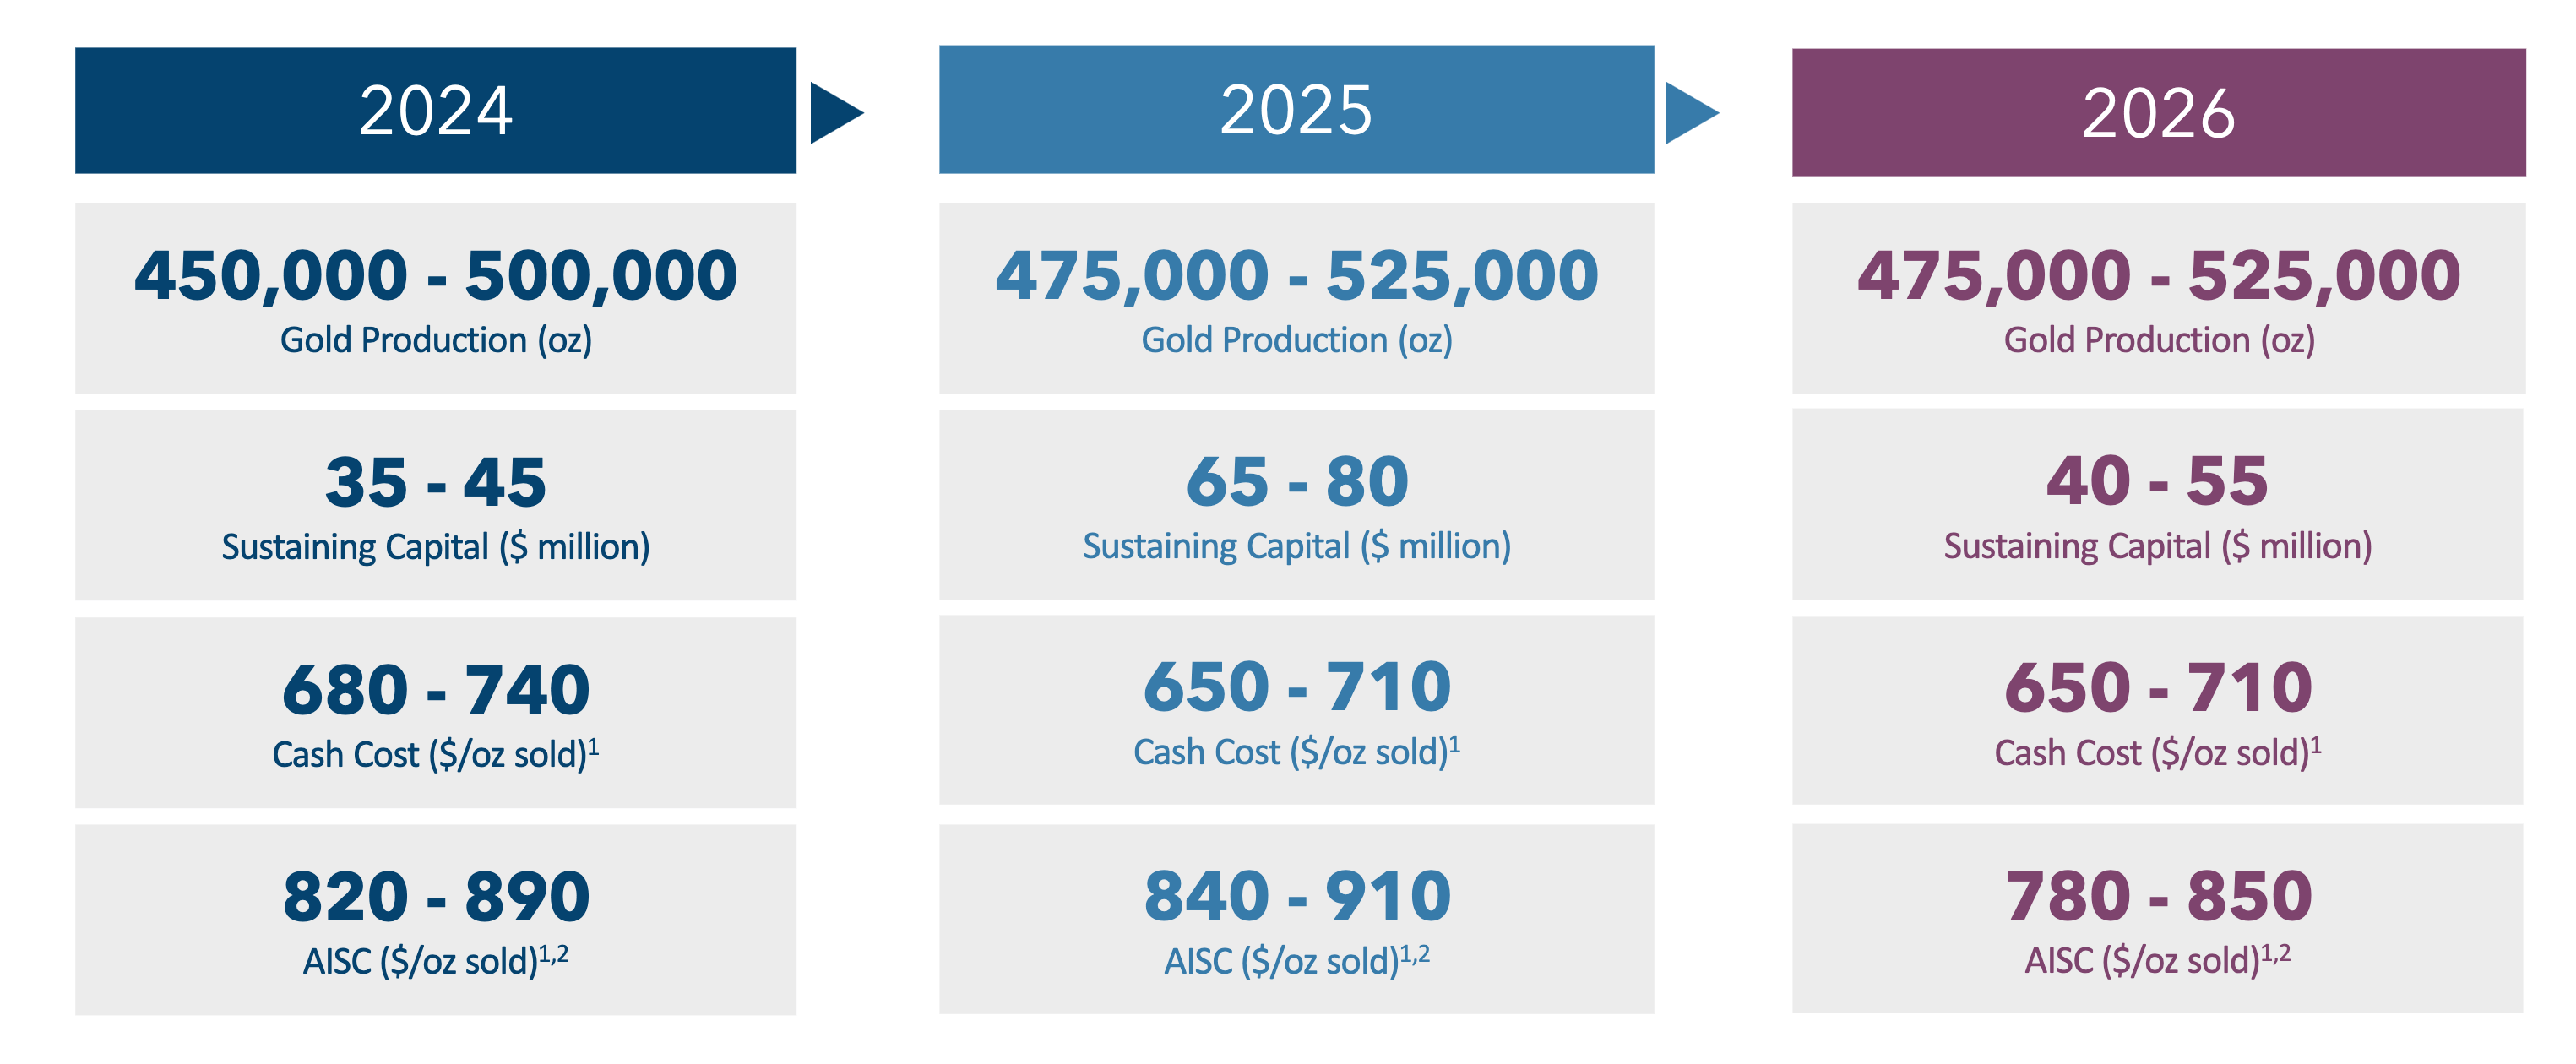
This increase in production and decrease in costs are the results of its ongoing Phase 2 expansion project. The project is expected to increase throughput to 5,000 metric tons per day by 2024 (up 17% from the current throughput of 4,500 metric tons per day). In addition, the company plans to add three Jameson cells, which should increase recovery by about 3%, from 89% to 91%, starting in 2025.
The project is relatively small, costing in total only $36 million, but it is also emblematic of the capacity of the management to invest in high-return initiatives. The Phase 2 expansion is expected to add around 15,000 ounces per year, or around $15-20 million in free cash flow per year. It therefore has a payback period of about 2 years.
Company’s Presentation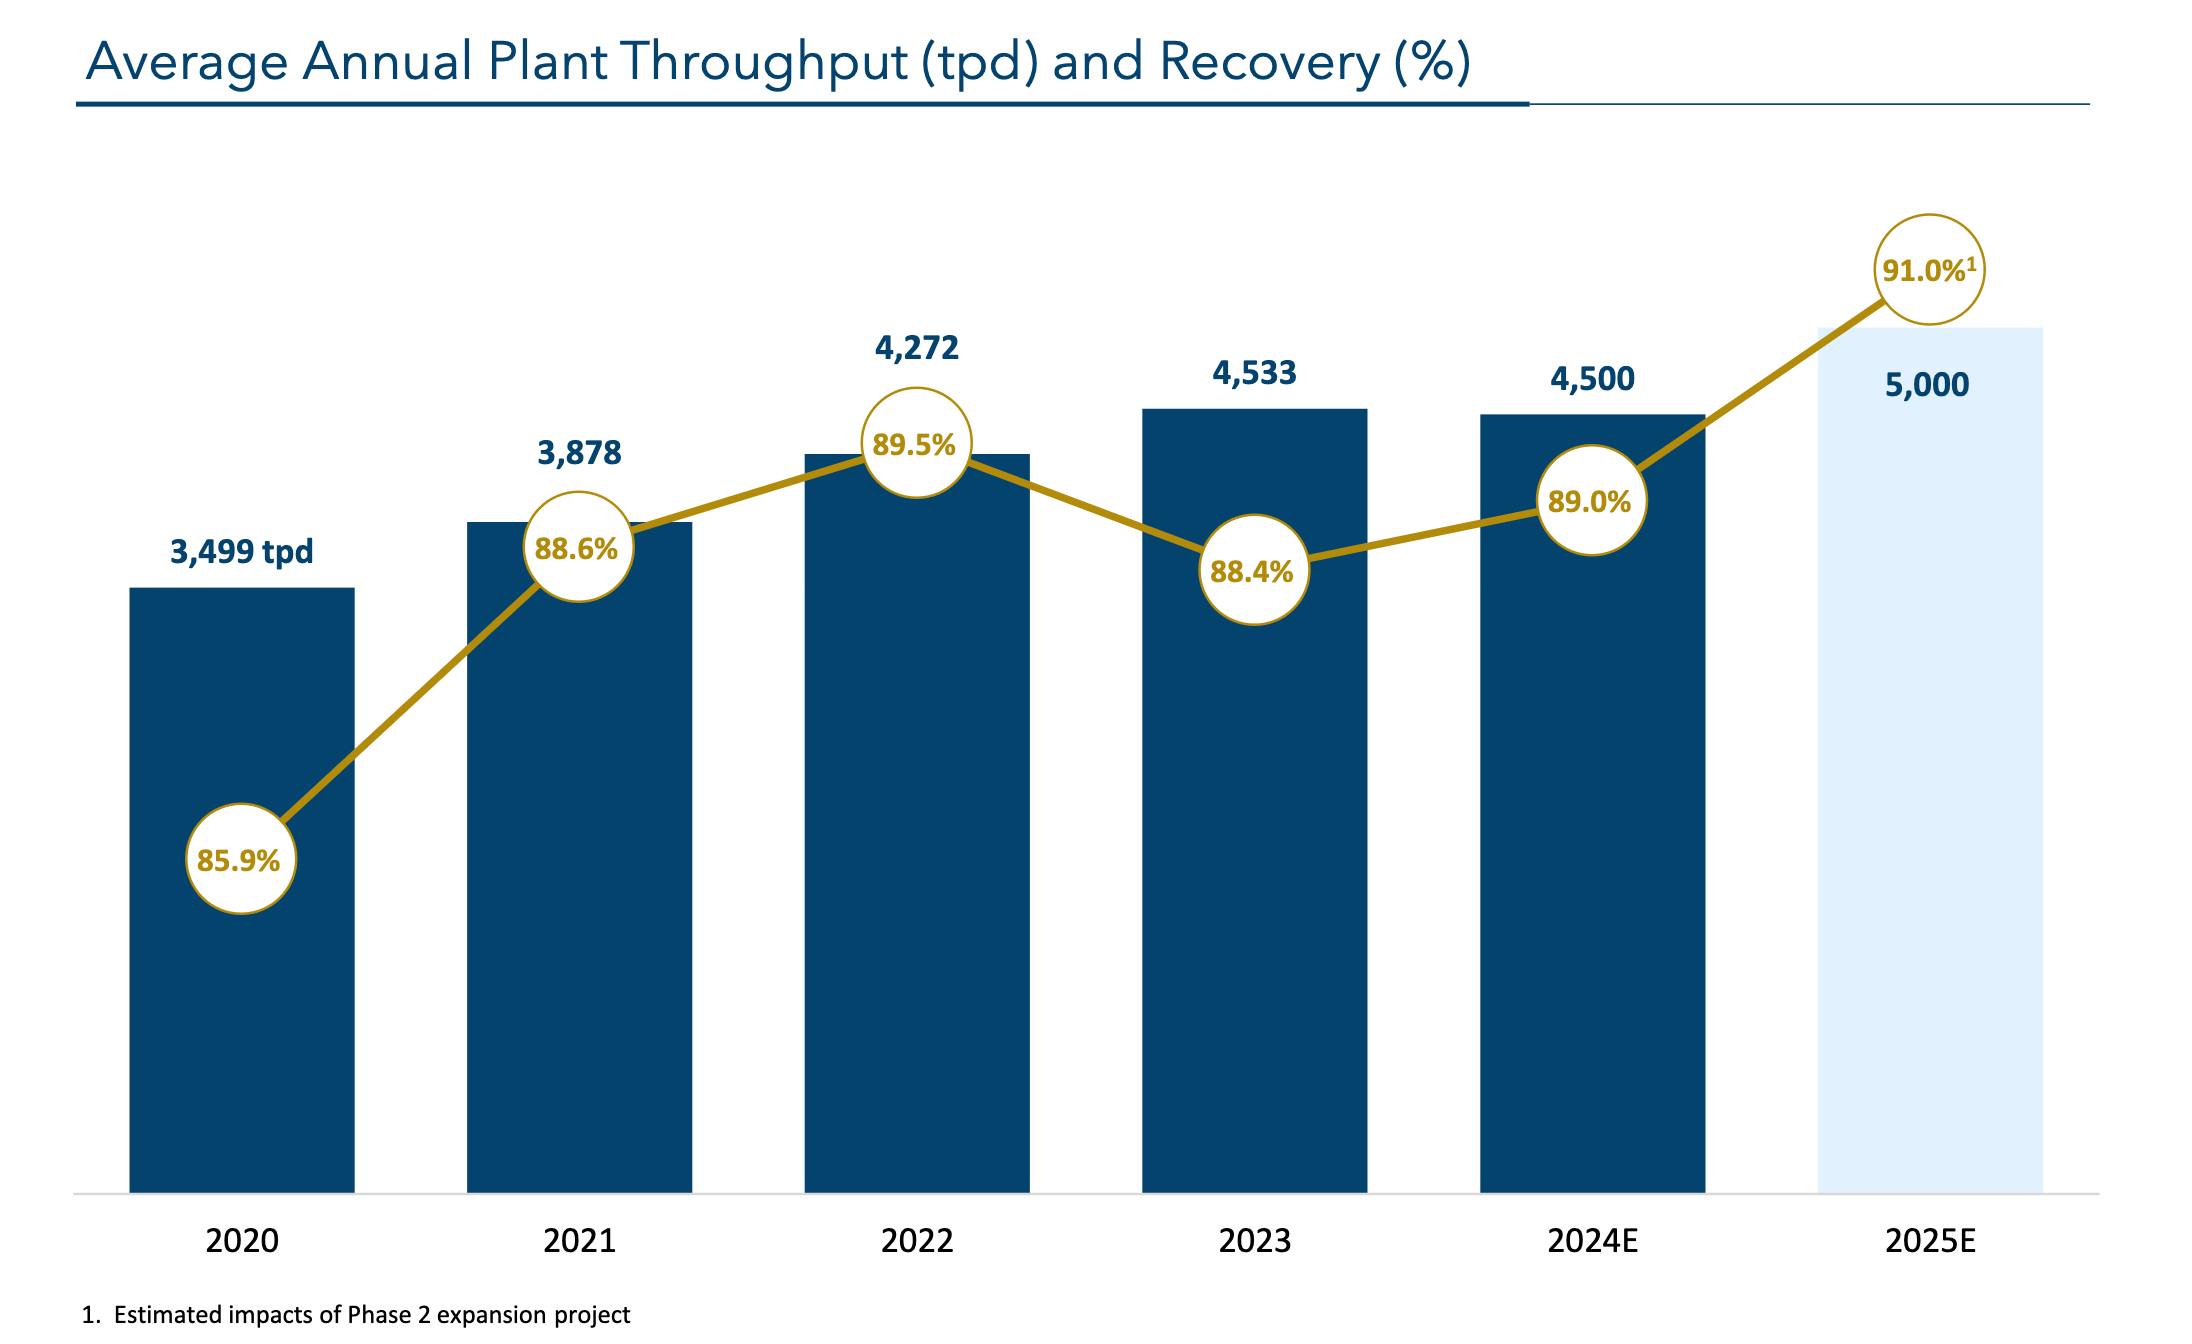
Mineral reserve base recently increased to 5.5 million ounces
Lundin Gold has recently reported its updated estimates of Mineral Reserves and Mineral Resources for Fruta del Norte. At the beginning of 2023, Mineral Reserves were standing at around 5 million ounces. In the course of 2023, the company was able to fully compensate for production of 480,000 ounces, by adding 580,000 new ounces via modifications to the mine design and some changes to technical parameters, plus an additional 380,000 ounces via successful conversion drilling. At the beginning of 2024, the company was therefore boasting a reserve base of 5.5 million ounces. On top of this, Lundin Gold also managed to increase its Measured and Indicated Resources, which are now expected to contain around 7 million ounces of gold at a leading grade of 9.24 g/t.
Free cash flow generation is significant and will pick up from 2026
Some gold miners struggle with free cash flow generation. But most gold miners have AISC in the range of $1200-1400 per ounce. On the other hand, Lundin Gold enjoys far lower costs and, therefore, some of the highest margins in the sector. This makes the company a real free cash flow machine.
Looking back at FY 2023, when the realized gold price was $1958 per ounce and AISC came in at $860 per ounce, the company was able to generate (adjusted) free cash flow of $392 million (I added back $129 million used for the repayment of its gold prepay facility). This compares well with a market capitalization of $3.5 billion.
In 2024, assuming 4% higher production, similar costs, and a higher realized gold price of $2300 per ounce, Lundin Gold should be able to generate around $580 million in free cash flow. Most likely, $150 million will be used to repay 50% of its stream facility with Newmont in June 2024 (Lundin also has the option to buy back the remaining 50% for $225 million in June 2026). The rest will be available to finance organic growth initiatives, potential acquisitions, shareholder returns, or will be added back to the pile of $268 million in cash and cash equivalents the company has already accumulated.
The company will fully benefit from its Phase 2 expansion starting in 2025. Free cash flow generation will peak in 2026 when sustaining capital expenditures will decrease. Assuming an AISC of around $815 per ounce, Lundin Gold should be able to generate more than $600 million in annual free cash flow.
Valuation
Compared to most other comparable gold miners, Lundin Gold appears quite expensive.
| LUG | OCANF | TORXF | NESRF | |
| Price / Cash Flow (TTM) | 6,75 | 4,29 | 4,24 | 9,74 |
| EV / EBITDA (TTM) | 6,72 | 4,44 | 2,7 | 7,94 |
| Price / Book | 3,65 | 0,95 | 0,85 | 1,97 |
| Dividend Yield | 2.73% | 0.87% | – | 2.06% |
However, the company remains very reasonably priced in absolute terms. With a market capitalization of $3.5 billion, assuming an average realized gold price of $2300 per ounce, I estimate that Lundin Gold is trading at a forward 16.5% free cash flow yield. The following table provides a sensitivity analysis with varying assumptions about the realized gold price, AISC, and production of 500,000 gold ounces.
| Realized gold price ($) | AISC ($) |
Free cash flow yield |
| 2000 | 800 | 13,4% |
| 2000 | 860 | 12,3% |
| 2000 | 900 | 11,5% |
| 2300 | 800 | 17,7% |
| 2300 | 860 | 16,6% |
| 2300 | 900 | 15,8% |
| 2500 | 800 | 20,5% |
| 2500 | 860 | 19,4% |
| 2500 | 900 | 18,7% |
| 3000 | 800 | 27,7% |
| 3000 | 860 | 26,6% |
| 3000 | 900 | 25,8% |
Shares may seem expensive, given the strong performance last year and the fact that they are up a further 15% this year. But the gold price is also up around 14% year-to-date. Therefore, on a free cash flow yield basis, Lundin Gold is actually cheaper now than at the beginning of the year. In other words, the company has not kept up with gold prices. Which might mean that gold prices are not expected to remain at the current elevated levels. Irrespective of short-term noise, however, I believe gold is heading higher. Therefore, I see Lundin as currently undervalued.
Additionally, the company is also investing very aggressively in exploration, which provides optionality. It has recently announced the discovery of a new high-grade zone to the east of its FDN deposit, as part of its ambitious 2024 near-mine drilling program. Gold mineralization was found to be associated with significant levels of hydrothermal alteration, hosted in similar volcanic and intrusive rocks to those found at Fruta del Norte. The new discovery has already returned some good intercepts, such as drill holes UGE-E-24-094 (76.95 g/t Au over 5.0 m), FDNE-2023-064 (12.35 g/t Au over 6.4 m) and UGE-E-23-045 (15.11 g/t Au over 3.8 m), indicating a new, potentially high-grade system.
A cautious note on the jurisdiction
Admittedly, Ecuador does not qualify as a Tier-1 jurisdiction. Earlier this year, several cities saw an increase in criminal activity, particularly in Guayaquil. In response, President Noboa, who has been in office since November 2023, declared a state of emergency. These measures have been effective, and the situation in Ecuador appears to be under control. The company has stressed that at Fruta del Norte operations remain unaffected. While the Lundins have proved extremely adept at navigating challenging political environments, still it should be noted that the company remains exposed to political risk, especially given the fact that it is a single-asset producer. This fact is likely weighing on the current valuation, and the discount is unlikely to go away in the near future.
Conclusions
In this article, I have argued that Lundin Gold offers some of the best risk-adjusted returns among gold miners. Investors may be inclined to buy lower-quality, cheaper names, hoping for greater returns in a bull market. However, in my experience, it is very hard to trade such miners. I feel much more confident in my ability to identify high-quality miners that can be treated as long-term investments. I also believe that most investors would be better served by following such a simple strategy.
Gold is in a secular bull market for structural reasons that I have discussed in a separate article, and high-quality miners will vastly outperform gold. Lundin Gold can count on superior management and an excellent asset, with some of the lowest costs in the sector, 10+ years of reserves, and significant optionality. It trades at a very reasonable valuation, offering a 15-20% free cash flow yield based on current gold prices. I see it, therefore, as a core holding within a diversified gold portfolio.
Editor’s Note: This article discusses one or more securities that do not trade on a major U.S. exchange. Please be aware of the risks associated with these stocks.

 Q2 2024 Earnings Call Transcript")

