Kameleon007
While there are some telltale signs of an impending domestic recession (weak LEIs, an inverted yield curve, negative M2 money supply growth at times), credit spreads suggest there’s no cause for concern. Both the investment grade and high yield spreads are at incredibly tame levels. Goldman Sachs sees the IG spread ending 2024 about where it is now – under 100 basis points over comparable-term Treasuries.
I reiterate my buy rating on the iShares iBoxx $ Investment Grade Corporate Bond ETF (NYSEARCA:LQD). It’s a low-cost index fund that currently sports an attractive yield. While some investors may prefer to wait for spreads to blow out before buying, I assert that simply owning higher-returning equities in such instances is the right approach. For now, with the S&P 500 priced at more than 20 times earnings, having some fixed-income exposure is warranted.
Both IG And HY Credit Near Cycle Tights
Goldman Sachs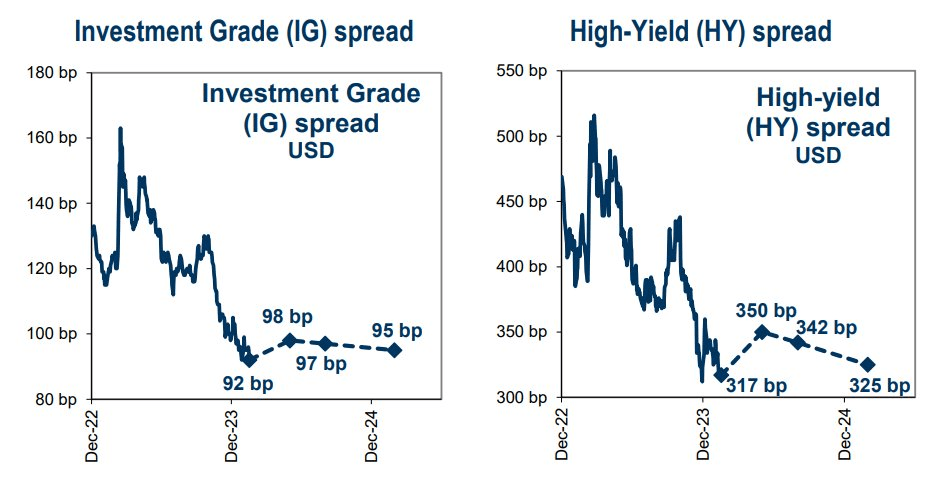
According to the issuer, LQD offers investors exposure to a broad range of U.S. investment grade corporate bonds and access to more than one thousand high-quality corporates in a single fund. LQD seeks to track the investment results of an index composed of U.S. dollar-denominated, investment grade corporate bonds.
Money has flowed out of LQD since I last reviewed the ETF. Total assets under management sum to just $32.4 billion as of February 23, 2024. Its low 0.14% annual expense ratio earns the fund an A ETF Grade by Seeking Alpha, though share-price momentum over the last few months has been lackluster given the steady rise in intermediate-term Treasury yields.
Still, LQD currently sports a yield to maturity of 5.38% – about what investors can earn in the very best money market mutual funds. Of course, if the Fed Funds futures market is correct, then ultra-safe short-term rates will drop about 80 basis points now through year-end. Thus, extending duration a bit would appear to be a solid portfolio move for fixed-income investors. Risk ratings are not all that impressive with LQD right now, and I concede that the positive correlation between equities and corporate credit is a risk. Still, LQD is a highly liquid ETF with an average daily trading volume of nearly 27 million shares.
What I like about LQD today compared to past years is that you can finally earn a real yield. With 10-year breakevens just shy of 2%, LQD holders should expect to outpace inflation by slightly more than three percentage points annually. In J.P. Morgan Asset Management’s Guide to the Markets, domestic bonds are to the cheap side versus history. While the earnings yield on US large-cap stocks is two percentage points better than LQD’s real yield, that gap does not favor stocks by a huge margin.
US Core Bonds Modestly Inexpensive Compared to History
J.P. Morgan Asset Management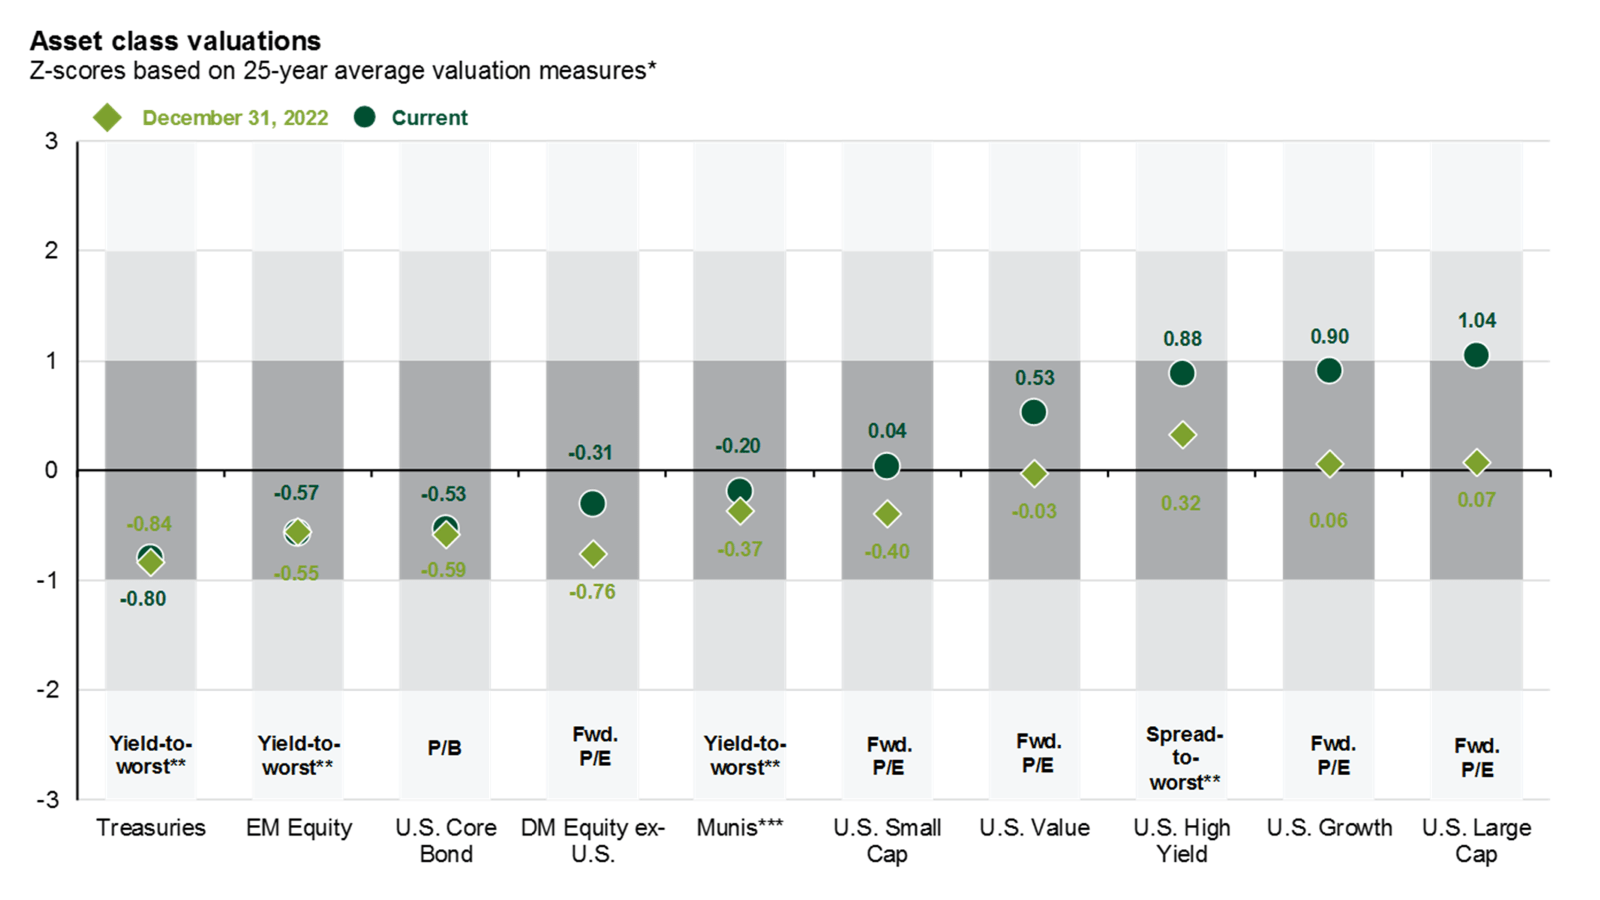
Of course, interest rate risk is a key consideration for prospective investors. LQD has significant exposure to corporate bonds with maturities of 20 years or longer. Overall, the effective duration is 8.3 years – meaning for every one percentage point rise in the yield curve, expect LQD to fall 8.3% in value.
LQD: Maturity Profile
iShares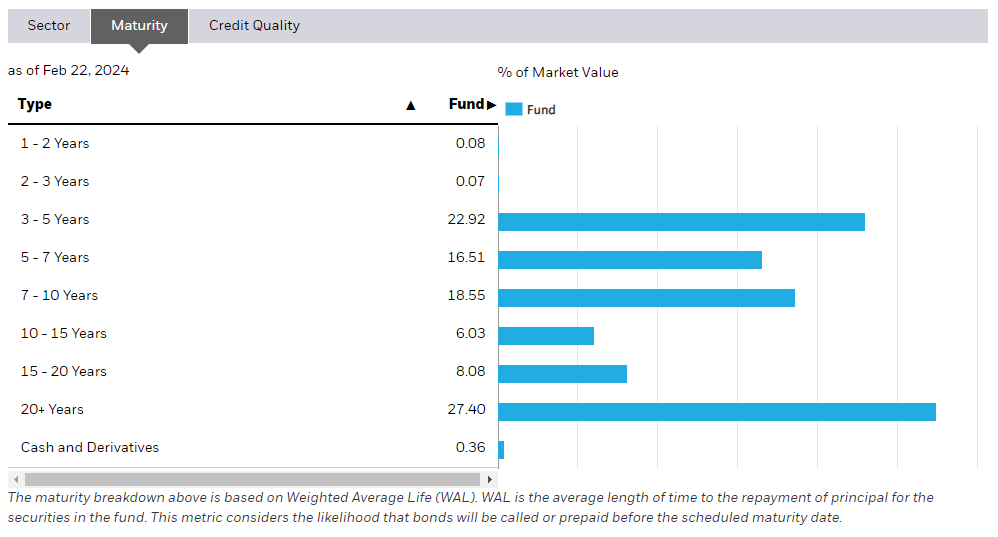
It is also critical to monitor developments in the banking industry. We were reminded of how sensitive the space is to both macro and micro shocks and trends back in March of last year. If we see a continued rise in the Treasury yield curve, then another round of regional banking turmoil could come about.
The good news is that banks, big and small, have now had the chance to shore up their assets and liabilities in this new higher-interest-rate era. What’s more, a one percentage point rise in rates today has significantly less impact than the same move a couple of years ago due to the effects of convexity.
LQD: Industry Exposure
iShares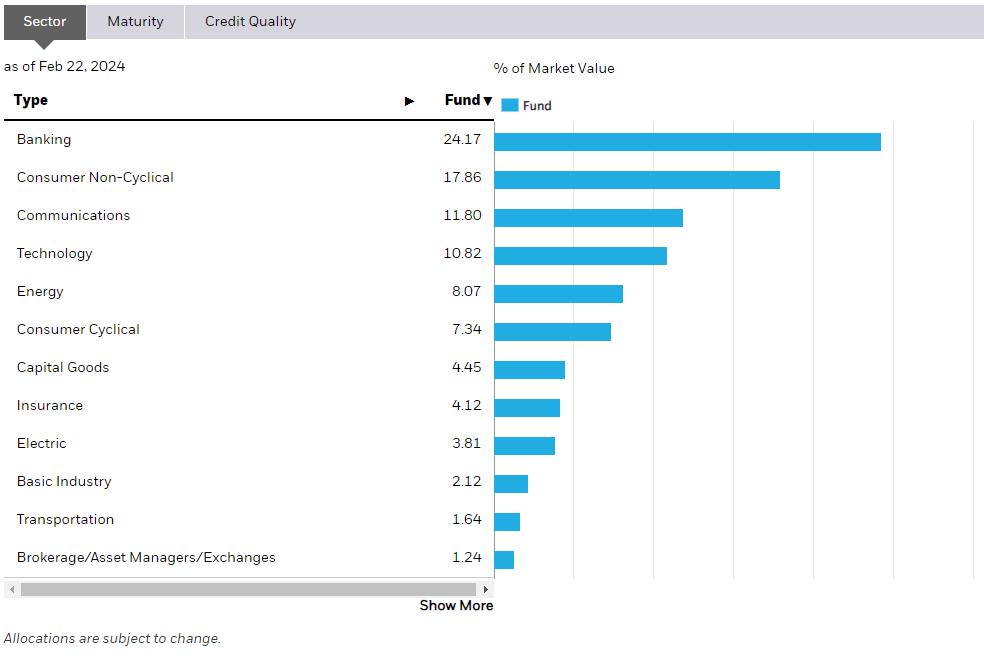
Seasonally, we are not out of the woods yet in terms of bearish price action trends. February through April, along with August through October, has been a weak period for LQD total returns over the last 10 years. The May through July stretch has been a more favorable timeframe, according to Seeking Alpha’s Seasonality tool.
LQD: Bearish Returns Through April, Historically Speaking
Seeking Alpha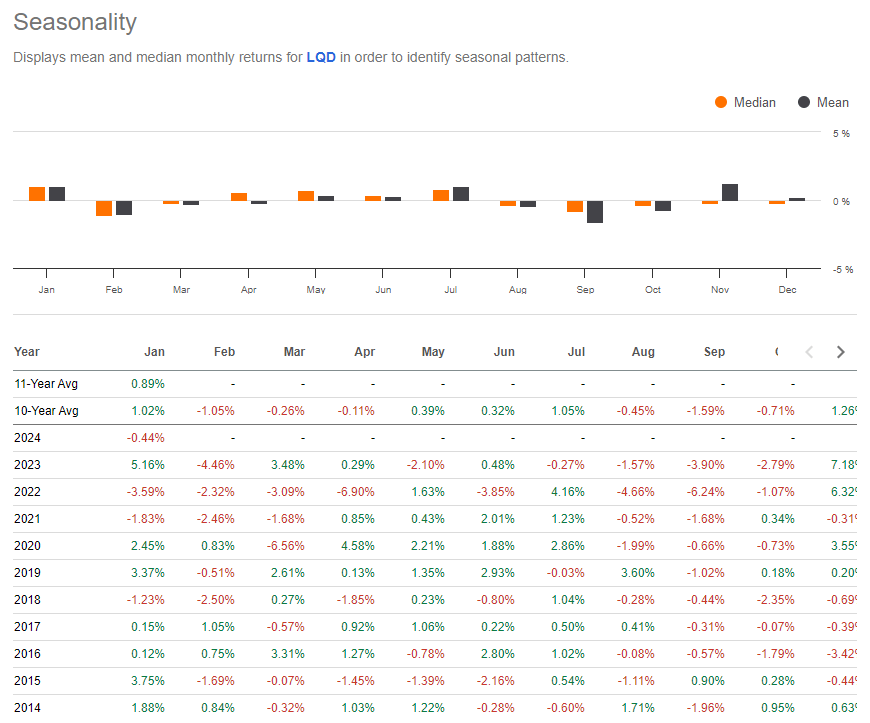
The Technical Take
LQD has stabilized after a major downtrend from the summer of 2021 through October of 2022. Notice in the chart below that shares are now rangebound with support just above the $98 mark and apparent resistance close to $112. So long as this $14 range holds, then it’s hard to get too excited or downbeat about the ETF. A bullish breakout above $112 could lead to a rally up to $126 based on the $14 range today.
But with a flat long-term 200-day moving average, the bulls are by no means in control yet. Moreover, the RSI momentum oscillator at the top of the graph has deteriorated lately as LQD backs away from resistance. Finally, with a high amount of volume by price down to about $105, there should be some cushion if shares retreat further.
Overall, the chart is not particularly bullish, but the downtrend has at least halted.
LQD: An Emerging Trading Range, $112 Resistance
Stockcharts.com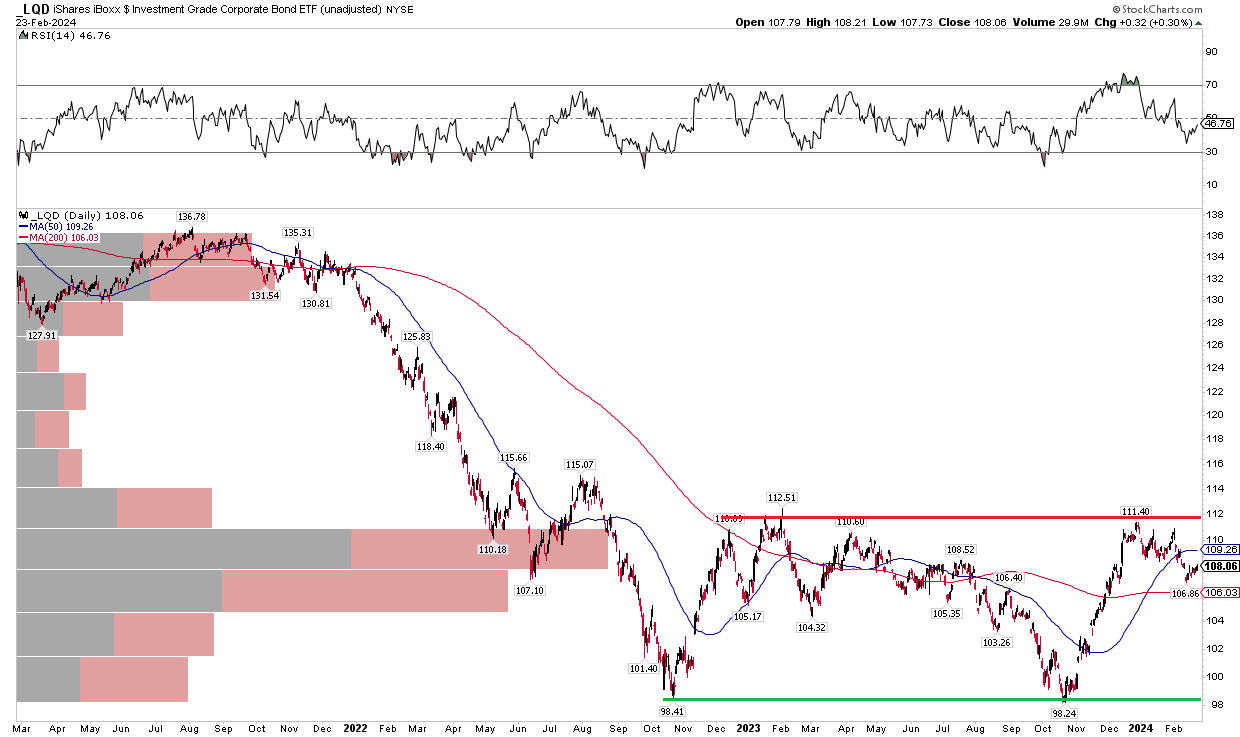
The Bottom Line
I reiterate my buy rating on LQD. With tight yield spreads persisting and the threat of lower interest rates due to Fed policy, owning some LQD along with shorter-term Treasuries or money market funds makes sense for fixed-income investors.

 Q2 2024 Earnings Call Transcript")

