stock_shoppe/iStock via Getty Images
The famous Buffet quote about the tide seems to be misunderstood by many investors, who believe one should always swim naked until the tide is about to go down.
Only when the tide goes out do you learn who has been swimming naked.” – Warren Buffet
With a lackluster start of the year for the stock market and historically high yield in the bond market, it is a good idea to check that our proverbial swimsuit fits well, not whether or not we should be wearing one.
To this end, the article will cover the basics of bonds, an overview of the US bond market, and why I am picking iShares® 0-3 Month Treasury Bond ETF (NYSEARCA:SGOV) and iShares 10-20 Year Treasury Bond ETF (NYSEARCA:TLH) as a tactical two-piece swimsuit for the turbulent waters that may be ahead.
Bonds
Bonds and stocks are usually combined in portfolios because their performance is not correlated well or, in some cases, is inversely correlated. Despite their results being inversely correlated, they are intertwined with each other and the economy.
How the bonds are played depends on the outlook of the yield curve, the perceived risk in the economy, the specific bond characteristics, and the investor’s needs.
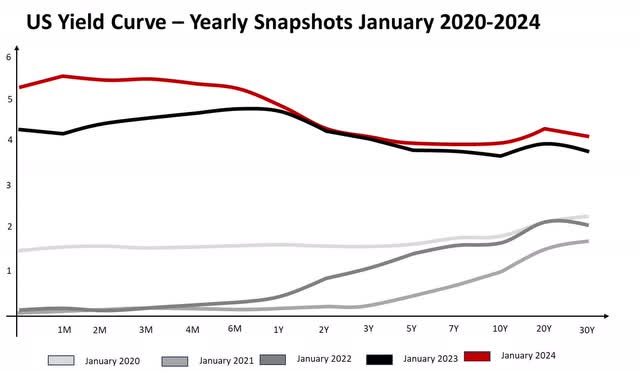
Typically, long-term bonds have a higher yield than short-term bonds, so the Yield Curve is steep, as investors want to be compensated for the lack of liquidity. When this is not the case, and the yield curve is inverted, it may indicate a recession is incoming or that unusual circumstances are at play in the economy, which is happening now.

US Yield Curve – Yearly Snapshots January 2020-2024 (Created by author with data from US Yields)
If the yield curve predicts a recession, government bonds will likely outperform a basket of corporate bonds as more businesses default on recession.
Leaving aside the question of whether or not the US economy will enter into a recession shortly, the inversion of the yield curve is an unusual condition unlikely to be maintained in the long term, as that would assume that investors prefer to have less liquidity in their assets than more liquidity.
So, in the short to mid-term, the yield curve will likely become steep or flat, which presents an opportunity. Bond prices rise when the yield goes down and fall when the yield goes up; however, the longer the duration of the bond is, the more its price will move with a shift of interest rates, all else equal.
Why SGOV and TLH?
For our proverbial swimsuit, we assume government bonds are preferable to corporate bonds as the corporate spread and defaults typically increase in recessions. Mortgage bonds might not be the best alternative because of the typically embedded option to refinance at a lower yield, and all else equal, a higher duration is preferred as it provides higher exposure to the increase in prices when the yield curve goes down.
Timing: Timing the yield curve’s drop and how it will drop is an arguably impossible feat. So, selecting an individual bond maturity or a specific year of maturity is not among the options to maximize the opportunity. On the other hand, yield curve changes take time and change shape, a benefit that a single bond might not reflect.
As we saw during the pandemic, quantitative easing could likely be implemented if the economy entered a recession, and interest rates would lower to stimulate the economy relatively rapidly. In contrast, if the economy manages to avoid a recession, the normalization or steepening of the yield curve would happen more reasonably.
Inflation: the Fed is in a tight spot. Rising rates to lower inflation could constrict economic activity as saving increases and consumption decreases, which could trigger a recession. However, lowering rates might increase inflation further. While December metrics are promising, the maneuverability of rates is constrained, so unless there are drastic events, the normalization of the yield curve is likely to take time.
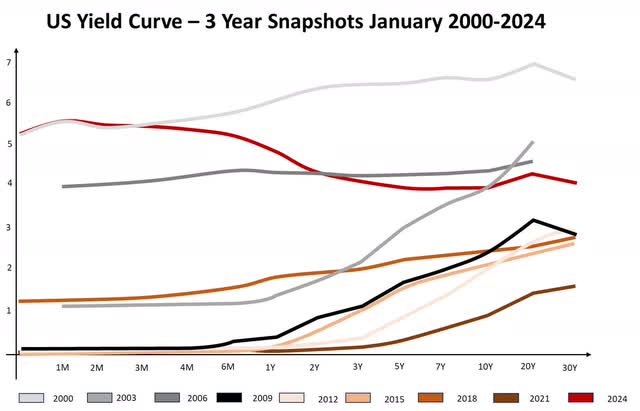
Yield Curve level: The current yield curve is inverted and above what has been present this century. While the correction of the yield curve could theoretically be accomplished by increasing long-term yields and leaving short-term yields at current levels, it makes more sense, following long-term targets of inflation and growth of the US economy, that long term rates equilibrium is at a lower level than what it is today.

US Yield Curve – 3-Year Snapshots January 2000-2024 (Created by author with data from US Yield data)
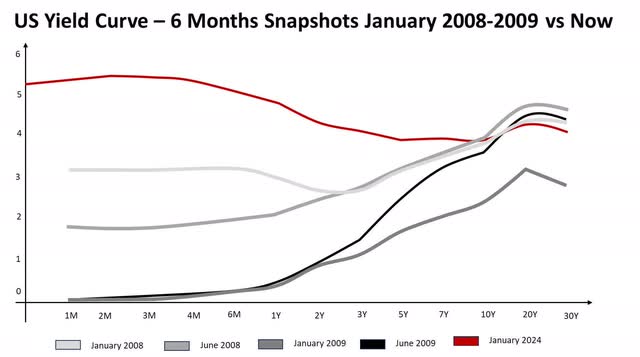
The chart above, while not a formal statistical model, shows the tendency to have a lower level in the interest rates and the relative rapid movement interest rates could have. The highest level in the graph is just a few years before the 2000.com bubble burst, and an exciting pattern is shown when we compare the 2008 environment with today’s yield curve.

US Yield Curve – 6 Months Snapshots January 2008-2009 vs Now (Created by author with data from US Yield data)
While timing the shift in the yield curve is arguably impossible, the chart above could serve as a visual representation of how I believe the natural progression of the yield curve could be. How fast or slow that progression takes to evolve would depend on how the economy develops in the next 1-3 years.
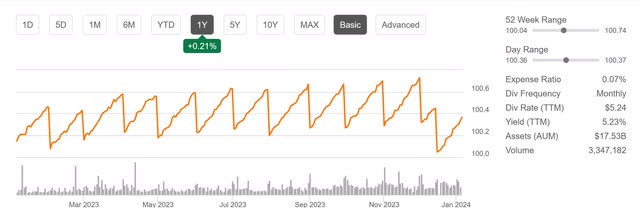
The actual value of the Inverted Yield Curve: The unusual state of the yield curve presents two opportunities. The first one is to have a high yield paired with high liquidity, as the yield is usually lower the shorter the bond duration. For now, short-term bonds provide the opportunity to have your cake and eat it, too. That is the purpose of the first part of the bond play; SGOV ETF is built with Treasury bonds with maturities of 0 to 3 months, and it is now providing a yield of 5.24% with an expense ratio of 0.07.

SGOV info (Seeking Alpha)
The second one is to have a relatively high yield, long-term bond with the expectation of price appreciation. Most of the time, long-term bonds would yield a lower result and have a higher risk of price depreciation. This is where TLH comes in, providing a relatively high yield for the historical levels of the yield curve and the opportunity to get exposure to possible price appreciation if the yield curve steepens.

TLH Info (Seeking Alpha)
Combining these two strategies allows for the increase of yield while maintaining both liquidity and the possibility of price appreciation while the yield curve returns to a more sustainable level.
Risks
Legend has it that many great investors perform the full valuation of securities they are considering, and only after they reach a conclusion do they look up the trading price.
This is because of the anchoring bias. We tend to anchor data in our brains and unconsciously make decisions so they make internal sense with what we have anchored. The book “Thinking Fast and Slow.” Daniel Kahneman goes into much more detail about this phenomenon. He provides detailed examples of security and safety measures that used historical information to set stress limits for the systems with disastrous consequences.
Similarly, the belief that “Yields cannot go much higher” because historically they haven’t been much higher, or at least not in recent history in the US, is an example of this bias. Unforeseen circumstances could cause the long-term interest rates to increase further, resulting in a price correction.
This admitted risk is partially mitigated by the pairing of short-term maturities, whose price would be less affected by the theoretical increase in the yield but would quickly provide a higher yield.
This also provides perspective on the proportion of SGOV and TLH an investor could consider. A more risk-averse inversion could prefer a higher percentage of SGOV and take advantage of its low-risk and high yield for this time. A more risk-seeking investor might prefer a higher percentage of TLH, exposed to higher risk if the yield increases but taking advantage in the long term if the curve steepens.
Conclusions
As we have discussed, I believe the current market conditions call for a flexible, two-piece ‘swimsuit’ approach. Utilizing SGOV and TLH in a barbell portfolio offers high liquidity and potential price appreciation as the yield curve normalizes. While this pair trade is not without its risks, the long-term equilibrium of the US economy is unlikely to change in the mid-term, as no drastic demographic changes have occurred that could put this into question. So, there is a reasonable expectation that the yield curve will steepen in the long term.
Last year, I returned to Seeking Alpha after obtaining the CFA designation and set to document how I am fixing my portfolio. A significant part of how I am fixing the portfolio is balancing exposures and eliminating biases present in the portfolio.
These two ETFs are good examples of both. While typically 20-30-year bonds are considered conservative low-risk plays, those securities have lost value in the past three years due to the drastic changes in the yield curve. At the same time, short-term bonds are usually low-yielding and have provided a relatively good return in this time frame.
Separately, these ETFs might not fit many investors’ needs or risk profiles but are put together in this mini barbell portfolio; one can customize the exposure and risks they provide.
In the past months, I have written two articles about a possible recession or slowdown of the economy, one touching on the subject of antifragility and another about stock macro shifts in choppy waters. As Taleb points out in Antifragile, predicting is a poor use of time in chaotic systems, while preparing is a much better use of resources. I believe this is the right approach when dealing with volatile situations.
This article differs from my regular stock articles as the underlying is different. So, it is proper to clarify that this is not a recommendation on how to build a bond portfolio. The purpose is to provide context on the bond market, how I believe it will evolve, and how I play a part in my fixed-income portfolio. There are many considerations for individual investors not covered here, like tie horizon, tax situation, and risk profile, which are not covered here and might make other alternatives more suitable.


