
ArtistGNDphotography
Limbach Holdings, Inc. (NASDAQ:LMB) experienced a substantial increase in revenue, primarily driven by the exceptional performance of the ODR and GCR segments. A significant improvement in the company’s gross margin was highlighted, leading to a marked increase in gross profit. Additionally, the company achieved a notable increase in net income, supported by effective operational expense management and strategic planning. This piece extends the discussion initiated in the previous article, offering an analysis of Limbach Holdings following the Q3 2023 earnings report. It delves into a detailed technical examination of the stock’s performance to unearth potential investment avenues. The stock price maintains a robust bullish trend, consistently trading in overbought zones. Despite this, the bullish pricing pattern holds steady, signaling potential for continued bullish momentum.
Financial Growth for Limbach Holdings
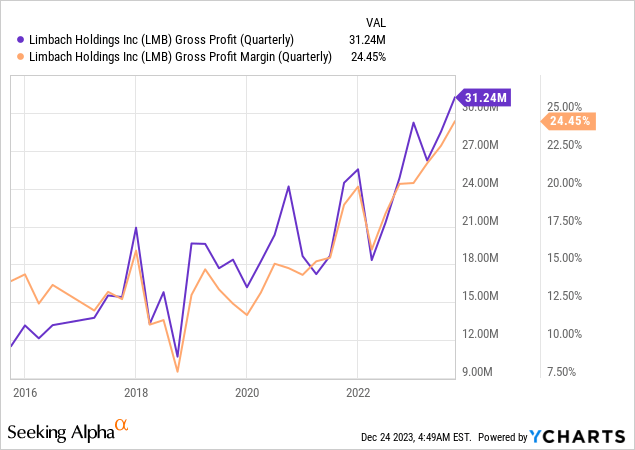
Limbach’s consolidated revenue increased to $127.8 million, a 4.4% increase from the $122.4 million reported in Q3 2022. This growth was primarily driven by the ODR segment, which saw a revenue increase of 10.3% to $65.8 million. The GCR segment’s revenue remained stable, contributing to the company’s overall top-line growth. The company’s consolidated gross margin improved significantly, increasing to 24.45% from 20.3% in the previous year. This increase translated into a gross profit of $31.24 million, up from $24.9 million. ODR and GCR segments experienced margin improvements attributed to favorable contract mixes and efficient project management. The consistent rise in gross profits over the past few years reflects the company’s increasing profitability.
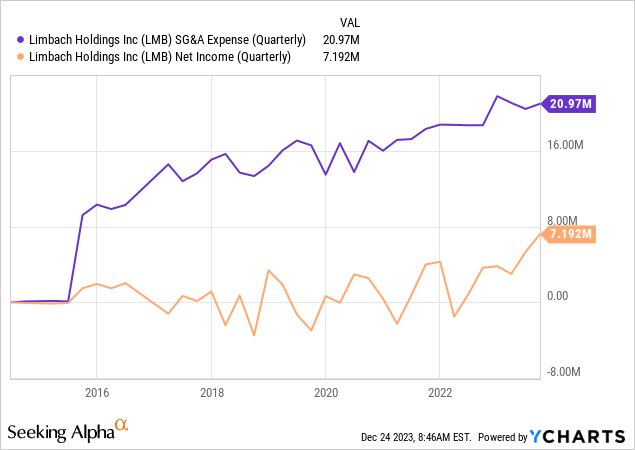
Limbach’s growth strategy included successful acquisitions, namely ACME Industrial and Industrial Air. These acquisitions align with the company’s criteria, enhancing its market presence and expanding its operational scope. The expenses of selling, general, and administrative (SG&A) increased to $20.97 million, primarily due to increased payroll and professional fees. Despite this, the company posted a substantial net income of $7.192 million, a notable increase from $3.6 million in Q3 2022, as shown in the chart below. This was partly attributed to the efficient management of operating expenses and strategic financial planning.
Despite higher interest rates, Limbach’s interest expense decreased due to a lower overall debt balance. Additionally, the company earned $0.4 million in interest income, benefiting from investments in various financial instruments. The company’s Adjusted EBITDA witnessed a significant increase, reaching $13.6 million, up 33.6% from the previous year, reflecting strong operational efficiency and effective cost management. Furthermore, Net cash from operating activities increased to $17.2 million. The company’s balance sheet remained solid, with cash and cash equivalents of $57.5 million and a healthy current ratio of 1.57x. This financial stability is further underscored by a notable increase in working capital to $77.7 million.
In summary, Limbach Holdings demonstrated a notable increase in consolidated revenue and gross margin in Q3 2023, with consolidated revenue rising to $127.8 million and gross margin improving to 24.45%. These gains are attributed to the strong performance in both the ODR and GCR segments, efficient project management, and favorable contract mixes. Coupled with strategic acquisitions and effective financial management, these factors have enhanced Limbach’s market presence and solidified its financial stability, as evidenced by the substantial growth in net income, adjusted EBITDA, and a strong balance sheet.
Deciphering the Ongoing Bullish Momentum
Recap
The previous article highlighted the solid bullish trend in Limbach Holdings, focusing on the monthly and weekly charts. It was noted that the stock was shaping an impressive inverted head and shoulders pattern, with a pivotal breakout above the $16 neckline. This development has sparked a significant rally, suggesting a potential for further price increases, even amidst overbought conditions. The weekly charts confirmed these overbought conditions, where the RSI indicated overextension. However, given the strength of the long-term price trajectory, a continued rise in prices was anticipated. The weekly charts also emphasized the inverted head and shoulders formation and the stock’s approach to resistance levels, hinting at possible price consolidation.
The Next Move
The stock has embarked on a robust upward trend, aligning with expectations, and has climbed to elevated levels. The long-term quarterly chart below showcases significant price fluctuations throughout 2022 and 2023, highlighting notable volatility. This volatility is particularly evident in the quarterly candles of 2023. Notably, the last quarter of 2023 has displayed a solid quarterly candle, concluding the year on a high note. The pronounced upturn in the quarterly chart can be traced back to 2018 lows of $3.56, 2020 lows of $2.37, and 2022 lows of $4.90, with a breakthrough above $16, signifying a formidable rally and suggesting potential bullish trends ahead.
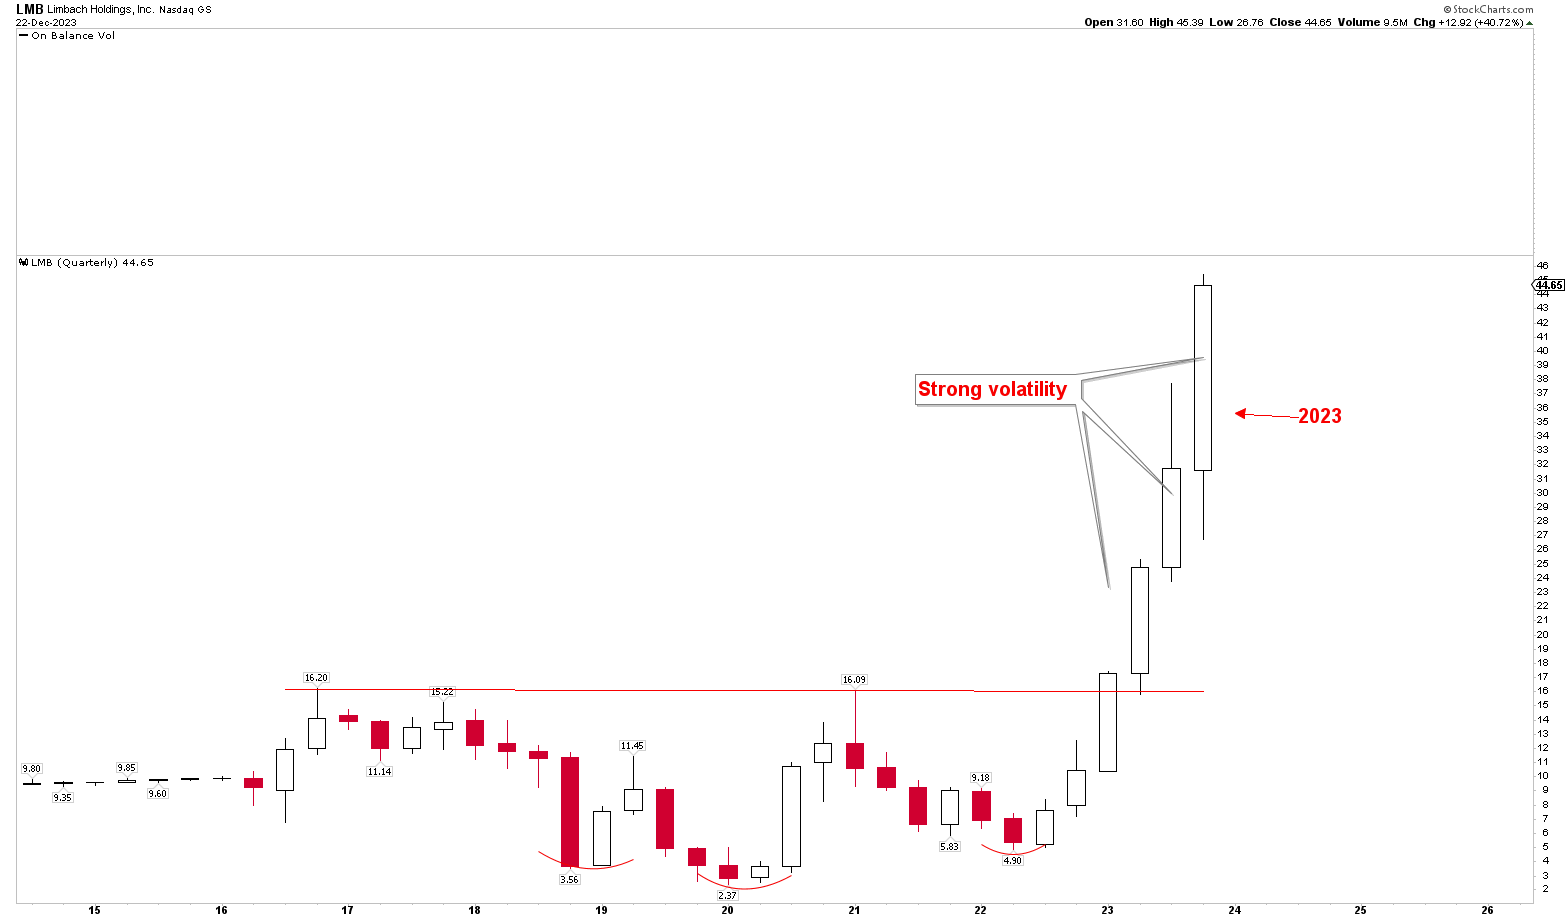
LMB Yearly Chart (StockCharts.com)
The revised monthly chart from the previous article shows pronounced monthly candles for November and December 2023, suggesting that the year will likely end on a high note. Despite recent overbought conditions, the price structure indicates continuing bullish momentum.
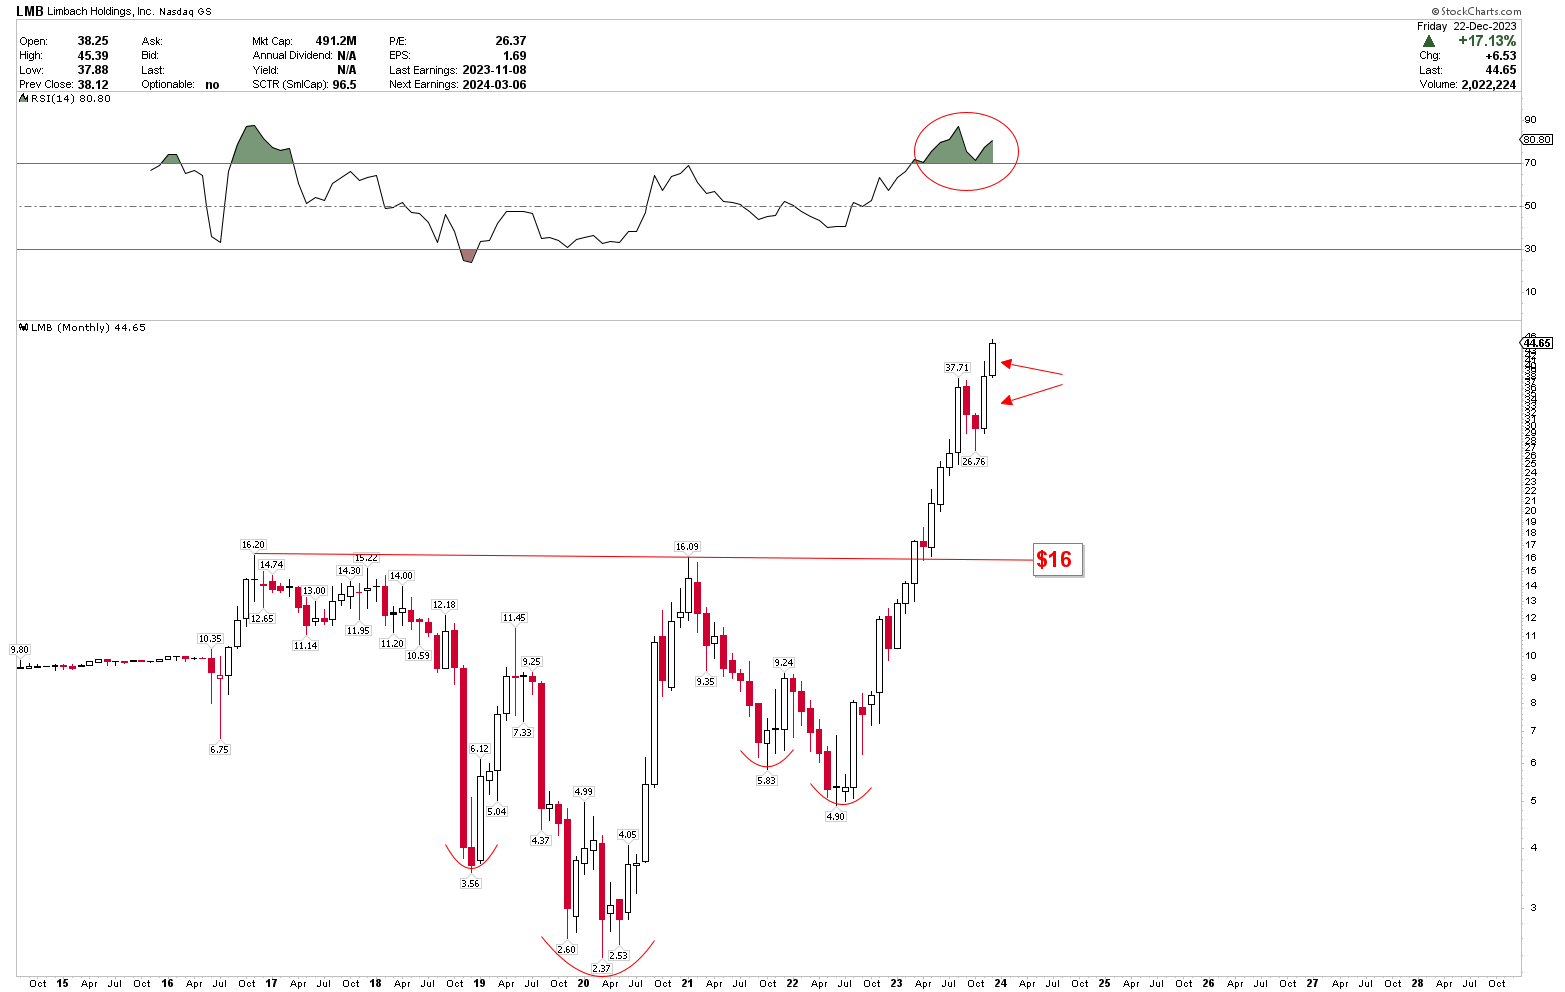
LMB Monthly Chart (StockCharts.com)
Delving into the bullish trend, the weekly chart below demonstrates the stock’s trajectory within a red channel, nearing a significant resistance area. A corrective phase in September and October 2023 bottomed out at $26.76 along the blue trend line, leading to another market surge exceeding record highs. The weekly chart’s structure, featuring a bullish inverted head and shoulders pattern, with the head at $4.90 and shoulders at $5.83 and $6.28, underscores the persisting bullish momentum in the market despite overbought conditions.
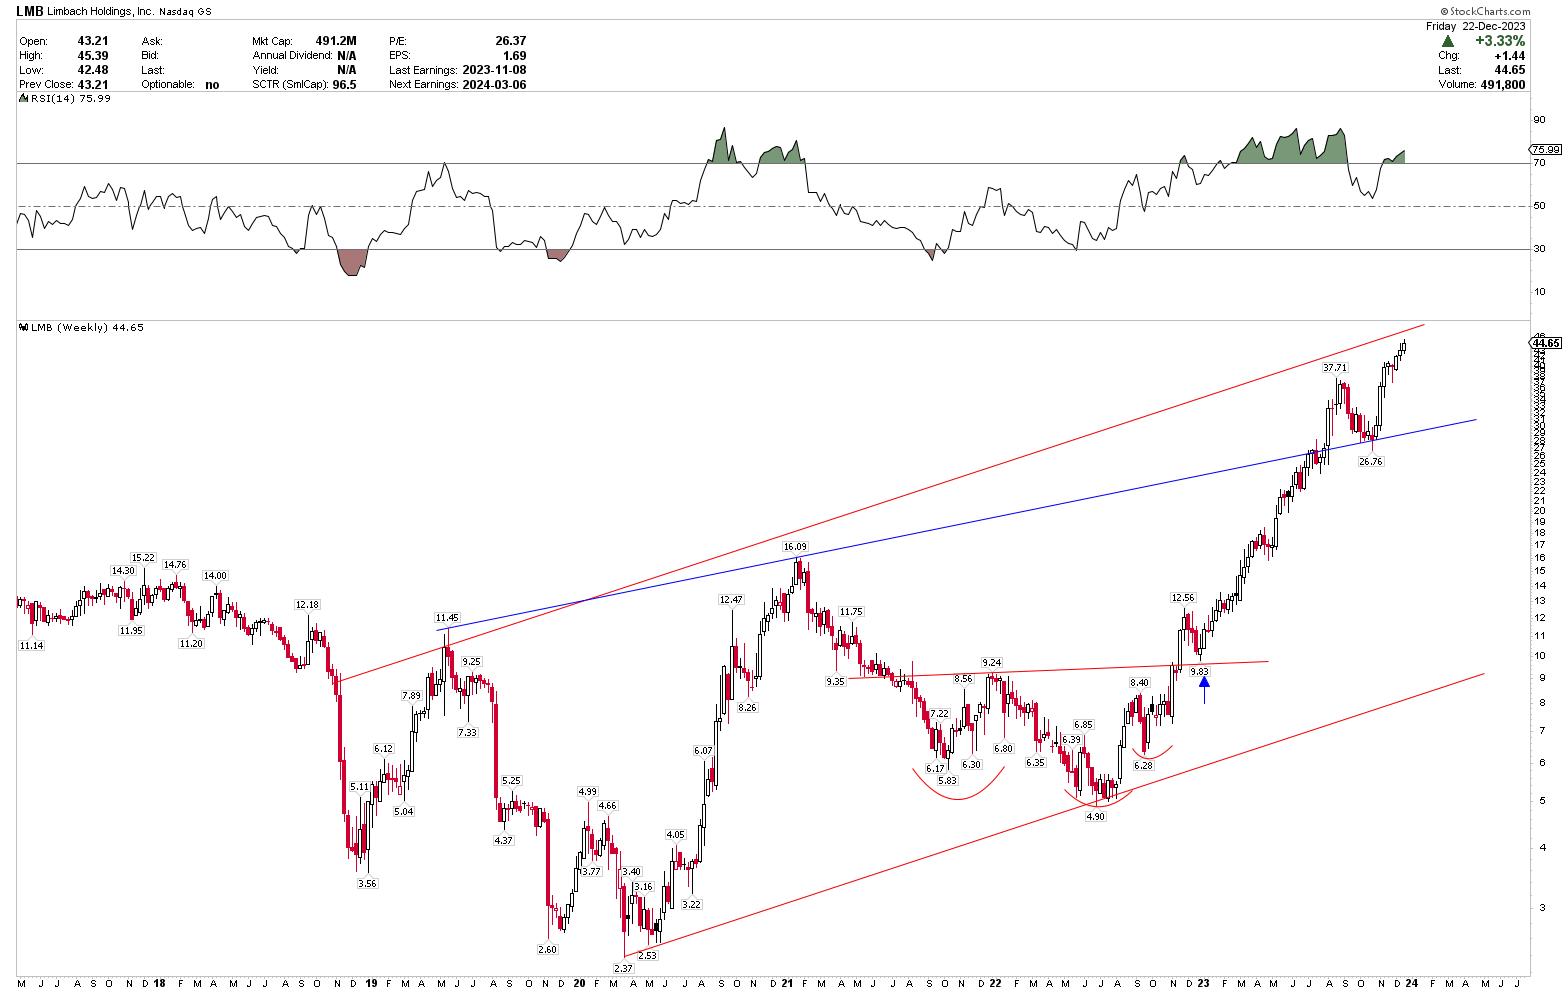
LMB Weekly Chart (StockCharts.com)
Interestingly, the short-term daily chart below captures the bullish momentum, marked by a rounding bottom with a low at $26.76. Investors may consider increasing long positions, expecting further bullish momentum.
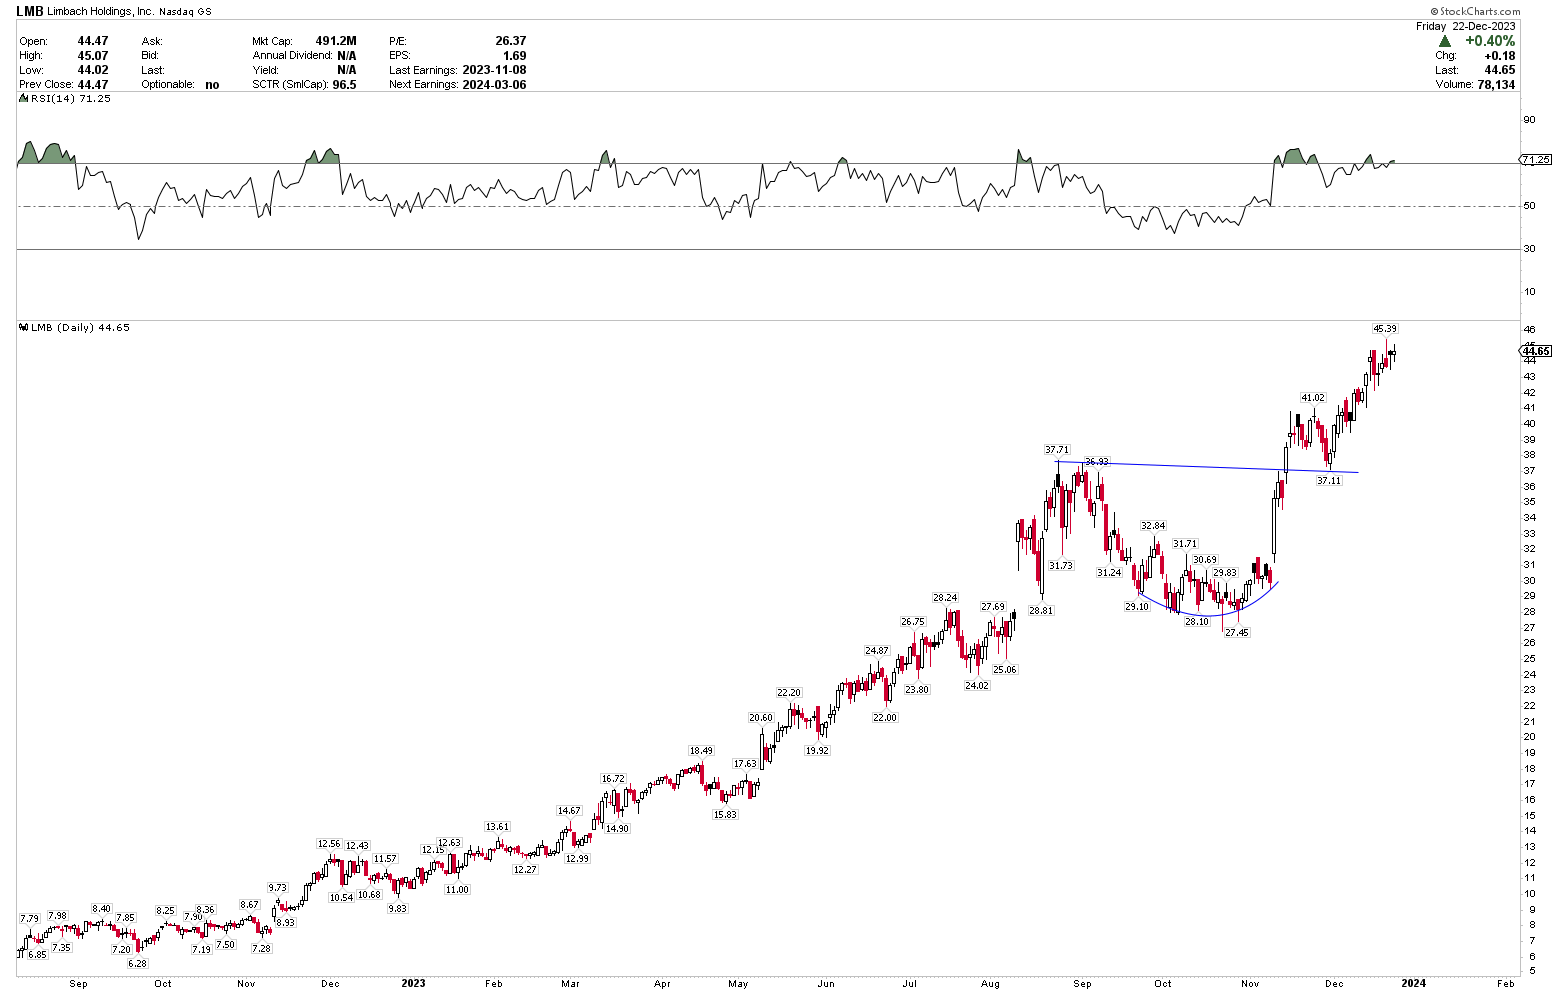
LMB Daily Chart (StockCharts.com)
Market Risks
The exceptional growth for Limbach Holdings brings market risks, particularly in an environment of economic volatility. The company’s reliance on ODR and GCR segments could be vulnerable to economic downturns. In a rapidly changing economic landscape, any signs of economic slowdown or sector-specific challenges could adversely affect investor sentiment and Limbach’s stock performance. While the long-term trend remains positive, with an impressive inverted head and shoulders pattern suggesting continued price increases, there’s a risk of a market correction due to overbought conditions. A slight pullback might be seen as a chance to buy, but if prices fall below $26, it could increase the likelihood of further downward momentum.
Bottom Line
In conclusion, Limbach Holdings’ financial and operational performance in Q3 2023 has been solid, marked by substantial revenue, gross margin, and net income increases, primarily driven by the robust performance of ODR and GCR segments. Strategic acquisitions and efficient operational expense management further bolster this financial success. However, despite the bullish trends in its stock performance, investors should be aware of the inherent market risks, especially in a volatile economic environment. The emergence of an inverted head and shoulder indicates the strong bullish price structures. Moreover, the solid quarterly candles and strong 2023 closure highlight the continuation of strong bullish momentum into 2024. Investors may consider buying Limbach Holdings if the stock price stays above $26.

 Q2 2024 Earnings Call Transcript")

